Powerpoint Diagrams

Deployment Of Digital Twin In Healthcare Organizations Ppt PowerPoint Presentation Diagram Graph Charts PDF
This slide represents the application of digital twin technology in healthcare institutions to improve healthcare operational efficiency and improved personalized care. Here you can discover an assortment of the finest PowerPoint and Google Slides templates. With these templates, you can create presentations for a variety of purposes while simultaneously providing your audience with an eye catching visual experience. Download Deployment Of Digital Twin In Healthcare Organizations Ppt PowerPoint Presentation Diagram Graph Charts PDF to deliver an impeccable presentation. These templates will make your job of preparing presentations much quicker, yet still, maintain a high level of quality. Slidegeeks has experienced researchers who prepare these templates and write high quality content for you. Later on, you can personalize the content by editing the Deployment Of Digital Twin In Healthcare Organizations Ppt PowerPoint Presentation Diagram Graph Charts PDF.
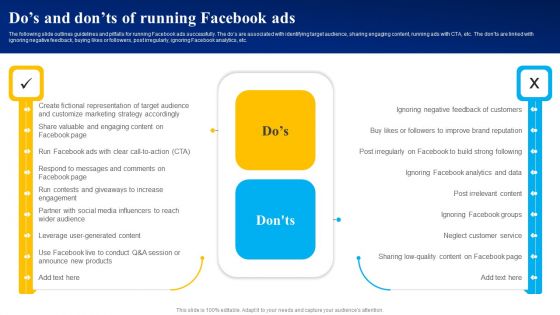
Dos And Donts Of Running Facebook Ads Ppt PowerPoint Presentation Diagram Graph Charts PDF
The following slide outlines guidelines and pitfalls for running Facebook ads successfully. The dos are associated with identifying target audience, sharing engaging content, running ads with CTA, etc. The donts are linked with ignoring negative feedback, buying likes or followers, post irregularly, ignoring Facebook analytics, etc. Formulating a presentation can take up a lot of effort and time, so the content and message should always be the primary focus. The visuals of the PowerPoint can enhance the presenters message, so our Dos And Donts Of Running Facebook Ads Ppt PowerPoint Presentation Diagram Graph Charts PDF was created to help save time. Instead of worrying about the design, the presenter can concentrate on the message while our designers work on creating the ideal templates for whatever situation is needed. Slidegeeks has experts for everything from amazing designs to valuable content, we have put everything into Dos And Donts Of Running Facebook Ads Ppt PowerPoint Presentation Diagram Graph Charts PDF.
Influencers Marketing Campaign Performance Tracking Dashboard Ppt PowerPoint Presentation Diagram Lists PDF
This slide covers performance monitoring dashboard of influencer based referral marketing program. It includes elements such as impressions on Instagram, likes, comments, clicks, sales generated along with value calculators and campaign breakdown based on gender and age. Formulating a presentation can take up a lot of effort and time, so the content and message should always be the primary focus. The visuals of the PowerPoint can enhance the presenters message, so our Influencers Marketing Campaign Performance Tracking Dashboard Ppt PowerPoint Presentation Diagram Lists PDF was created to help save time. Instead of worrying about the design, the presenter can concentrate on the message while our designers work on creating the ideal templates for whatever situation is needed. Slidegeeks has experts for everything from amazing designs to valuable content, we have put everything into Influencers Marketing Campaign Performance Tracking Dashboard Ppt PowerPoint Presentation Diagram Lists PDF
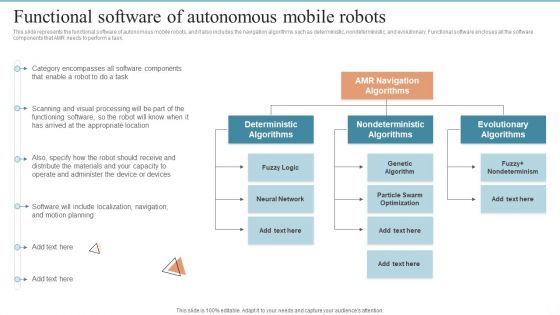
AMR Robot Functional Software Of Autonomous Mobile Robots Ppt PowerPoint Presentation Diagram Lists PDF
This slide represents the functional software of autonomous mobile robots, and it also includes the navigation algorithms such as deterministic, nondeterministic, and evolutionary. Functional software encloses all the software components that AMR needs to perform a task. Here you can discover an assortment of the finest PowerPoint and Google Slides templates. With these templates, you can create presentations for a variety of purposes while simultaneously providing your audience with an eye catching visual experience. Download AMR Robot Functional Software Of Autonomous Mobile Robots Ppt PowerPoint Presentation Diagram Lists PDF to deliver an impeccable presentation. These templates will make your job of preparing presentations much quicker, yet still, maintain a high level of quality. Slidegeeks has experienced researchers who prepare these templates and write high quality content for you. Later on, you can personalize the content by editing the AMR Robot Functional Software Of Autonomous Mobile Robots Ppt PowerPoint Presentation Diagram Lists PDF.

Organization Structure After Hiring For Global Expansion Ppt PowerPoint Presentation Diagram Lists PDF
This slide showcases changes in organizational structure after hiring for global expansion. It showcases structure for three divisions which are north America, India and South America.Formulating a presentation can take up a lot of effort and time, so the content and message should always be the primary focus. The visuals of the PowerPoint can enhance the presenters message, so our Organization Structure After Hiring For Global Expansion Ppt PowerPoint Presentation Diagram Lists PDF was created to help save time. Instead of worrying about the design, the presenter can concentrate on the message while our designers work on creating the ideal templates for whatever situation is needed. Slidegeeks has experts for everything from amazing designs to valuable content, we have put everything into Organization Structure After Hiring For Global Expansion Ppt PowerPoint Presentation Diagram Lists PDF.
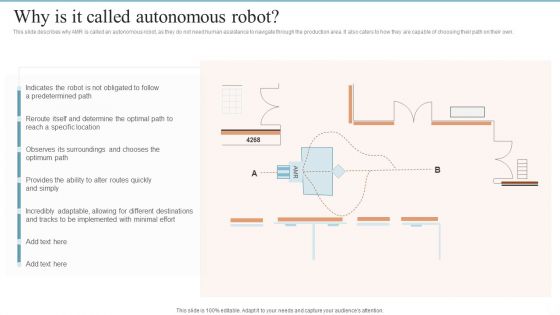
AMR Robot Why Is IT Called Autonomous Robot Ppt PowerPoint Presentation Diagram Images PDF
This slide describes why AMR is called an autonomous robot, as they do not need human assistance to navigate through the production area. It also caters to how they are capable of choosing their path on their own. If you are looking for a format to display your unique thoughts, then the professionally designed AMR Robot Why Is IT Called Autonomous Robot Ppt PowerPoint Presentation Diagram Images PDF is the one for you. You can use it as a Google Slides template or a PowerPoint template. Incorporate impressive visuals, symbols, images, and other charts. Modify or reorganize the text boxes as you desire. Experiment with shade schemes and font pairings. Alter, share or cooperate with other people on your work. Download AMR Robot Why Is IT Called Autonomous Robot Ppt PowerPoint Presentation Diagram Images PDF and find out how to give a successful presentation. Present a perfect display to your team and make your presentation unforgettable.
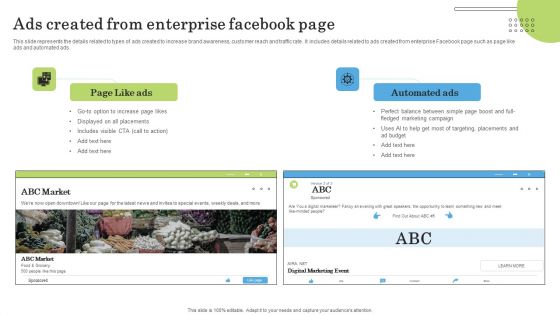
Ads Created From Enterprise Facebook Page Ppt PowerPoint Presentation Diagram Lists PDF
This slide represents the details related to types of ads created to increase brand awareness, customer reach and traffic rate. It includes details related to ads created from enterprise Facebook page such as page like ads and automated ads. If you are looking for a format to display your unique thoughts, then the professionally designed Ads Created From Enterprise Facebook Page Ppt PowerPoint Presentation Diagram Lists PDF is the one for you. You can use it as a Google Slides template or a PowerPoint template. Incorporate impressive visuals, symbols, images, and other charts. Modify or reorganize the text boxes as you desire. Experiment with shade schemes and font pairings. Alter, share or cooperate with other people on your work. Download Ads Created From Enterprise Facebook Page Ppt PowerPoint Presentation Diagram Lists PDF and find out how to give a successful presentation. Present a perfect display to your team and make your presentation unforgettable.
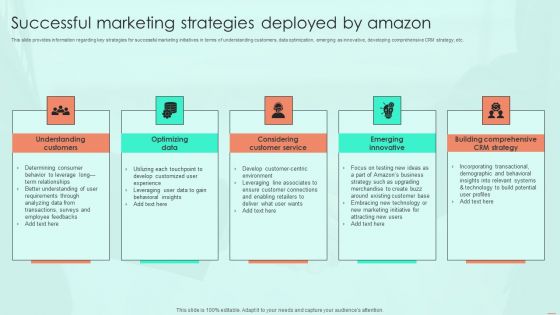
Successful Marketing Strategies Deployed By Amazon Ppt PowerPoint Presentation Diagram Lists PDF
This slide provides information regarding key strategies for successful marketing initiatives in terms of understanding customers, data optimization, emerging as innovative, developing comprehensive CRM strategy, etc. If you are looking for a format to display your unique thoughts, then the professionally designed Successful Marketing Strategies Deployed By Amazon Ppt PowerPoint Presentation Diagram Lists PDF is the one for you. You can use it as a Google Slides template or a PowerPoint template. Incorporate impressive visuals, symbols, images, and other charts. Modify or reorganize the text boxes as you desire. Experiment with shade schemes and font pairings. Alter, share or cooperate with other people on your work. Download Successful Marketing Strategies Deployed By Amazon Ppt PowerPoint Presentation Diagram Lists PDF and find out how to give a successful presentation. Present a perfect display to your team and make your presentation unforgettable.
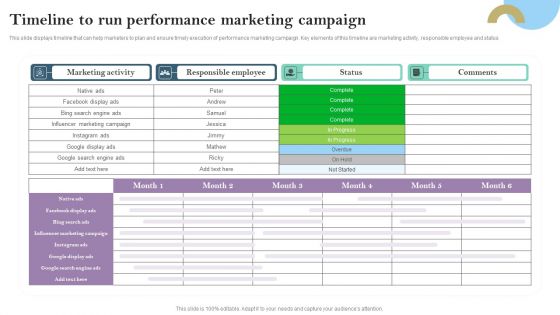
Timeline To Run Performance Marketing Campaign Ppt PowerPoint Presentation Diagram Templates PDF
This slide displays timeline that can help marketers to plan and ensure timely execution of performance marketing campaign. Key elements of this timeline are marketing activity, responsible employee and status If you are looking for a format to display your unique thoughts, then the professionally designed Timeline To Run Performance Marketing Campaign Ppt PowerPoint Presentation Diagram Templates PDF is the one for you. You can use it as a Google Slides template or a PowerPoint template. Incorporate impressive visuals, symbols, images, and other charts. Modify or reorganize the text boxes as you desire. Experiment with shade schemes and font pairings. Alter, share or cooperate with other people on your work. Download Timeline To Run Performance Marketing Campaign Ppt PowerPoint Presentation Diagram Templates PDF and find out how to give a successful presentation. Present a perfect display to your team and make your presentation unforgettable.

Future Predictions For Upcoming Advanced Technologies Across It Ppt PowerPoint Presentation Diagram Lists PDF
This slide provides information regarding the future prediction of the latest technologies across IT sector. Major trends include hyper-automation, edge computing, extended reality, datafication, etc. If you are looking for a format to display your unique thoughts, then the professionally designed Future Predictions For Upcoming Advanced Technologies Across It Ppt PowerPoint Presentation Diagram Lists PDF is the one for you. You can use it as a Google Slides template or a PowerPoint template. Incorporate impressive visuals, symbols, images, and other charts. Modify or reorganize the text boxes as you desire. Experiment with shade schemes and font pairings. Alter, share or cooperate with other people on your work. Download Future Predictions For Upcoming Advanced Technologies Across It Ppt PowerPoint Presentation Diagram Lists PDF and find out how to give a successful presentation. Present a perfect display to your team and make your presentation unforgettable.
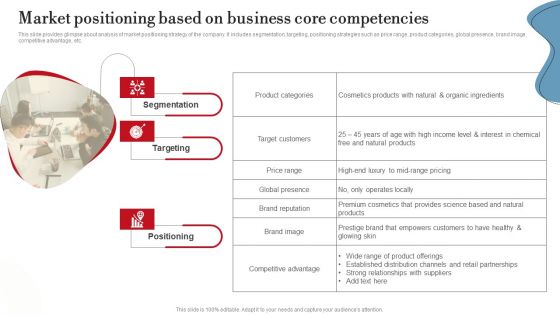
Market Positioning Based On Business Core Competencies Ppt PowerPoint Presentation Diagram Lists PDF
This slide provides glimpse about analysis of market positioning strategy of the company. It includes segmentation, targeting, positioning strategies such as price range, product categories, global presence, brand image, competitive advantage, etc. If you are looking for a format to display your unique thoughts, then the professionally designed Market Positioning Based On Business Core Competencies Ppt PowerPoint Presentation Diagram Lists PDF is the one for you. You can use it as a Google Slides template or a PowerPoint template. Incorporate impressive visuals, symbols, images, and other charts. Modify or reorganize the text boxes as you desire. Experiment with shade schemes and font pairings. Alter, share or cooperate with other people on your work. Download Market Positioning Based On Business Core Competencies Ppt PowerPoint Presentation Diagram Lists PDF and find out how to give a successful presentation. Present a perfect display to your team and make your presentation unforgettable.
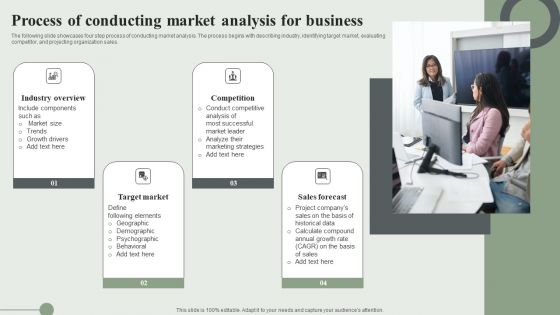
Process Of Conducting Market Analysis For Business Ppt PowerPoint Presentation Diagram PDF
The following slide showcases four step process of conducting market analysis. The process begins with describing industry, identifying target market, evaluating competitor, and projecting organization sales. If you are looking for a format to display your unique thoughts, then the professionally designed Process Of Conducting Market Analysis For Business Ppt PowerPoint Presentation Diagram PDF is the one for you. You can use it as a Google Slides template or a PowerPoint template. Incorporate impressive visuals, symbols, images, and other charts. Modify or reorganize the text boxes as you desire. Experiment with shade schemes and font pairings. Alter, share or cooperate with other people on your work. Download Process Of Conducting Market Analysis For Business Ppt PowerPoint Presentation Diagram PDF and find out how to give a successful presentation. Present a perfect display to your team and make your presentation unforgettable.

Advantages And Disadvantages Of Proxy Based Deployment Ppt PowerPoint Presentation Diagram Images PDF
This slide represents the benefits and drawbacks of proxy-based CASB deployment. The purpose of this slide is to showcase the various pros and cons of proxy-based cloud access security brokers and the advantages cover flexibility, secure SaaS applications, and so on. If you are looking for a format to display your unique thoughts, then the professionally designed Advantages And Disadvantages Of Proxy Based Deployment Ppt PowerPoint Presentation Diagram Images PDF is the one for you. You can use it as a Google Slides template or a PowerPoint template. Incorporate impressive visuals, symbols, images, and other charts. Modify or reorganize the text boxes as you desire. Experiment with shade schemes and font pairings. Alter, share or cooperate with other people on your work. Download Advantages And Disadvantages Of Proxy Based Deployment Ppt PowerPoint Presentation Diagram Images PDF and find out how to give a successful presentation. Present a perfect display to your team and make your presentation unforgettable.
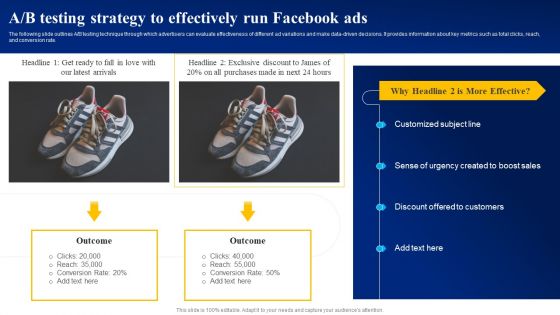
A B Testing Strategy To Effectively Run Facebook Ads Ppt PowerPoint Presentation Diagram PDF
The following slide outlines A or B testing technique through which advertisers can evaluate effectiveness of different ad variations and make data-driven decisions. It provides information about key metrics such as total clicks, reach, and conversion rate. If you are looking for a format to display your unique thoughts, then the professionally designed A B Testing Strategy To Effectively Run Facebook Ads Ppt PowerPoint Presentation Diagram PDF is the one for you. You can use it as a Google Slides template or a PowerPoint template. Incorporate impressive visuals, symbols, images, and other charts. Modify or reorganize the text boxes as you desire. Experiment with shade schemes and font pairings. Alter, share or cooperate with other people on your work. Download A B Testing Strategy To Effectively Run Facebook Ads Ppt PowerPoint Presentation Diagram PDF and find out how to give a successful presentation. Present a perfect display to your team and make your presentation unforgettable.

Keyword Performance Scorecard For SEO Ppt PowerPoint Presentation Diagram Images PDF
The following slide displays key metrics of measuring the success of keyword. These metrics can be clicks, average CPC, CTR, Cost, Average position, conversion and conversation rate etc. Here you can discover an assortment of the finest PowerPoint and Google Slides templates. With these templates, you can create presentations for a variety of purposes while simultaneously providing your audience with an eye catching visual experience. Download Keyword Performance Scorecard For SEO Ppt PowerPoint Presentation Diagram Images PDF to deliver an impeccable presentation. These templates will make your job of preparing presentations much quicker, yet still, maintain a high level of quality. Slidegeeks has experienced researchers who prepare these templates and write high quality content for you. Later on, you can personalize the content by editing the Keyword Performance Scorecard For SEO Ppt PowerPoint Presentation Diagram Images PDF.

Strategies To Develop Augmented Intelligence For Business Ppt PowerPoint Presentation Diagram PDF
This slide represents the strategies to develop augmented intelligence to build a strong foundation for innovation in business. It includes integration of human and machine workforce governance, migration of data to the cloud, and so on. Formulating a presentation can take up a lot of effort and time, so the content and message should always be the primary focus. The visuals of the PowerPoint can enhance the presenters message, so our Strategies To Develop Augmented Intelligence For Business Ppt PowerPoint Presentation Diagram PDF was created to help save time. Instead of worrying about the design, the presenter can concentrate on the message while our designers work on creating the ideal templates for whatever situation is needed. Slidegeeks has experts for everything from amazing designs to valuable content, we have put everything into Strategies To Develop Augmented Intelligence For Business Ppt PowerPoint Presentation Diagram PDF.

Role Of Umbrella Branding Strategies On Brand Equity Growth Ppt PowerPoint Presentation Diagram Images PDF
This slide provides information regarding role of umbrella branding strategies on brand equity growth from individual domestic brand to global brand by considering brand control, strategic intent, etc. Here you can discover an assortment of the finest PowerPoint and Google Slides templates. With these templates, you can create presentations for a variety of purposes while simultaneously providing your audience with an eye-catching visual experience. Download Role Of Umbrella Branding Strategies On Brand Equity Growth Ppt PowerPoint Presentation Diagram Images PDF to deliver an impeccable presentation. These templates will make your job of preparing presentations much quicker, yet still, maintain a high level of quality. Slidegeeks has experienced researchers who prepare these templates and write high-quality content for you. Later on, you can personalize the content by editing the Role Of Umbrella Branding Strategies On Brand Equity Growth Ppt PowerPoint Presentation Diagram Images PDF.
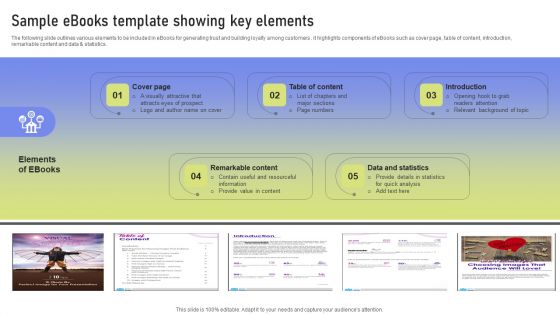
Sample Ebooks Template Showing Key Elements Ppt PowerPoint Presentation Diagram PDF
The following slide outlines various elements to be included in eBooks for generating trust and building loyalty among customers . it highlights components of eBooks such as cover page, table of content, introduction, remarkable content and data and statistics. Here you can discover an assortment of the finest PowerPoint and Google Slides templates. With these templates, you can create presentations for a variety of purposes while simultaneously providing your audience with an eye catching visual experience. Download Sample Ebooks Template Showing Key Elements Ppt PowerPoint Presentation Diagram PDF to deliver an impeccable presentation. These templates will make your job of preparing presentations much quicker, yet still, maintain a high level of quality. Slidegeeks has experienced researchers who prepare these templates and write high quality content for you. Later on, you can personalize the content by editing the Sample Ebooks Template Showing Key Elements Ppt PowerPoint Presentation Diagram PDF.

Additional Feature Required To Streamline Call Center Process Ppt PowerPoint Presentation Diagram Templates PDF
This slide showcases additional features required to streamline the process which includes interactive voice response, call queuing, appointment reminder and outbound call limiting. Here you can discover an assortment of the finest PowerPoint and Google Slides templates. With these templates, you can create presentations for a variety of purposes while simultaneously providing your audience with an eye catching visual experience. Download Additional Feature Required To Streamline Call Center Process Ppt PowerPoint Presentation Diagram Templates PDF to deliver an impeccable presentation. These templates will make your job of preparing presentations much quicker, yet still, maintain a high level of quality. Slidegeeks has experienced researchers who prepare these templates and write high quality content for you. Later on, you can personalize the content by editing the Additional Feature Required To Streamline Call Center Process Ppt PowerPoint Presentation Diagram Templates PDF.

Plan To Run Display Advertising Campaign Ppt PowerPoint Presentation Diagram Templates PDF
This slide showcases plan that can help marketer to run online display ads and generate new leads. Key elements of plan are - advertisement, ad size, ad type, device, ad network, ad duration and budget Formulating a presentation can take up a lot of effort and time, so the content and message should always be the primary focus. The visuals of the PowerPoint can enhance the presenters message, so our Plan To Run Display Advertising Campaign Ppt PowerPoint Presentation Diagram Templates PDF was created to help save time. Instead of worrying about the design, the presenter can concentrate on the message while our designers work on creating the ideal templates for whatever situation is needed. Slidegeeks has experts for everything from amazing designs to valuable content, we have put everything into Plan To Run Display Advertising Campaign Ppt PowerPoint Presentation Diagram Templates PDF

Introduction To Unplanned Change Management For Tackling Unexpected Events Ppt PowerPoint Presentation Diagram Lists PDF
This slide represents the overview of the changes implemented due to rise of unexpected events in the organization. It includes details related to types of unplanned changes such as shift to remote work and loss of critical personnel. Formulating a presentation can take up a lot of effort and time, so the content and message should always be the primary focus. The visuals of the PowerPoint can enhance the presenters message, so our Introduction To Unplanned Change Management For Tackling Unexpected Events Ppt PowerPoint Presentation Diagram Lists PDF was created to help save time. Instead of worrying about the design, the presenter can concentrate on the message while our designers work on creating the ideal templates for whatever situation is needed. Slidegeeks has experts for everything from amazing designs to valuable content, we have put everything into Introduction To Unplanned Change Management For Tackling Unexpected Events Ppt PowerPoint Presentation Diagram Lists PDF

Key Findings Of Product Launch Marketing Campaign Ppt PowerPoint Presentation Diagram Lists PDF
The following slide outlines result of product launch campaign on business performance. The slide covers information about new users acquired, user retention, product trials, web traffic, and revenue. Formulating a presentation can take up a lot of effort and time, so the content and message should always be the primary focus. The visuals of the PowerPoint can enhance the presenters message, so our Key Findings Of Product Launch Marketing Campaign Ppt PowerPoint Presentation Diagram Lists PDF was created to help save time. Instead of worrying about the design, the presenter can concentrate on the message while our designers work on creating the ideal templates for whatever situation is needed. Slidegeeks has experts for everything from amazing designs to valuable content, we have put everything into Key Findings Of Product Launch Marketing Campaign Ppt PowerPoint Presentation Diagram Lists PDF

Overview Of Claude Ai Large Language Model Ppt PowerPoint Presentation Diagram Lists PDF
This slide showcases brief overview of ChatGPT rival Claude.ai large language model LLM useful for chatbot and integrating in business. It provides details about application programming interface, conversational AI, etc. Formulating a presentation can take up a lot of effort and time, so the content and message should always be the primary focus. The visuals of the PowerPoint can enhance the presenters message, so our Overview Of Claude Ai Large Language Model Ppt PowerPoint Presentation Diagram Lists PDF was created to help save time. Instead of worrying about the design, the presenter can concentrate on the message while our designers work on creating the ideal templates for whatever situation is needed. Slidegeeks has experts for everything from amazing designs to valuable content, we have put everything into Overview Of Claude Ai Large Language Model Ppt PowerPoint Presentation Diagram Lists PDF
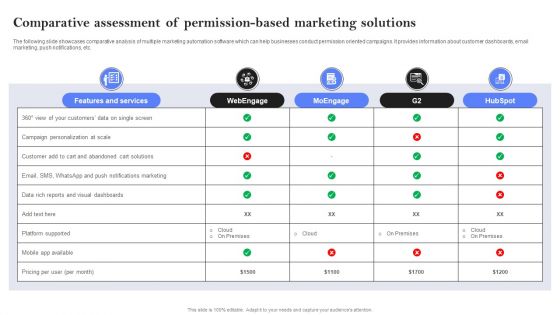
Comparative Assessment Of Permission Based Marketing Solutions Ppt PowerPoint Presentation Diagram Images PDF

Various Phases For Effective Software Maintenance Ppt PowerPoint Presentation Diagram Templates PDF
Following slide exhibits phases of software maintenance to assure system remains functional and updated. It includes steps such as problem identification, problem analysis, design, implementation, system test etc. Find highly impressive Various Phases For Effective Software Maintenance Ppt PowerPoint Presentation Diagram Templates PDF on Slidegeeks to deliver a meaningful presentation. You can save an ample amount of time using these presentation templates. No need to worry to prepare everything from scratch because Slidegeeks experts have already done a huge research and work for you. You need to download Various Phases For Effective Software Maintenance Ppt PowerPoint Presentation Diagram Templates PDF for your upcoming presentation. All the presentation templates are 100 percent editable and you can change the color and personalize the content accordingly. Download now.
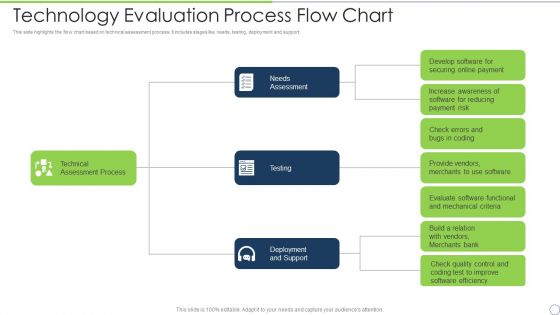
Technology Evaluation Process Flow Chart Ppt PowerPoint Presentation Diagram Templates PDF
This slide highlights the flow chart based on technical assessment process. It includes stages like needs, testing, deployment and support. Presenting technology evaluation process flow chart ppt powerpoint presentation diagram templates pdf to dispense important information. This template comprises three stages. It also presents valuable insights into the topics including technical assessment process, deployment and support, needs assessment, testing. This is a completely customizable PowerPoint theme that can be put to use immediately. So, download it and address the topic impactfully.

Timeline For Data Migration To Cloud Storage Ppt PowerPoint Presentation Diagram Graph Charts PDF
This slide depicts the timeline for migrating data to the cloud storage, including various phases such as assessment, planning, validation, migration, and verification and optimization. Do you have an important presentation coming up Are you looking for something that will make your presentation stand out from the rest Look no further than Timeline For Data Migration To Cloud Storage Ppt PowerPoint Presentation Diagram Graph Charts PDF. With our professional designs, you can trust that your presentation will pop and make delivering it a smooth process. And with Slidegeeks, you can trust that your presentation will be unique and memorable. So why wait Grab Timeline For Data Migration To Cloud Storage Ppt PowerPoint Presentation Diagram Graph Charts PDF today and make your presentation stand out from the rest.

Sponsorship Levels For Off Road Racing Funding Proposal Ppt PowerPoint Presentation Diagram Graph Charts PDF
This slide represents major sponsorship levels for the investors for off road racing funding proposal. It includes details for platinum and gold level along with investment level and additional benefits. Whether you have daily or monthly meetings, a brilliant presentation is necessary. Sponsorship Levels For Off Road Racing Funding Proposal Ppt PowerPoint Presentation Diagram Graph Charts PDF can be your best option for delivering a presentation. Represent everything in detail using Sponsorship Levels For Off Road Racing Funding Proposal Ppt PowerPoint Presentation Diagram Graph Charts PDF and make yourself stand out in meetings. The template is versatile and follows a structure that will cater to your requirements. All the templates prepared by Slidegeeks are easy to download and edit. Our research experts have taken care of the corporate themes as well. So, give it a try and see the results.
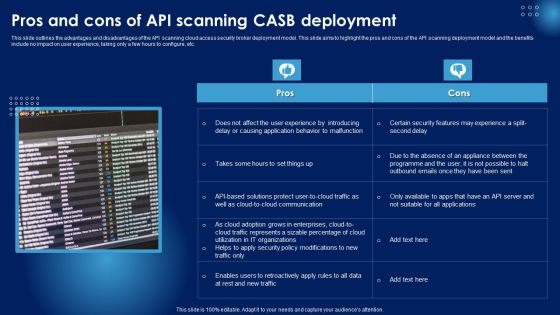
Pros And Cons Of API Scanning CASB Deployment Ppt PowerPoint Presentation Diagram Graph Charts PDF
This slide outlines the advantages and disadvantages of the API scanning cloud access security broker deployment model. This slide aims to highlight the pros and cons of the API scanning deployment model and the benefits include no impact on user experience, taking only a few hours to configure, etc. Whether you have daily or monthly meetings, a brilliant presentation is necessary. Pros And Cons Of API Scanning CASB Deployment Ppt PowerPoint Presentation Diagram Graph Charts PDF can be your best option for delivering a presentation. Represent everything in detail using Pros And Cons Of API Scanning CASB Deployment Ppt PowerPoint Presentation Diagram Graph Charts PDF and make yourself stand out in meetings. The template is versatile and follows a structure that will cater to your requirements. All the templates prepared by Slidegeeks are easy to download and edit. Our research experts have taken care of the corporate themes as well. So, give it a try and see the results.

Problems Related To Current Product Positioning Ppt PowerPoint Presentation Diagram Graph Charts PDF
This slide highlights the problems related to current product positioning which showcases in graphical format depicting downgrading product sales and changing consumer trends. Do you have an important presentation coming up Are you looking for something that will make your presentation stand out from the rest Look no further than Problems Related To Current Product Positioning Ppt PowerPoint Presentation Diagram Graph Charts PDF. With our professional designs, you can trust that your presentation will pop and make delivering it a smooth process. And with Slidegeeks, you can trust that your presentation will be unique and memorable. So why wait Grab Problems Related To Current Product Positioning Ppt PowerPoint Presentation Diagram Graph Charts PDF today and make your presentation stand out from the rest
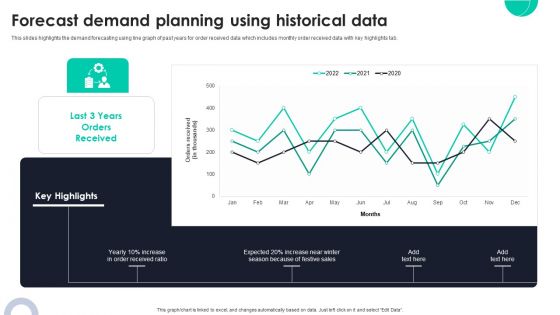
Forecast Demand Planning Using Historical Data Ppt PowerPoint Presentation Diagram Graph Charts PDF
This slides highlights the demand forecasting using line graph of past years for order received data which includes monthly order received data with key highlights tab. Crafting an eye catching presentation has never been more straightforward. Let your presentation shine with this tasteful yet straightforward Forecast Demand Planning Using Historical Data Ppt PowerPoint Presentation Diagram Graph Charts PDF template. It offers a minimalistic and classy look that is great for making a statement. The colors have been employed intelligently to add a bit of playfulness while still remaining professional. Construct the ideal Forecast Demand Planning Using Historical Data Ppt PowerPoint Presentation Diagram Graph Charts PDF that effortlessly grabs the attention of your audience. Begin now and be certain to wow your customers.
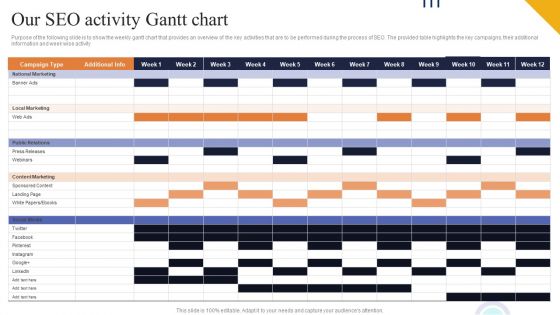
Our SEO Activity Gantt Chart Ppt PowerPoint Presentation Diagram Templates PDF
Purpose of the following slide is to show the weekly gantt chart that provides an overview of the key activities that are to be performed during the process of SEO. The provided table highlights the key campaigns, their additional information and week wise activity This Our SEO Activity Gantt Chart Ppt PowerPoint Presentation Diagram Templates PDF is perfect for any presentation, be it in front of clients or colleagues. It is a versatile and stylish solution for organizing your meetings. The Our SEO Activity Gantt Chart Ppt PowerPoint Presentation Diagram Templates PDF features a modern design for your presentation meetings. The adjustable and customizable slides provide unlimited possibilities for acing up your presentation. Slidegeeks has done all the homework before launching the product for you. So, do not wait, grab the presentation templates today

Application Of End User Computing In Manufacturing Ppt PowerPoint Presentation Diagram Graph Charts PDF
This slide explains the use cases of end user computing in manufacturing and how it will improve the feedback processes, Kanban process and analysis of the work center. Do you have to make sure that everyone on your team knows about any specific topic I yes, then you should give Application Of End User Computing In Manufacturing Ppt PowerPoint Presentation Diagram Graph Charts PDF a try. Our experts have put a lot of knowledge and effort into creating this impeccable Application Of End User Computing In Manufacturing Ppt PowerPoint Presentation Diagram Graph Charts PDF. You can use this template for your upcoming presentations, as the slides are perfect to represent even the tiniest detail. You can download these templates from the Slidegeeks website and these are easy to edit. So grab these today.
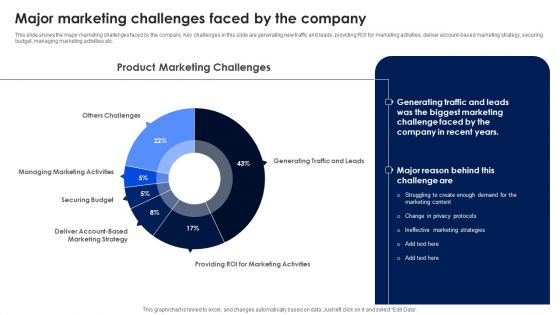
Major Marketing Challenges Faced By The Company Ppt PowerPoint Presentation Diagram Graph Charts PDF
This slide shows the major marketing challenges faced by the company. Key challenges in this slide are generating new traffic and leads, providing ROI for marketing activities, deliver account based marketing strategy, securing budget, managing marketing activities etc. Find highly impressive Major Marketing Challenges Faced By The Company Ppt PowerPoint Presentation Diagram Graph Charts PDF on Slidegeeks to deliver a meaningful presentation. You can save an ample amount of time using these presentation templates. No need to worry to prepare everything from scratch because Slidegeeks experts have already done a huge research and work for you. You need to download Major Marketing Challenges Faced By The Company Ppt PowerPoint Presentation Diagram Graph Charts PDF for your upcoming presentation. All the presentation templates are 100 percent editable and you can change the color and personalize the content accordingly. Download now.

Process Flow Of Service Desk Management Ppt PowerPoint Presentation Diagram Graph Charts PDF
The following slide illustrates process flow of service desk management. It provides information about resolution time, in-call waiting time, agent call connection, issue escalation, client notification, operations management, etc. Explore a selection of the finest Process Flow Of Service Desk Management Ppt PowerPoint Presentation Diagram Graph Charts PDF here. With a plethora of professionally designed and pre made slide templates, you can quickly and easily find the right one for your upcoming presentation. You can use our Process Flow Of Service Desk Management Ppt PowerPoint Presentation Diagram Graph Charts PDF to effectively convey your message to a wider audience. Slidegeeks has done a lot of research before preparing these presentation templates. The content can be personalized and the slides are highly editable. Grab templates today from Slidegeeks.
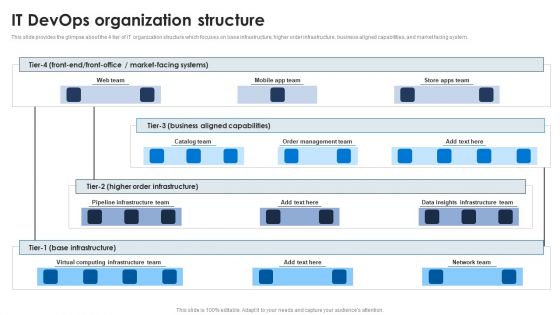
It Devops Organization Structure Ppt PowerPoint Presentation Diagram Graph Charts PDF
This slide provides the glimpse about the 4 tier of IT organization structure which focuses on base infrastructure, higher order infrastructure, business aligned capabilities, and market facing system. Do you have an important presentation coming up Are you looking for something that will make your presentation stand out from the rest Look no further than It Devops Organization Structure Ppt PowerPoint Presentation Diagram Graph Charts PDF. With our professional designs, you can trust that your presentation will pop and make delivering it a smooth process. And with Slidegeeks, you can trust that your presentation will be unique and memorable. So why wait Grab It Devops Organization Structure Ppt PowerPoint Presentation Diagram Graph Charts PDF today and make your presentation stand out from the rest.
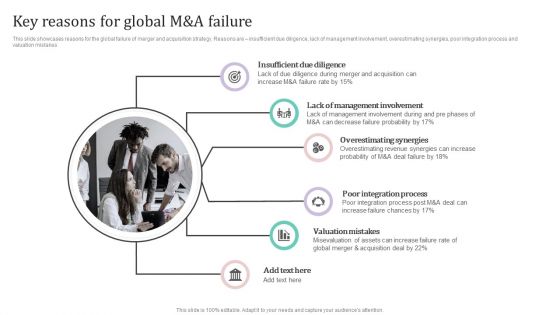
Key Reasons For Global M And A Failure Ppt PowerPoint Presentation Diagram Graph Charts PDF
This slide showcases reasons for the global failure of merger and acquisition strategy. Reasons are insufficient due diligence, lack of management involvement, overestimating synergies, poor integration process and valuation mistakes.Find highly impressive Key Reasons For Global M And A Failure Ppt PowerPoint Presentation Diagram Graph Charts PDF on Slidegeeks to deliver a meaningful presentation. You can save an ample amount of time using these presentation templates. No need to worry to prepare everything from scratch because Slidegeeks experts have already done a huge research and work for you. You need to download Key Reasons For Global M And A Failure Ppt PowerPoint Presentation Diagram Graph Charts PDF for your upcoming presentation. All the presentation templates are 100precent editable and you can change the color and personalize the content accordingly. Download now.

Generic Cloud Storage Architecture Ppt PowerPoint Presentation Diagram Graph Charts PDF
This slide depicts the generic cloud storage architecture and its various layers such as front end, storge logic, and back-end storage and their functions. Crafting an eye catching presentation has never been more straightforward. Let your presentation shine with this tasteful yet straightforward Generic Cloud Storage Architecture Ppt PowerPoint Presentation Diagram Graph Charts PDF template. It offers a minimalistic and classy look that is great for making a statement. The colors have been employed intelligently to add a bit of playfulness while still remaining professional. Construct the ideal Generic Cloud Storage Architecture Ppt PowerPoint Presentation Diagram Graph Charts PDF that effortlessly grabs the attention of your audience Begin now and be certain to wow your customers.
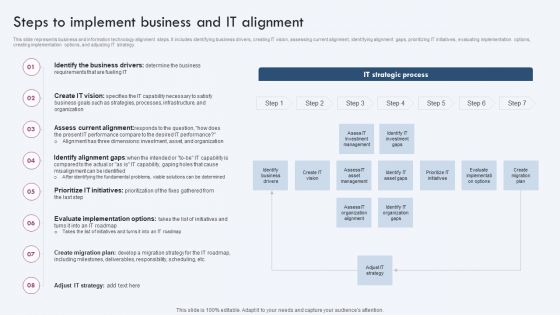
Steps To Implement Business And IT Alignment Ppt PowerPoint Presentation Diagram Graph Charts PDF
This slide represents business and information technology alignment steps. It includes identifying business drivers, creating IT vision, assessing current alignment, identifying alignment gaps, prioritizing IT initiatives, evaluating implementation options, creating implementation options, and adjusting IT strategy. Crafting an eye catching presentation has never been more straightforward. Let your presentation shine with this tasteful yet straightforward Steps To Implement Business And IT Alignment Ppt PowerPoint Presentation Diagram Graph Charts PDF template. It offers a minimalistic and classy look that is great for making a statement. The colors have been employed intelligently to add a bit of playfulness while still remaining professional. Construct the ideal Steps To Implement Business And IT Alignment Ppt PowerPoint Presentation Diagram Graph Charts PDF that effortlessly grabs the attention of your audience Begin now and be certain to wow your customers.

Scrum Company Chart For Enterprise Agility Ppt PowerPoint Presentation Diagram Lists PDF
This slide provides the glimpse about the scrum enterprise structure which focuses on portfolio vision, architectural runway, portfolio, program and project details. Do you have to make sure that everyone on your team knows about any specific topic I yes, then you should give Scrum Company Chart For Enterprise Agility Ppt PowerPoint Presentation Diagram Lists PDF a try. Our experts have put a lot of knowledge and effort into creating this impeccable Scrum Company Chart For Enterprise Agility Ppt PowerPoint Presentation Diagram Lists PDF. You can use this template for your upcoming presentations, as the slides are perfect to represent even the tiniest detail. You can download these templates from the Slidegeeks website and these are easy to edit. So grab these today.
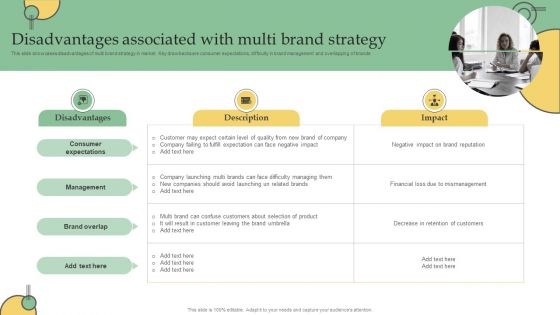
Disadvantages Associated With Multi Brand Strategy Ppt PowerPoint Presentation Diagram Graph Charts PDF
This slide showcases disadvantages of multi brand strategy in market. Key drawbacks are consumer expectations, difficulty in brand management and overlapping of brands. Explore a selection of the finest Disadvantages Associated With Multi Brand Strategy Ppt PowerPoint Presentation Diagram Graph Charts PDF here. With a plethora of professionally designed and pre made slide templates, you can quickly and easily find the right one for your upcoming presentation. You can use our Disadvantages Associated With Multi Brand Strategy Ppt PowerPoint Presentation Diagram Graph Charts PDF to effectively convey your message to a wider audience. Slidegeeks has done a lot of research before preparing these presentation templates. The content can be personalized and the slides are highly editable. Grab templates today from Slidegeeks.

Collecting Consumer Qualitative Data For Personalized Marketing Ppt PowerPoint Presentation Diagram Graph Charts PDF
This slide showcases consumer qualitative data that can be collected to formulate personalized marketing campaign. It also shows ways to collect data from different sources Do you have an important presentation coming up Are you looking for something that will make your presentation stand out from the rest Look no further than Collecting Consumer Qualitative Data For Personalized Marketing Ppt PowerPoint Presentation Diagram Graph Charts PDF. With our professional designs, you can trust that your presentation will pop and make delivering it a smooth process. And with Slidegeeks, you can trust that your presentation will be unique and memorable. So why wait Grab Collecting Consumer Qualitative Data For Personalized Marketing Ppt PowerPoint Presentation Diagram Graph Charts PDF today and make your presentation stand out from the rest.

Major Reasons For Product Repositioning Ppt PowerPoint Presentation Diagram Graph Charts PDF
This slide highlights the reasons for product repositioning which includes declining sales, increased competition, wrong positioning, future plans, evolved products and change strategic direction. Do you have to make sure that everyone on your team knows about any specific topic I yes, then you should give Major Reasons For Product Repositioning Ppt PowerPoint Presentation Diagram Graph Charts PDF a try. Our experts have put a lot of knowledge and effort into creating this impeccable Major Reasons For Product Repositioning Ppt PowerPoint Presentation Diagram Graph Charts PDF. You can use this template for your upcoming presentations, as the slides are perfect to represent even the tiniest detail. You can download these templates from the Slidegeeks website and these are easy to edit. So grab these today

Developing Our Social Media Content Calendar Ppt PowerPoint Presentation Diagram Graph Charts PDF
The following slide displays the detailed content calendar of the organization, the provided slide displays the key social media websites on which the organization is present. Get a simple yet stunning designed Developing Our Social Media Content Calendar Ppt PowerPoint Presentation Diagram Graph Charts PDF. It is the best one to establish the tone in your meetings. It is an excellent way to make your presentations highly effective. So, download this PPT today from Slidegeeks and see the positive impacts. Our easy to edit Developing Our Social Media Content Calendar Ppt PowerPoint Presentation Diagram Graph Charts PDF can be your go to option for all upcoming conferences and meetings. So, what are you waiting for Grab this template today.
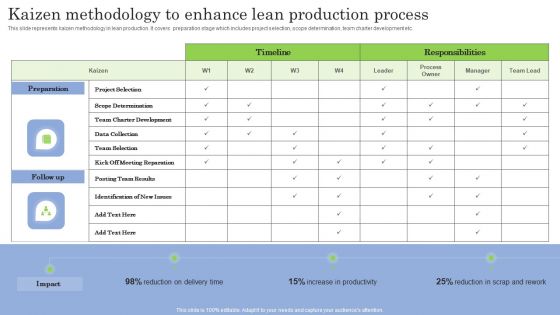
Kaizen Methodology To Enhance Lean Production Process Ppt PowerPoint Presentation Diagram Graph Charts PDF
This slide represents kaizen methodology in lean production. It covers preparation stage which includes project selection, scope determination, team charter development etc. Crafting an eye catching presentation has never been more straightforward. Let your presentation shine with this tasteful yet straightforward Kaizen Methodology To Enhance Lean Production Process Ppt PowerPoint Presentation Diagram Graph Charts PDF template. It offers a minimalistic and classy look that is great for making a statement. The colors have been employed intelligently to add a bit of playfulness while still remaining professional. Construct the ideal Kaizen Methodology To Enhance Lean Production Process Ppt PowerPoint Presentation Diagram Graph Charts PDF that effortlessly grabs the attention of your audience. Begin now and be certain to wow your customers.

Process To Formulate Performance Marketing Campaign Ppt PowerPoint Presentation Diagram Graph Charts PDF
This slide showcases process that can help organization to formulate performance marketing campaign and run online targeted ads. Its key steps are - establish campaign objectives, determine marketing channels, run marketing campaigns and optimize campaigns Explore a selection of the finest Process To Formulate Performance Marketing Campaign Ppt PowerPoint Presentation Diagram Graph Charts PDF here. With a plethora of professionally designed and pre made slide templates, you can quickly and easily find the right one for your upcoming presentation. You can use our Process To Formulate Performance Marketing Campaign Ppt PowerPoint Presentation Diagram Graph Charts PDF to effectively convey your message to a wider audience. Slidegeeks has done a lot of research before preparing these presentation templates. The content can be personalized and the slides are highly editable. Grab templates today from Slidegeeks.
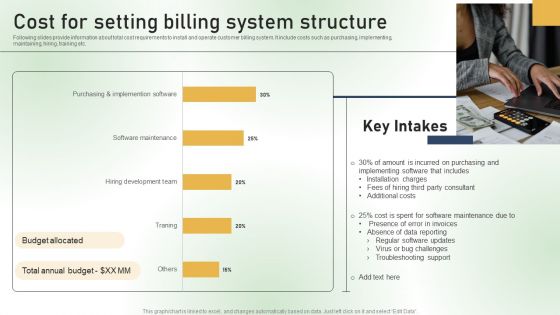
Cost For Setting Billing System Structure Ppt PowerPoint Presentation Diagram Graph Charts PDF
Following slides provide information about total cost requirements to install and operate customer billing system. It include costs such as purchasing, implementing, maintaining, hiring, training etc. Crafting an eye catching presentation has never been more straightforward. Let your presentation shine with this tasteful yet straightforward Cost For Setting Billing System Structure Ppt PowerPoint Presentation Diagram Graph Charts PDF template. It offers a minimalistic and classy look that is great for making a statement. The colors have been employed intelligently to add a bit of playfulness while still remaining professional. Construct the ideal Cost For Setting Billing System Structure Ppt PowerPoint Presentation Diagram Graph Charts PDF that effortlessly grabs the attention of your audience. Begin now and be certain to wow your customers.
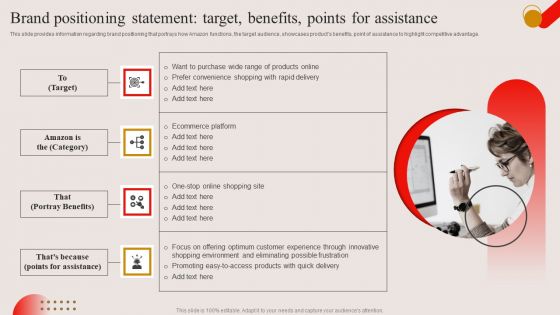
Brand Positioning Statement Target Benefits Points For Assistance Ppt PowerPoint Presentation Diagram Graph Charts PDF
This slide provides information regarding brand positioning that portrays how Amazon functions, the target audience, showcases products benefits, point of assistance to highlight competitive advantage. Get a simple yet stunning designed Brand Positioning Statement Target Benefits Points For Assistance Ppt PowerPoint Presentation Diagram Graph Charts PDF. It is the best one to establish the tone in your meetings. It is an excellent way to make your presentations highly effective. So, download this PPT today from Slidegeeks and see the positive impacts. Our easy to edit Brand Positioning Statement Target Benefits Points For Assistance Ppt PowerPoint Presentation Diagram Graph Charts PDF can be your go to option for all upcoming conferences and meetings. So, what are you waiting for Grab this template today.

Key Texting And SMS Marketing Statistics Ppt PowerPoint Presentation Diagram Graph Charts PDF
This slide represents the statistical data to help marketers analyze the benefits and importance of SMS marketing for business growth and development. It includes key SMS marketing statistics such as click through rates, opt-ins etc. Get a simple yet stunning designed Key Texting And SMS Marketing Statistics Ppt PowerPoint Presentation Diagram Graph Charts PDF. It is the best one to establish the tone in your meetings. It is an excellent way to make your presentations highly effective. So, download this PPT today from Slidegeeks and see the positive impacts. Our easy to edit Key Texting And SMS Marketing Statistics Ppt PowerPoint Presentation Diagram Graph Charts PDF can be your go to option for all upcoming conferences and meetings. So, what are you waiting for Grab this template today.

Types Of Franchise Arrangements For Global Expansion Cont Ppt PowerPoint Presentation Diagram PDF
This slide showcases types of master franchise arrangement that can help organization to expand globally. It can help organization to develop new revenue potential and gain access to foreign market.Whether you have daily or monthly meetings, a brilliant presentation is necessary. Types Of Franchise Arrangements For Global Expansion Cont Ppt PowerPoint Presentation Diagram PDF can be your best option for delivering a presentation. Represent everything in detail using Types Of Franchise Arrangements For Global Expansion Cont Ppt PowerPoint Presentation Diagram PDF and make yourself stand out in meetings. The template is versatile and follows a structure that will cater to your requirements. All the templates prepared by Slidegeeks are easy to download and edit. Our research experts have taken care of the corporate themes as well. So, give it a try and see the results.
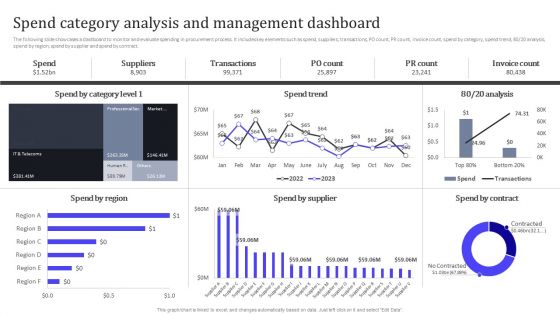
Spend Category Analysis And Management Dashboard Ppt PowerPoint Presentation Diagram PDF
The following slide showcases a dashboard to monitor and evaluate spending in procurement process. It includes key elements such as spend, suppliers, transactions, PO count, PR count, invoice count, spend by category, spend trend, 80 or 20 analysis, spend by region, spend by supplier and spend by contract. Do you have to make sure that everyone on your team knows about any specific topic I yes, then you should give Spend Category Analysis And Management Dashboard Ppt PowerPoint Presentation Diagram PDF a try. Our experts have put a lot of knowledge and effort into creating this impeccable Spend Category Analysis And Management Dashboard Ppt PowerPoint Presentation Diagram PDF. You can use this template for your upcoming presentations, as the slides are perfect to represent even the tiniest detail. You can download these templates from the Slidegeeks website and these are easy to edit. So grab these today.

Evaluating Current Marketing Performance Of Organization Ppt PowerPoint Presentation Diagram Templates PDF
This slide showcases overview of current marketing performance that can help organization to determine issues in current promotional campaigns. Its key elements are website traffic, marketing budget and product sales Explore a selection of the finest Evaluating Current Marketing Performance Of Organization Ppt PowerPoint Presentation Diagram Templates PDF here. With a plethora of professionally designed and pre made slide templates, you can quickly and easily find the right one for your upcoming presentation. You can use our Evaluating Current Marketing Performance Of Organization Ppt PowerPoint Presentation Diagram Templates PDF to effectively convey your message to a wider audience. Slidegeeks has done a lot of research before preparing these presentation templates. The content can be personalized and the slides are highly editable. Grab templates today from Slidegeeks.
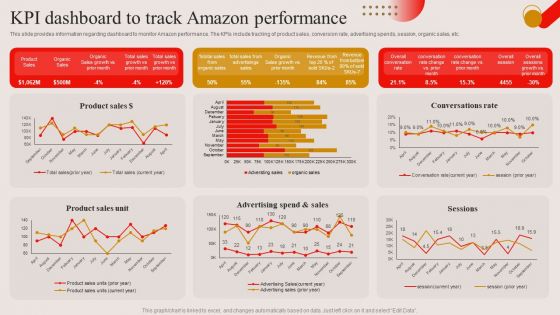
KPI Dashboard To Track Amazon Performance Ppt PowerPoint Presentation Diagram Lists PDF
This slide provides information regarding dashboard to monitor Amazon performance. The KPIs include tracking of product sales, conversion rate, advertising spends, session, organic sales, etc. Explore a selection of the finest KPI Dashboard To Track Amazon Performance Ppt PowerPoint Presentation Diagram Lists PDF here. With a plethora of professionally designed and pre made slide templates, you can quickly and easily find the right one for your upcoming presentation. You can use our KPI Dashboard To Track Amazon Performance Ppt PowerPoint Presentation Diagram Lists PDF to effectively convey your message to a wider audience. Slidegeeks has done a lot of research before preparing these presentation templates. The content can be personalized and the slides are highly editable. Grab templates today from Slidegeeks.
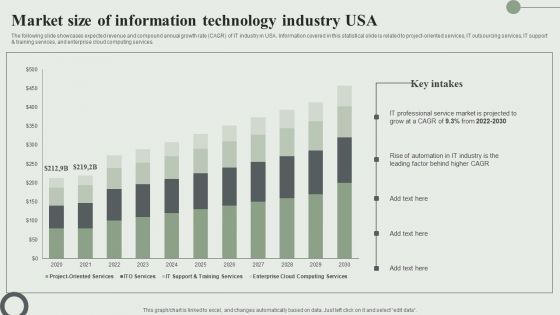
Market Size Of Information Technology Industry USA Ppt PowerPoint Presentation Diagram Lists PDF
The following slide showcases expected revenue and compound annual growth rate CAGR of IT industry in USA. Information covered in this statistical slide is related to project oriented services, IT outsourcing services, IT support and training services, and enterprise cloud computing services. Get a simple yet stunning designed Market Size Of Information Technology Industry USA Ppt PowerPoint Presentation Diagram Lists PDF. It is the best one to establish the tone in your meetings. It is an excellent way to make your presentations highly effective. So, download this PPT today from Slidegeeks and see the positive impacts. Our easy to edit Market Size Of Information Technology Industry USA Ppt PowerPoint Presentation Diagram Lists PDF can be your go to option for all upcoming conferences and meetings. So, what are you waiting for Grab this template today.
Enterprise SMS Marketing Subscribers Tracking Dashboard Ppt PowerPoint Presentation Diagram PDF
This slide represents the key metrics dashboard to monito and track the SMS marketing subscribers of the enterprise. It includes details related to KPIs such as total subscribers, new subscribers, total unsubscribes etc. Do you have an important presentation coming up Are you looking for something that will make your presentation stand out from the rest Look no further than Enterprise SMS Marketing Subscribers Tracking Dashboard Ppt PowerPoint Presentation Diagram PDF. With our professional designs, you can trust that your presentation will pop and make delivering it a smooth process. And with Slidegeeks, you can trust that your presentation will be unique and memorable. So why wait Grab Enterprise SMS Marketing Subscribers Tracking Dashboard Ppt PowerPoint Presentation Diagram PDF today and make your presentation stand out from the rest.

SMS Marketing Campaign Management KPI Dashboard Ppt PowerPoint Presentation Diagram Templates PDF
This slide represents the key performance metrics dashboard to track and monitor the performance of enterprises SMS marketing campaign. It includes details related to KPIs such as top live automations, top sent campaigns etc. Get a simple yet stunning designed SMS Marketing Campaign Management KPI Dashboard Ppt PowerPoint Presentation Diagram Templates PDF. It is the best one to establish the tone in your meetings. It is an excellent way to make your presentations highly effective. So, download this PPT today from Slidegeeks and see the positive impacts. Our easy to edit SMS Marketing Campaign Management KPI Dashboard Ppt PowerPoint Presentation Diagram Templates PDF can be your go to option for all upcoming conferences and meetings. So, what are you waiting for Grab this template today.

Hierarchy Chart Of Various Employees Reporting To One Manager Ppt PowerPoint Presentation Diagram Templates PDF
Presenting hierarchy chart of various employees reporting to one manager ppt powerpoint presentation diagram templates pdf to dispense important information. This template comprises four stages. It also presents valuable insights into the topics including hierarchy chart of various employees reporting to one manager. This is a completely customizable PowerPoint theme that can be put to use immediately. So, download it and address the topic impactfully.

Cost Reduction Activities In IT Business Ppt PowerPoint Presentation Diagram Graph Charts PDF
Presenting this set of slides with name cost reduction activities in it business ppt powerpoint presentation diagram graph charts pdf. This is a five stage process. The stages in this process are virtualize servers by using containers, use cheaper hardware, use the cloud decommission software, use open source software. This is a completely editable PowerPoint presentation and is available for immediate download. Download now and impress your audience.
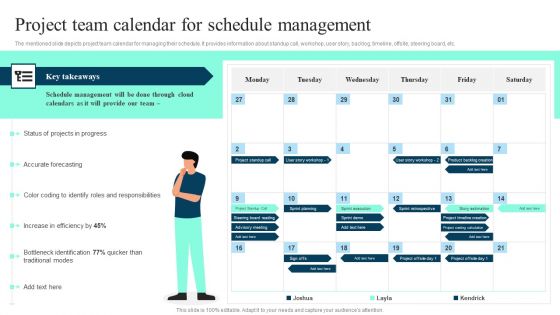
Project Team Calendar For Schedule Management Ppt PowerPoint Presentation Diagram Lists PDF
The mentioned slide depicts project team calendar for managing their schedule. It provides information about standup call, workshop, user story, backlog, timeline, offsite, steering board, etc. Whether you have daily or monthly meetings, a brilliant presentation is necessary. Project Team Calendar For Schedule Management Ppt PowerPoint Presentation Diagram Lists PDF can be your best option for delivering a presentation. Represent everything in detail using Project Team Calendar For Schedule Management Ppt PowerPoint Presentation Diagram Lists PDF and make yourself stand out in meetings. The template is versatile and follows a structure that will cater to your requirements. All the templates prepared by Slidegeeks are easy to download and edit. Our research experts have taken care of the corporate themes as well. So, give it a try and see the results.
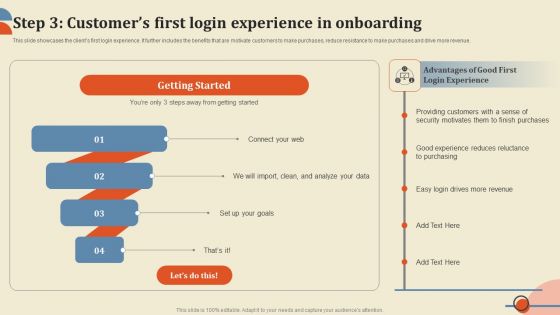
Step 3 Customers First Login Experience In Onboarding Ppt PowerPoint Presentation Diagram Templates PDF
This slide showcases the clients first login experience. It further includes the benefits that are motivate customers to make purchases, reduce resistance to make purchases and drive more revenue. Whether you have daily or monthly meetings, a brilliant presentation is necessary. Step 3 Customers First Login Experience In Onboarding Ppt PowerPoint Presentation Diagram Templates PDF can be your best option for delivering a presentation. Represent everything in detail using Step 3 Customers First Login Experience In Onboarding Ppt PowerPoint Presentation Diagram Templates PDF and make yourself stand out in meetings. The template is versatile and follows a structure that will cater to your requirements. All the templates prepared by Slidegeeks are easy to download and edit. Our research experts have taken care of the corporate themes as well. So, give it a try and see the results.

 Home
Home