Power Bi
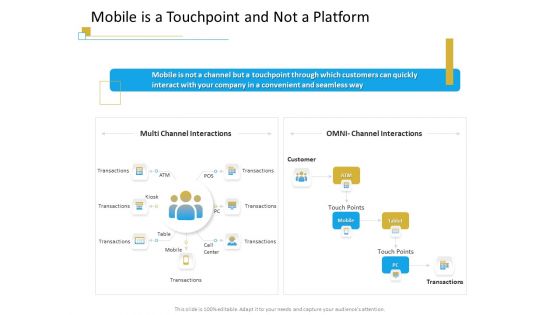
Successful Mobile Strategies For Business Mobile Is A Touchpoint And Not A Platform Guidelines PDF
Presenting successful mobile strategies for business mobile is a touchpoint and not a platform guidelines pdf to provide visual cues and insights. Share and navigate important information on two stages that need your due attention. This template can be used to pitch topics like multi channel interactions, omni channel interactions. In addtion, this PPT design contains high resolution images, graphics, etc, that are easily editable and available for immediate download.

Ad Agency Fundraising Company Introduction With Mission And Vision Ppt PowerPoint Presentation File Aids PDF
This slide shows the company introduction which includes ABC interactive details, mission, vision, etc. Presenting ad agency fundraising company introduction with mission and vision ppt powerpoint presentation file aids pdf to provide visual cues and insights. Share and navigate important information on three stages that need your due attention. This template can be used to pitch topics like abc interactive, vision, mission. In addtion, this PPT design contains high resolution images, graphics, etc, that are easily editable and available for immediate download.
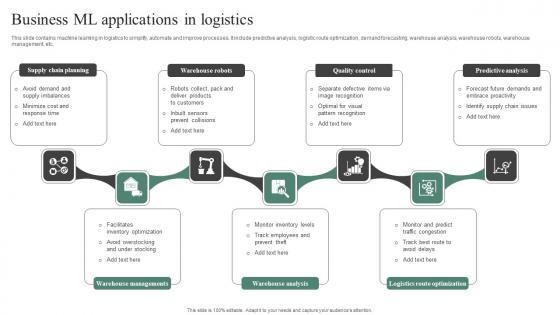
Business ML Applications In Logistics Portrait Pdf
This slide contains machine learning in logistics to simplify, automate and improve processes. It include predictive analysis, logistic route optimization, demand forecasting, warehouse analysis, warehouse robots, warehouse management, etc. Showcasing this set of slides titled Business ML Applications In Logistics Portrait Pdf. The topics addressed in these templates are Supply Chain Planning, Warehouse Robots, Warehouse Analysis. All the content presented in this PPT design is completely editable. Download it and make adjustments in color, background, font etc. as per your unique business setting.

Non Traditional Payment Method Online Payment Processing Services Comprehensive Guide For Developing Template PDF
This slide represents how omni channel is changing b2b market along with businesses. It covers media channels, marketing campaign, data analytics, social media etc.This Non Traditional Payment Method Online Payment Processing Services Comprehensive Guide For Developing Template PDF from Slidegeeks makes it easy to present information on your topic with precision. It provides customization options, so you can make changes to the colors, design, graphics, or any other component to create a unique layout. It is also available for immediate download, so you can begin using it right away. Slidegeeks has done good research to ensure that you have everything you need to make your presentation stand out. Make a name out there for a brilliant performance.
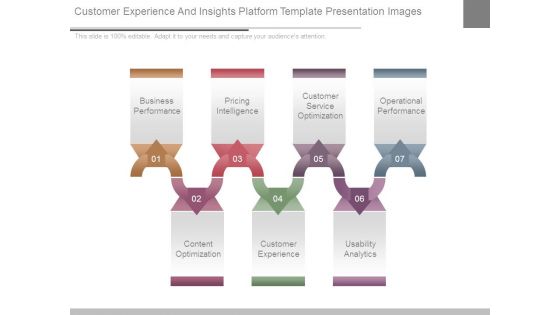
Customer Experience And Insights Platform Template Presentation Images
This is a customer experience and insights platform template presentation images. This is a seven stage process. The stages in this process are business performance, pricing intelligence, customer service optimization, operational performance, usability analytics, customer experience, content optimization.
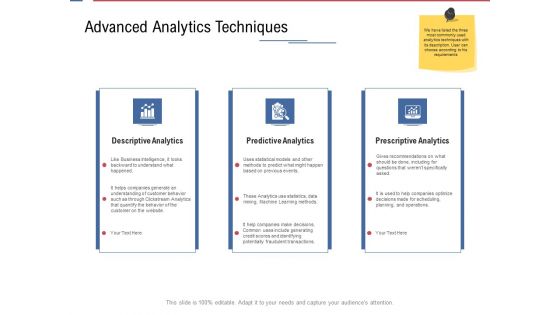
Data Assimilation Advanced Analytics Techniques Ppt Ideas Good PDF
This is a data assimilation advanced analytics techniques ppt ideas good pdf template with various stages. Focus and dispense information on three stages using this creative set, that comes with editable features. It contains large content boxes to add your information on topics like descriptive analytics, predictive analytics, prescriptive analytics. You can also showcase facts, figures, and other relevant content using this PPT layout. Grab it now.
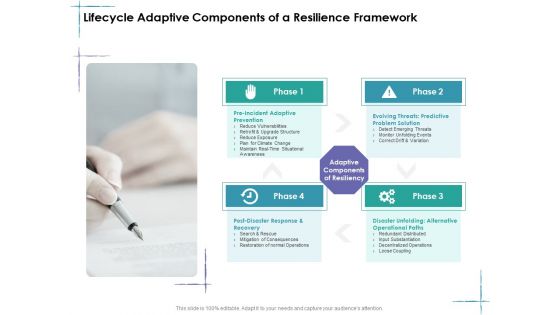
Facility Management Lifecycle Adaptive Components Of A Resilience Framework Ppt Ideas Show PDF
This is a facility management lifecycle adaptive components of a resilience framework ppt ideas show pdf template with various stages. Focus and dispense information on four stages using this creative set, that comes with editable features. It contains large content boxes to add your information on topics like pre incident adaptive prevention, evolving threats predictive problem solution. post-disaster response and recovery, disaster unfolding alternative operational paths. You can also showcase facts, figures, and other relevant content using this PPT layout. Grab it now.
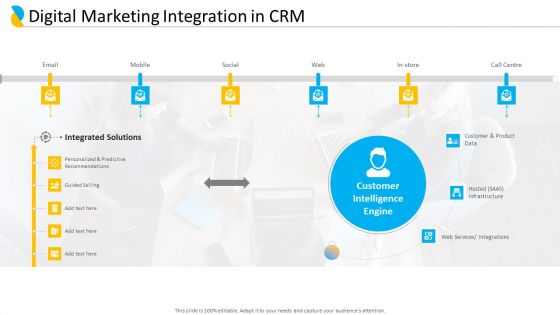
Customer Relationship Management Digital Marketing Integration In CRM Graphics PDF
Presenting customer relationship management digital marketing integration in CRM graphics pdf to provide visual cues and insights. Share and navigate important information on one stage that need your due attention. This template can be used to pitch topics like integrated solutions, customer intelligence engine, customer product data, personalized predictive recommendations, social. In addtion, this PPT design contains high resolution images, graphics, etc, that are easily editable and available for immediate download.
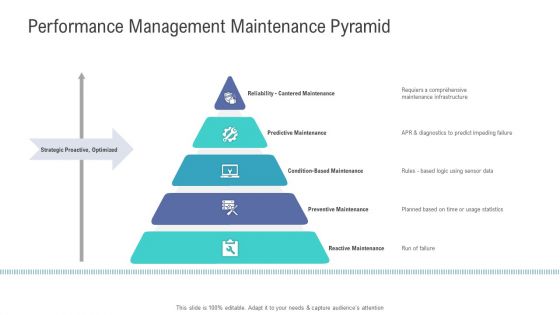
Financial Functional Assessment Performance Management Maintenance Pyramid Brochure PDF
Presenting financial functional assessment performance management maintenance pyramid brochure pdf to provide visual cues and insights. Share and navigate important information on five stages that need your due attention. This template can be used to pitch topics like predictive maintenance, preventive maintenance, reactive maintenance, condition based maintenance, reliability cantered maintenance. In addition, this PPT design contains high-resolution images, graphics, etc, that are easily editable and available for immediate download.

Construction Management Services Performance Management Maintenance Pyramid Professional PDF
This is a construction management services performance management maintenance pyramid professional pdf template with various stages. Focus and dispense information on five stages using this creative set, that comes with editable features. It contains large content boxes to add your information on topics like reactive maintenance, preventive maintenance, condition based maintenance, predictive maintenance, cantered maintenance. You can also showcase facts, figures, and other relevant content using this PPT layout. Grab it now.

Performance Management Maintenance Pyramid Designs PDF
Presenting performance management maintenance pyramid designs pdf to provide visual cues and insights. Share and navigate important information on six stages that need your due attention. This template can be used to pitch topics like condition based maintenance, predictive maintenance, reactive, maintenance, reliability centered maintenance. In addtion, this PPT design contains high resolution images, graphics, etc, that are easily editable and available for immediate download.

AI Application Use In Supply Chain Management Ideas PDF
This slide signifies the AI softwares used to improve supply chain management. It covers information about location management, route optimization, environment monitoring and iot predictive analytics Presenting AI Application Use In Supply Chain Management Ideas PDF to dispense important information. This template comprises four stages. It also presents valuable insights into the topics including Environment Monitoring, Route Optimization, Location Management. This is a completely customizable PowerPoint theme that can be put to use immediately. So, download it and address the topic impactfully.

Online Promotion Playbook Use Paid Search Channel For Driving Infographics PDF
This template depicts that Paid search displays relevant advertising in front of potential customers. Company ads are shown as a solution to their search engine query, boosting the possibility of interaction and conversion. This is a online promotion playbook use paid search channel for driving infographics pdf template with various stages. Focus and dispense information on four stages using this creative set, that comes with editable features. It contains large content boxes to add your information on topics like location, information. You can also showcase facts, figures, and other relevant content using this PPT layout. Grab it now.
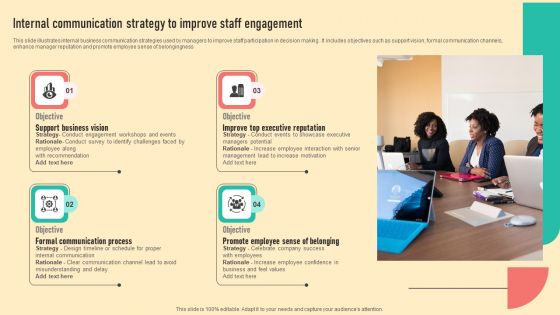
Internal Communication Strategy To Improve Staff Engagement Inspiration PDF
This slide illustrates internal business communication strategies used by managers to improve staff participation in decision making . It includes objectives such as support vision, formal communication channels, enhance manager reputation and promote employee sense of belongingness. Persuade your audience using this Internal Communication Strategy To Improve Staff Engagement Inspiration PDF. This PPT design covers four stages, thus making it a great tool to use. It also caters to a variety of topics including Managers Potential, Increase Employee Interaction, Management Lead. Download this PPT design now to present a convincing pitch that not only emphasizes the topic but also showcases your presentation skills.
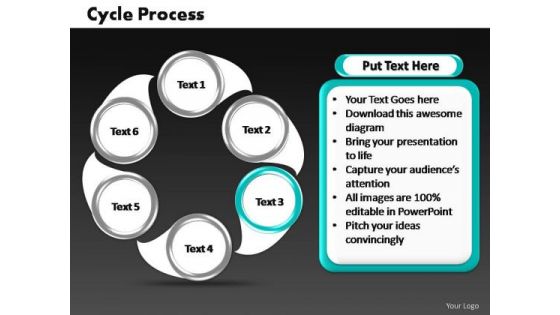
PowerPoint Slides Teamwork Cycle Process Ppt Slide Designs
PowerPoint Slides Teamwork Cycle Process PPT Slide Designs-In a cycle diagram, you can explain the main events in the cycle, how they interact, and how the cycle repeats. These Diagrams can be used to interact visually and logically with audiences. Use this graphic to represent a continuing sequence of stages, tasks, or events in a circular flow and emphasize the connection between all components.-PowerPoint Slides Teamwork Cycle Process PPT Slide Designs

PowerPoint Templates Leadership Cycle Process Ppt Themes
PowerPoint Templates Leadership Cycle Process PPT Themes-In a cycle diagram, you can explain the main events in the cycle, how they interact, and how the cycle repeats. These Diagrams can be used to interact visually and logically with audiences. Use this graphic to represent a continuing sequence of stages, tasks, or events in a circular flow and emphasize the connection between all components.-PowerPoint Templates Leadership Cycle Process PPT Themes
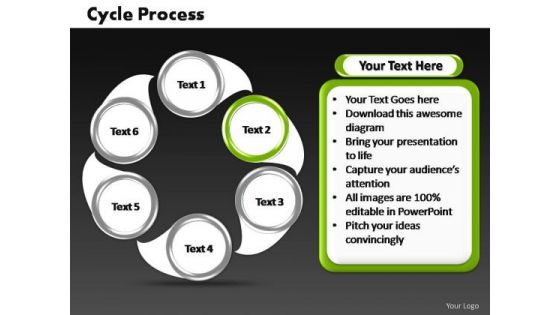
PowerPoint Process Diagram Cycle Process Ppt Theme
PowerPoint Process Diagram Cycle Process PPT Theme-In a cycle diagram, you can explain the main events in the cycle, how they interact, and how the cycle repeats. These Diagrams can be used to interact visually and logically with audiences. Use this graphic to represent a continuing sequence of stages, tasks, or events in a circular flow and emphasize the connection between all components.-PowerPoint Process Diagram Cycle Process PPT Theme

PowerPoint Designs Leadership Cycle Process Ppt Slides
PowerPoint Designs Leadership Cycle Process PPT Slides-In a cycle diagram, you can explain the main events in the cycle, how they interact, and how the cycle repeats. These Diagrams can be used to interact visually and logically with audiences. Use this graphic to represent a continuing sequence of stages, tasks, or events in a circular flow and emphasize the connection between all components.-PowerPoint Designs Leadership Cycle Process PPT Slides

PowerPoint Layouts Sales Cycle Process Ppt Slide Designs
PowerPoint Layouts Sales Cycle Process PPT Slide Designs-In a cycle diagram, you can explain the main events in the cycle, how they interact, and how the cycle repeats. These Diagrams can be used to interact visually and logically with audiences. Use this graphic to represent a continuing sequence of stages, tasks, or events in a circular flow and emphasize the connection between all components.-PowerPoint Layouts Sales Cycle Process PPT Slide Designs
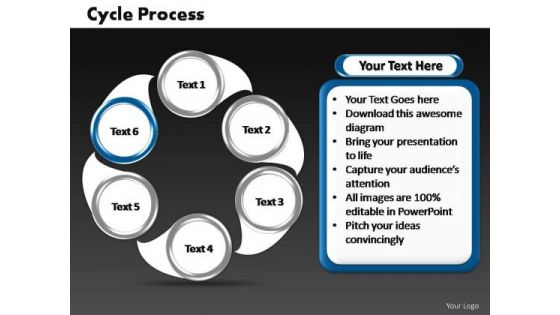
PowerPoint Layouts Success Cycle Process Ppt Backgrounds
PowerPoint Layouts Success Cycle Process PPT Backgrounds-In a cycle diagram, you can explain the main events in the cycle, how they interact, and how the cycle repeats. These Diagrams can be used to interact visually and logically with audiences. Use this graphic to represent a continuing sequence of stages, tasks, or events in a circular flow and emphasize the connection between all components.-PowerPoint Layouts Success Cycle Process PPT Backgrounds
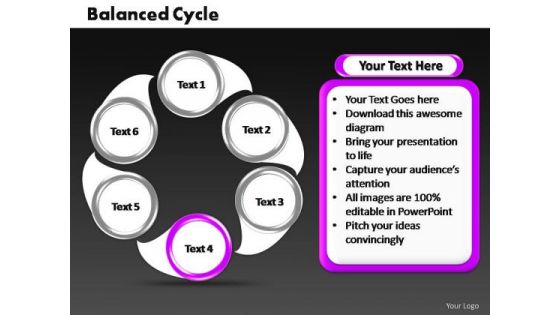
PowerPoint Presentation Chart Cycle Process Ppt Template
PowerPoint Presentation Chart Cycle Process PPT Template-In a cycle diagram, you can explain the main events in the cycle, how they interact, and how the cycle repeats. These Diagrams can be used to interact visually and logically with audiences. Use this graphic to represent a continuing sequence of stages, tasks, or events in a circular flow and emphasize the connection between all components.-PowerPoint Presentation Chart Cycle Process PPT Template

PowerPoint Backgrounds Chart Circular Process Ppt Design Slides
PowerPoint Backgrounds Chart Circular Process PPT Design Slides-Cycle Diagrams are a type of graphics that shows how items are related to one another in a repeating cycle. In a cycle diagram, you can explain the main events in the cycle, how they interact, and how the cycle repeats. These Diagrams can be used to interact visually and logically with audiences.-PowerPoint Backgrounds Chart Circular Process PPT Design Slides

PowerPoint Backgrounds Chart Cycle Process Ppt Themes
PowerPoint Backgrounds Chart Cycle Process PPT Themes-Cycle Diagrams are a type of graphics that shows how items are related to one another in a repeating cycle. In a cycle diagram, you can explain the main events in the cycle, how they interact, and how the cycle repeats. These Diagrams can be used to interact visually and logically with audiences.-PowerPoint Backgrounds Chart Cycle Process PPT Themes
PowerPoint Backgrounds Growth Cycle Chart Ppt Design
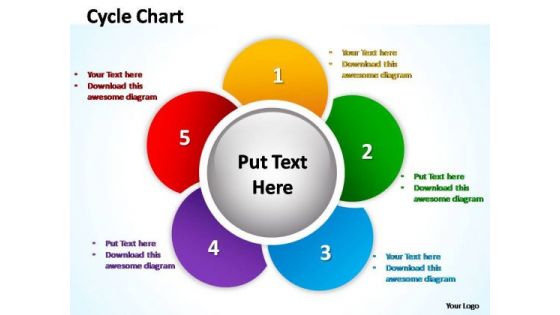
PowerPoint Backgrounds Growth Cycle Chart PPT Design-Cycle Diagrams are a type of graphics that shows how items are related to one another in a repeating cycle. In a cycle diagram, you can explain the main events in the cycle, how they interact, and how the cycle repeats. These Diagrams can be used to interact visually and logically with audiences.-PowerPoint Backgrounds Growth Cycle Chart PPT Design

PowerPoint Backgrounds Image Cycle Chart Ppt Slide
PowerPoint Backgrounds Image Cycle Chart PPT Slide-Cycle Diagrams are a type of graphics that shows how items are related to one another in a repeating cycle. In a cycle diagram, you can explain the main events in the cycle, how they interact, and how the cycle repeats. These Diagrams can be used to interact visually and logically with audiences.-PowerPoint Backgrounds Image Cycle Chart PPT Slide
PowerPoint Backgrounds Leadership Cycle Process Ppt Theme
PowerPoint Backgrounds Leadership Cycle Process PPT Theme-Cycle Diagrams are a type of graphics that shows how items are related to one another in a repeating cycle. In a cycle diagram, you can explain the main events in the cycle, how they interact, and how the cycle repeats. These Diagrams can be used to interact visually and logically with audiences.-PowerPoint Backgrounds Leadership Cycle Process PPT Theme

PowerPoint Backgrounds Process Cycle Process Ppt Slide
PowerPoint Backgrounds Process Cycle Process PPT Slide-Cycle Diagrams are a type of graphics that shows how items are related to one another in a repeating cycle. In a cycle diagram, you can explain the main events in the cycle, how they interact, and how the cycle repeats. These Diagrams can be used to interact visually and logically with audiences.-PowerPoint Backgrounds Process Cycle Process PPT Slide

PowerPoint Backgrounds Teamwork Cycle Process Ppt Design Slides
PowerPoint Backgrounds Teamwork Cycle Process PPT Design Slides-Cycle Diagrams are a type of graphics that shows how items are related to one another in a repeating cycle. In a cycle diagram, you can explain the main events in the cycle, how they interact, and how the cycle repeats. These Diagrams can be used to interact visually and logically with audiences.-PowerPoint Backgrounds Teamwork Cycle Process PPT Design Slides
PowerPoint Design Chart Cycle Process Ppt Backgrounds
PowerPoint Design Chart Cycle Process PPT Backgrounds-Cycle Diagrams are a type of graphics that shows how items are related to one another in a repeating cycle. In a cycle diagram, you can explain the main events in the cycle, how they interact, and how the cycle repeats. These Diagrams can be used to interact visually and logically with audiences.-PowerPoint Design Chart Cycle Process PPT Backgrounds
PowerPoint Design Graphic Cycle Process Ppt Slide
PowerPoint Design Graphic Cycle Process PPT Slide-Cycle Diagrams are a type of graphics that shows how items are related to one another in a repeating cycle. In a cycle diagram, you can explain the main events in the cycle, how they interact, and how the cycle repeats. These Diagrams can be used to interact visually and logically with audiences.-PowerPoint Design Graphic Cycle Process PPT Slide
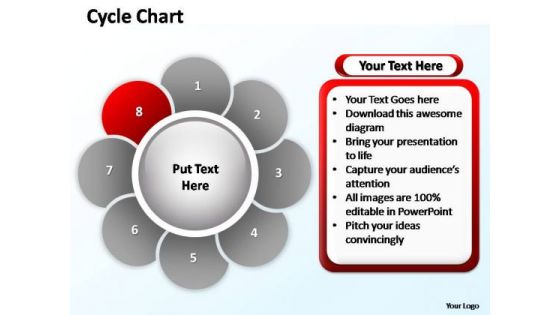
PowerPoint Design Image Cycle Chart Ppt Templates
PowerPoint Design Image Cycle Chart PPT Templates-Cycle Diagrams are a type of graphics that shows how items are related to one another in a repeating cycle. In a cycle diagram, you can explain the main events in the cycle, how they interact, and how the cycle repeats. These Diagrams can be used to interact visually and logically with audiences.-PowerPoint Design Image Cycle Chart PPT Templates

PowerPoint Design Image Cycle Process Ppt Template
PowerPoint Design Image Cycle Process PPT Template-Cycle Diagrams are a type of graphics that shows how items are related to one another in a repeating cycle. In a cycle diagram, you can explain the main events in the cycle, how they interact, and how the cycle repeats. These Diagrams can be used to interact visually and logically with audiences.-PowerPoint Design Image Cycle Process PPT Template
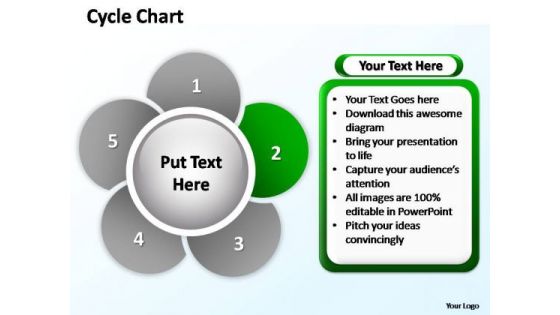
PowerPoint Designs Business Cycle Chart Ppt Slides
PowerPoint Designs Business Cycle Chart PPT Slides-Cycle Diagrams are a type of graphics that shows how items are related to one another in a repeating cycle. In a cycle diagram, you can explain the main events in the cycle, how they interact, and how the cycle repeats. These Diagrams can be used to interact visually and logically with audiences. -PowerPoint Designs Business Cycle Chart PPT Slides
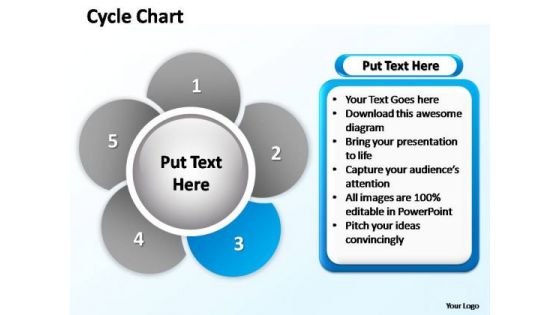
PowerPoint Designs Company Cycle Chart Ppt Process
PowerPoint Designs Company Cycle Chart PPT Process-Cycle Diagrams are a type of graphics that shows how items are related to one another in a repeating cycle. In a cycle diagram, you can explain the main events in the cycle, how they interact, and how the cycle repeats. These Diagrams can be used to interact visually and logically with audiences. -PowerPoint Designs Company Cycle Chart PPT Process

PowerPoint Designs Image Cycle Chart Ppt Layout
PowerPoint Designs Image Cycle Chart PPT Layout-Cycle Diagrams are a type of graphics that shows how items are related to one another in a repeating cycle. In a cycle diagram, you can explain the main events in the cycle, how they interact, and how the cycle repeats. These Diagrams can be used to interact visually and logically with audiences. -PowerPoint Designs Image Cycle Chart PPT Layout
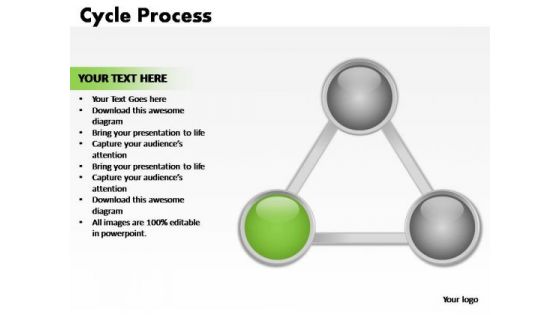
PowerPoint Designs Company Cycle Process Ppt Templates
PowerPoint Designs Company Cycle Process PPT Templates-Cycle Diagrams are a type of graphics that shows how items are related to one another in a repeating cycle. In a cycle diagram, you can explain the main events in the cycle, how they interact, and how the cycle repeats. These Diagrams can be used to interact visually and logically with audiences. -PowerPoint Designs Company Cycle Process PPT Templates

PowerPoint Designs Editable Cycle Process Ppt Backgrounds
PowerPoint Designs Editable Cycle Process PPT Backgrounds-Cycle Diagrams are a type of graphics that shows how items are related to one another in a repeating cycle. In a cycle diagram, you can explain the main events in the cycle, how they interact, and how the cycle repeats. These Diagrams can be used to interact visually and logically with audiences. -PowerPoint Designs Editable Cycle Process PPT Backgrounds

PowerPoint Designs Image Cycle Process Ppt Process
PowerPoint Designs Image Cycle Process PPT Process-Cycle Diagrams are a type of graphics that shows how items are related to one another in a repeating cycle. In a cycle diagram, you can explain the main events in the cycle, how they interact, and how the cycle repeats. These Diagrams can be used to interact visually and logically with audiences. -PowerPoint Designs Image Cycle Process PPT Process

PowerPoint Designs Marketing Cycle Process Ppt Templates
PowerPoint Designs Marketing Cycle Process PPT Templates-Cycle Diagrams are a type of graphics that shows how items are related to one another in a repeating cycle. In a cycle diagram, you can explain the main events in the cycle, how they interact, and how the cycle repeats. These Diagrams can be used to interact visually and logically with audiences. -PowerPoint Designs Marketing Cycle Process PPT Templates
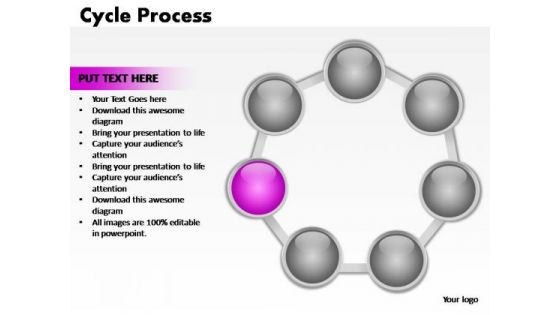
PowerPoint Slides Company Cycle Process Ppt Design
PowerPoint Slides Company Cycle Process PPT Design-Cycle Diagrams are a type of graphics that shows how items are related to one another in a repeating cycle. In a cycle diagram, you can explain the main events in the cycle, how they interact, and how the cycle repeats. These Diagrams can be used to interact visually and logically with audiences. -PowerPoint Slides Company Cycle Process PPT Design

PowerPoint Slides Company Cycle Process Ppt Slide
PowerPoint Slides Company Cycle Process PPT Slide-Cycle Diagrams are a type of graphics that shows how items are related to one another in a repeating cycle. In a cycle diagram, you can explain the main events in the cycle, how they interact, and how the cycle repeats. These Diagrams can be used to interact visually and logically with audiences. -PowerPoint Slides Company Cycle Process PPT Slide
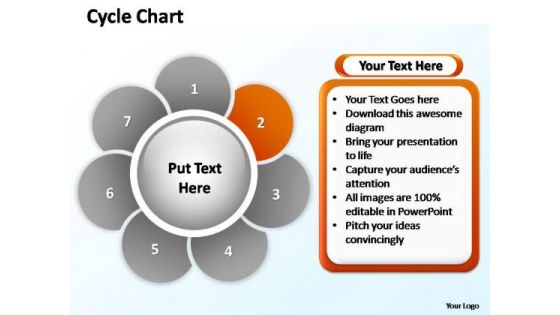
PowerPoint Slides Growth Cycle Chart Ppt Presentation
PowerPoint Slides Growth Cycle Chart PPT Presentation-Cycle Diagrams are a type of graphics that shows how items are related to one another in a repeating cycle. In a cycle diagram, you can explain the main events in the cycle, how they interact, and how the cycle repeats. These Diagrams can be used to interact visually and logically with audiences. -PowerPoint Slides Growth Cycle Chart PPT Presentation
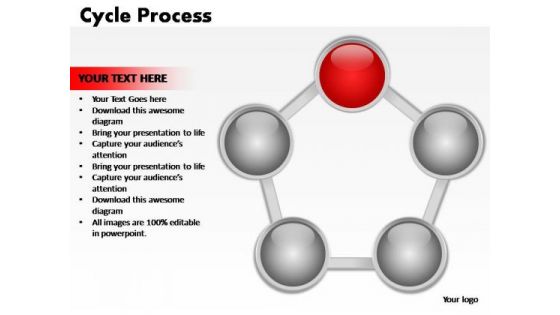
PowerPoint Slides Sales Cycle Process Ppt Designs
PowerPoint Slides Sales Cycle Process PPT Designs-Cycle Diagrams are a type of graphics that shows how items are related to one another in a repeating cycle. In a cycle diagram, you can explain the main events in the cycle, how they interact, and how the cycle repeats. These Diagrams can be used to interact visually and logically with audiences. -PowerPoint Slides Sales Cycle Process PPT Designs
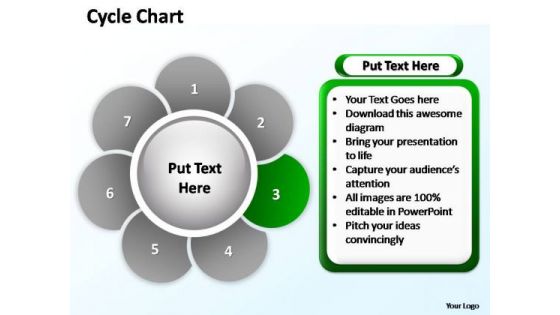
PowerPoint Slides Strategy Cycle Chart Ppt Layouts
PowerPoint Slides Strategy Cycle Chart PPT Layouts-Cycle Diagrams are a type of graphics that shows how items are related to one another in a repeating cycle. In a cycle diagram, you can explain the main events in the cycle, how they interact, and how the cycle repeats. These Diagrams can be used to interact visually and logically with audiences. -PowerPoint Slides Strategy Cycle Chart PPT Layouts

PowerPoint Template Chart Cycle Process Ppt Theme
PowerPoint Template Chart Cycle Process PPT Theme-Cycle Diagrams are a type of graphics that shows how items are related to one another in a repeating cycle. In a cycle diagram, you can explain the main events in the cycle, how they interact, and how the cycle repeats. These Diagrams can be used to interact visually and logically with audiences. -PowerPoint Template Chart Cycle Process PPT Theme

PowerPoint Template Company Cycle Process Ppt Slides
PowerPoint Template Company Cycle Process PPT Slides-Cycle Diagrams are a type of graphics that shows how items are related to one another in a repeating cycle. In a cycle diagram, you can explain the main events in the cycle, how they interact, and how the cycle repeats. These Diagrams can be used to interact visually and logically with audiences. -PowerPoint Template Company Cycle Process PPT Slides

PowerPoint Template Diagram Cycle Process Ppt Presentation
PowerPoint Template Diagram Cycle Process PPT Presentation-Cycle Diagrams are a type of graphics that shows how items are related to one another in a repeating cycle. In a cycle diagram, you can explain the main events in the cycle, how they interact, and how the cycle repeats. These Diagrams can be used to interact visually and logically with audiences. -PowerPoint Template Diagram Cycle Process PPT Presentation

PowerPoint Theme Editable Cycle Chart Ppt Backgrounds
PowerPoint Theme Editable Cycle Chart PPT Backgrounds-Cycle Diagrams are a type of graphics that shows how items are related to one another in a repeating cycle. In a cycle diagram, you can explain the main events in the cycle, how they interact, and how the cycle repeats. These Diagrams can be used to interact visually and logically with audiences. -PowerPoint Theme Editable Cycle Chart PPT Backgrounds
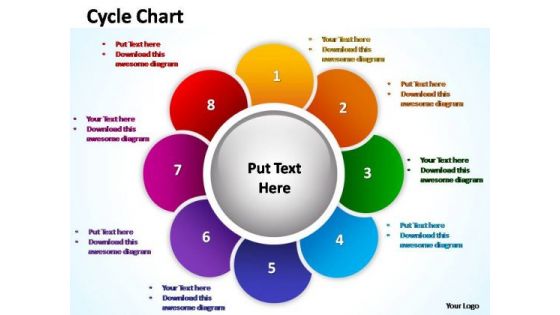
PowerPoint Theme Leadership Cycle Chart Ppt Layout
PowerPoint Theme Leadership Cycle Chart PPT Layout-Cycle Diagrams are a type of graphics that shows how items are related to one another in a repeating cycle. In a cycle diagram, you can explain the main events in the cycle, how they interact, and how the cycle repeats. These Diagrams can be used to interact visually and logically with audiences. -PowerPoint Theme Leadership Cycle Chart PPT Layout

PowerPoint Theme Marketing Cycle Chart Ppt Templates
PowerPoint Theme Marketing Cycle Chart PPT Templates-Cycle Diagrams are a type of graphics that shows how items are related to one another in a repeating cycle. In a cycle diagram, you can explain the main events in the cycle, how they interact, and how the cycle repeats. These Diagrams can be used to interact visually and logically with audiences. -PowerPoint Theme Marketing Cycle Chart PPT Templates

PowerPoint Theme Process Cycle Process Ppt Designs
PowerPoint Theme Process Cycle Process PPT Designs-Cycle Diagrams are a type of graphics that shows how items are related to one another in a repeating cycle. In a cycle diagram, you can explain the main events in the cycle, how they interact, and how the cycle repeats. These Diagrams can be used to interact visually and logically with audiences. -PowerPoint Theme Process Cycle Process PPT Designs
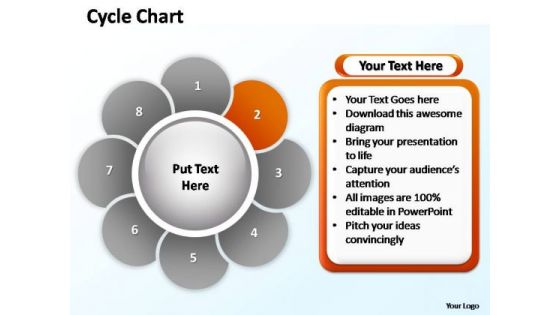
PowerPoint Themes Marketing Cycle Chart Ppt Designs
PowerPoint Themes Marketing Cycle Chart PPT Designs-Cycle Diagrams are a type of graphics that shows how items are related to one another in a repeating cycle. In a cycle diagram, you can explain the main events in the cycle, how they interact, and how the cycle repeats. These Diagrams can be used to interact visually and logically with audiences. -PowerPoint Themes Marketing Cycle Chart PPT Designs
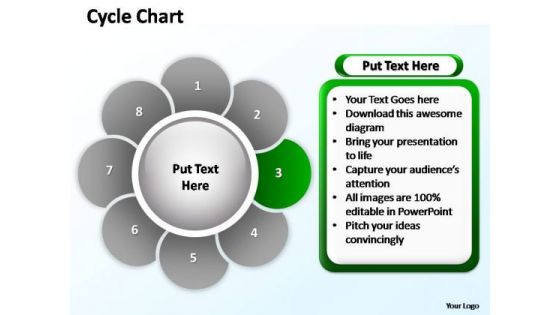
PowerPoint Themes Teamwork Cycle Chart Ppt Template
PowerPoint Themes Teamwork Cycle Chart PPT Template-Cycle Diagrams are a type of graphics that shows how items are related to one another in a repeating cycle. In a cycle diagram, you can explain the main events in the cycle, how they interact, and how the cycle repeats. These Diagrams can be used to interact visually and logically with audiences. -PowerPoint Themes Teamwork Cycle Chart PPT Template
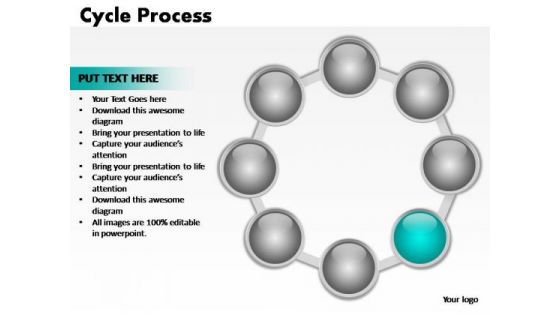
PowerPoint Themes Teamwork Cycle Process Ppt Design
PowerPoint Themes Teamwork Cycle Process PPT Design-Cycle Diagrams are a type of graphics that shows how items are related to one another in a repeating cycle. In a cycle diagram, you can explain the main events in the cycle, how they interact, and how the cycle repeats. These Diagrams can be used to interact visually and logically with audiences. -PowerPoint Themes Teamwork Cycle Process PPT Design
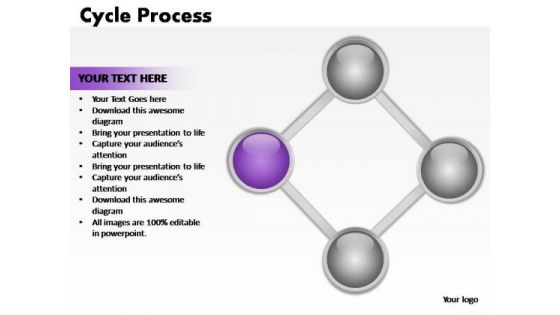
PowerPoint Themes Teamwork Cycle Process Ppt Process
PowerPoint Themes Teamwork Cycle Process PPT Process-Cycle Diagrams are a type of graphics that shows how items are related to one another in a repeating cycle. In a cycle diagram, you can explain the main events in the cycle, how they interact, and how the cycle repeats. These Diagrams can be used to interact visually and logically with audiences. -PowerPoint Themes Teamwork Cycle Process PPT Process
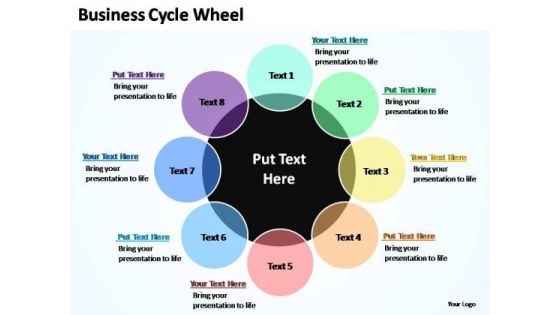
PowerPoint Slide Designs Success Business Cycle Ppt Design
PowerPoint Slide Designs Success Business Cycle PPT Design-In a cycle diagram, you can explain the main events in the cycle, how they interact, and how the cycle repeats. These Diagrams can be used to interact visually and logically with audiences. Use this graphic to represent a continuing sequence of stages, tasks, or events in a circular flow and emphasize the connection between all components.-PowerPoint Slide Designs Success Business Cycle PPT Design

PowerPoint Slide Growth Business Cycle Ppt Design
PowerPoint Slide Growth Business Cycle PPT Design-In a cycle diagram, you can explain the main events in the cycle, how they interact, and how the cycle repeats. These Diagrams can be used to interact visually and logically with audiences. Use this graphic to represent a continuing sequence of stages, tasks, or events in a circular flow and emphasize the connection between all components.-PowerPoint Slide Growth Business Cycle PPT Design

Project Work Breakdown Structure With Scope And Deliverables For Audit Automation Ppt PowerPoint Presentation Layouts Topics PDF
Persuade your audience using this project work breakdown structure with scope and deliverables for audit automation ppt powerpoint presentation layouts topics pdf. This PPT design covers two stages, thus making it a great tool to use. It also caters to a variety of topics including project scopes, deliverables, application of rpa in process of auditing, business intelligence data analytics for financial reporting, development of database and it system, automation of accounting report. Download this PPT design now to present a convincing pitch that not only emphasizes the topic but also showcases your presentation skills.
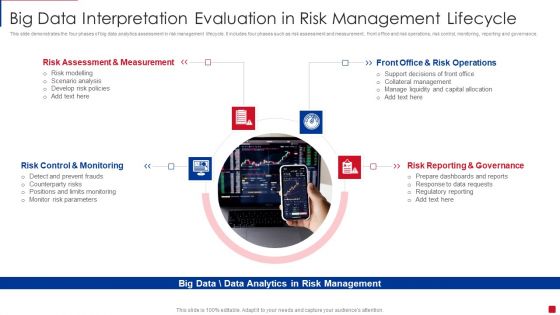
Big Data Interpretation Evaluation In Risk Management Lifecycle Designs PDF
This slide demonstrates the four phases of big data analytics assessment in risk management lifecycle. It includes four phases such as risk assessment and measurement, front office and risk operations, risk control, monitoring, reporting and governance. Persuade your audience using this Big Data Interpretation Evaluation In Risk Management Lifecycle Designs PDF. This PPT design covers four stages, thus making it a great tool to use. It also caters to a variety of topics including Risk Assessment And Measurement, Risk Control And Monitoring , Risk Reporting And Governance. Download this PPT design now to present a convincing pitch that not only emphasizes the topic but also showcases your presentation skills.
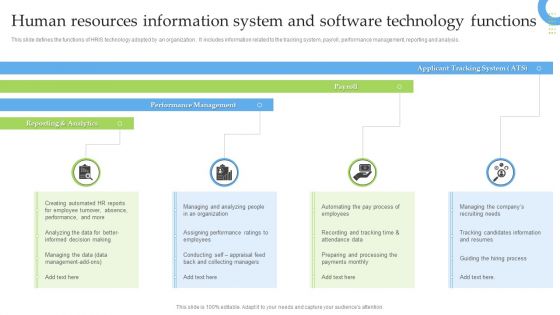
Human Resources Information System And Software Technology Functions Professional PDF
This slide defines the functions of HRIS technology adopted by an organization . It includes information related to the tracking system, payroll, performance management, reporting and analysis. Persuade your audience using this Human Resources Information System And Software Technology Functions Professional PDF. This PPT design covers four stages, thus making it a great tool to use. It also caters to a variety of topics including Reporting And Analytics, Performance Management, Payroll. Download this PPT design now to present a convincing pitch that not only emphasizes the topic but also showcases your presentation skills.

 Home
Home