Power Bi
Analysis For Strategic Account Plan Icon Ppt Example SS
This slide mentions key features and advantages of using power bi tool. The purpose of this slide is to transform the business data into meaningful data in form of interactive charts, graphs, reports and dashboards. It helps organization to find insights and embed them in the application or website for accessing data on go. Boost your pitch with our creative Analysis For Strategic Account Plan Icon Ppt Example SS Deliver an awe-inspiring pitch that will mesmerize everyone. Using these presentation templates you will surely catch everyones attention. You can browse the ppts collection on our website. We have researchers who are experts at creating the right content for the templates. So you do not have to invest time in any additional work. Just grab the template now and use them.
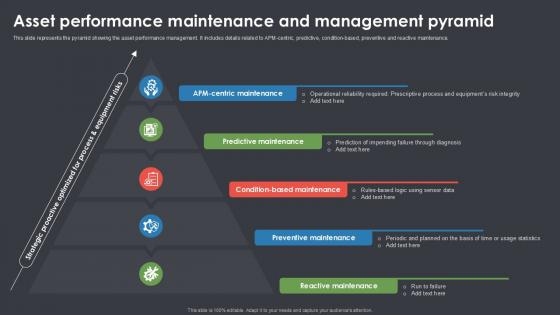
Asset Performance Maintenance And Management Pyramid Ppt Slide SS
This slide showcases dashboard for efficient cash management by power bi tool. The purpose of this slide is to maximize liquidity and minimize the cost of expenditures to ensure solvency. It provides companies with a window to analyze their financial position and improve overall profitability by scaling various problem areas. Boost your pitch with our creative Asset Performance Maintenance And Management Pyramid Ppt Slide SS. Deliver an awe-inspiring pitch that will mesmerize everyone. Using these presentation templates you will surely catch everyones attention. You can browse the ppts collection on our website. We have researchers who are experts at creating the right content for the templates. So you do not have to invest time in any additional work. Just grab the template now and use them.
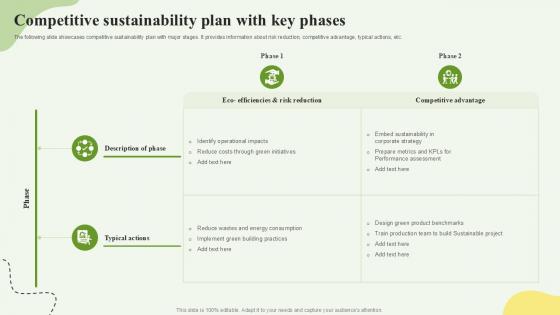
Competitive Sustainability Plan With Key Phases Ppt Template SS
This slide showcases dashboard for real estate company sales. This template aims to show a power bi dashboard for property dealer sales analysis representing total sales by project, actual sales, total revenue, number of contracts signed and marketing details. It is very useful tool for real estate developers and other property dealers. From laying roadmaps to briefing everything in detail, our templates are perfect for you. You can set the stage with your presentation slides. All you have to do is download these easy-to-edit and customizable templates. Competitive Sustainability Plan With Key Phases Ppt Template SS will help you deliver an outstanding performance that everyone would remember and praise you for. Do download this presentation today.

Corporate Performance Pyramid Showing Internal And External Efficiency Ppt Template SS
This slide highlights dashboard for evaluating financial performance using power bi tool. The purpose of this template is to provide managers with an efficient tool for comparing profit metrics across the quarters. It allows users to select different quarters and estimate sales of various products. Present like a pro with Corporate Performance Pyramid Showing Internal And External Efficiency Ppt Template SS Create beautiful presentations together with your team, using our easy-to-use presentation slides. Share your ideas in real-time and make changes on the fly by downloading our templates. So whether you are in the office, on the go, or in a remote location, you can stay in sync with your team and present your ideas with confidence. With Slidegeeks presentation got a whole lot easier. Grab these presentations today.
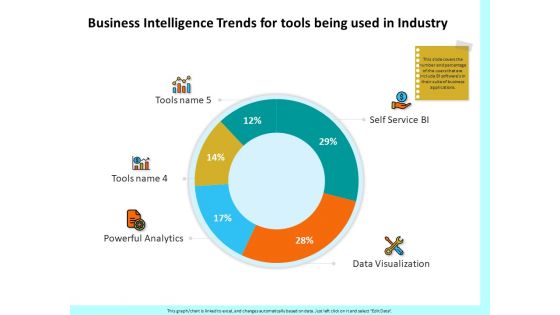
Firm Productivity Administration Business Intelligence Trends For Tools Being Used In Industry Summary PDF
Presenting this set of slides with name firm productivity administration business intelligence trends for tools being used in industry summary pdf. The topics discussed in these slides are self service bi, data visualization, powerful analytics tools. This is a completely editable PowerPoint presentation and is available for immediate download. Download now and impress your audience.
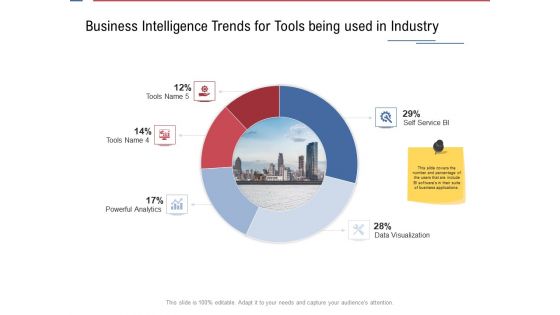
Data Assimilation Business Intelligence Trends For Tools Being Used In Industry Ppt Summary Graphics Design PDF
Deliver and pitch your topic in the best possible manner with this data assimilation business intelligence trends for tools being used in industry ppt summary graphics design pdf. Use them to share invaluable insights on self service bi, data visualization, powerful analytics and impress your audience. This template can be altered and modified as per your expectations. So, grab it now.

Facts Assessment Business Intelligence Trends For Tools Being Used In Industry Download PDF
Presenting this set of slides with name facts assessment business intelligence trends for tools being used in industry download pdf. This is a six stage process. The stages in this process are self service bi, data visualization, powerful analytics tools. This is a completely editable PowerPoint presentation and is available for immediate download. Download now and impress your audience.

Enterprise Problem Solving And Intellect Business Intelligence Trends For Tools Being Used In Industry Introduction PDF
Presenting this set of slides with name enterprise problem solving and intellect business intelligence trends for tools being used in industry introduction pdf. This is a five stage process. The stages in this process are self service bi, data visualization, powerful analytics tools. This is a completely editable PowerPoint presentation and is available for immediate download. Download now and impress your audience.
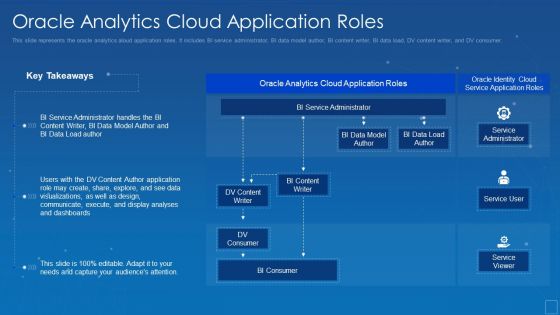
Oracle Analytics Cloud Application Roles Background PDF
This slide represents the oracle analytics aloud application roles. It includes BI service administrator, BI data model author, BI content writer, BI data load, DV content writer, and DV consumer. Deliver an awe inspiring pitch with this creative oracle analytics cloud application roles background pdf bundle. Topics like administrator, content, communicate, dashboards, visualizations can be discussed with this completely editable template. It is available for immediate download depending on the needs and requirements of the user.

Business Framework Benefits Of Business Intelligence PowerPoint Presentation
Define the benefits of business intelligence with our exclusive power point diagram slide. This diagram slide has been crafted with graphic of business intelligence model. This diagram represents the tools, systems and software to show the strategic planning process. Use this BI model for transforming raw data in in meaning full information.
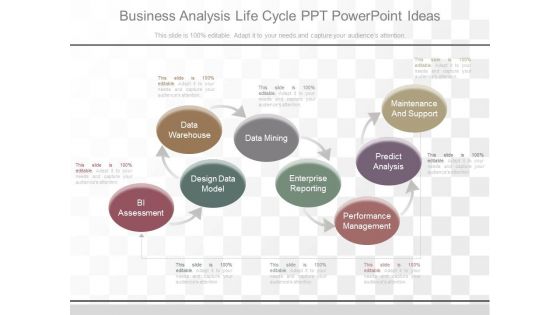
Business Analysis Life Cycle Ppt Powerpoint Ideas
This is a business analysis life cycle ppt powerpoint ideas. This is a eight stage process. The stages in this process are bi assessment, design data model, data warehouse, data mining, enterprise reporting, performance management, predict analysis, maintenance and support.

SAC Planning And Implementation SAP Analytics Cloud As Business Intelligence Tool Themes PDF
The purpose of the following slide is to provide information regarding SAP Analytics Cloud as business intelligence tool. It also provides details regarding the core capabilities of suite as BI, planning, predictive and mobile along with SAP digital boardroom. This is a SAC Planning And Implementation SAP Analytics Cloud As Business Intelligence Tool Themes PDF template with various stages. Focus and dispense information on four stages using this creative set, that comes with editable features. It contains large content boxes to add your information on topics like BI Capabilities, SAP Digital Boardroom, Mobile Capabilities. You can also showcase facts, figures, and other relevant content using this PPT layout. Grab it now.
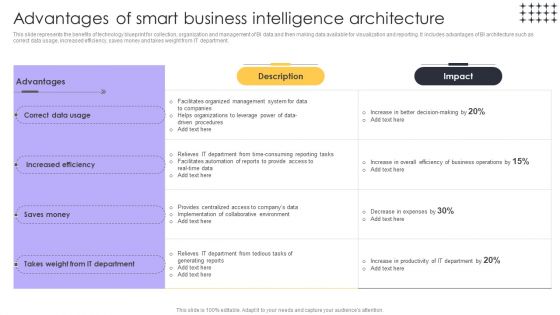
Tools For HR Business Analytics Advantages Of Smart Business Intelligence Architecture Microsoft PDF
This slide represents the benefits of technology blueprint for collection, organization and management of BI data and then making data available for visualization and reporting. It includes advantages of BI architecture such as correct data usage, increased efficiency, saves money and takes weight from IT department. Find a pre-designed and impeccable Tools For HR Business Analytics Advantages Of Smart Business Intelligence Architecture Microsoft PDF. The templates can ace your presentation without additional effort. You can download these easy-to-edit presentation templates to make your presentation stand out from others. So, what are you waiting for Download the template from Slidegeeks today and give a unique touch to your presentation.
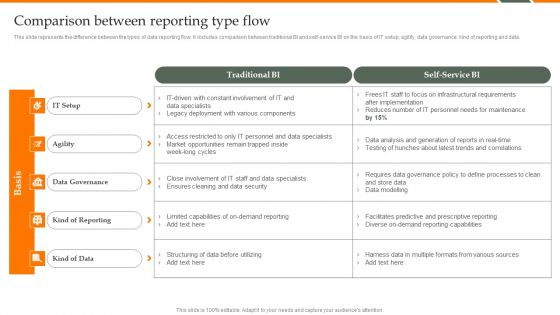
Human Resource Analytics Comparison Between Reporting Type Flow Demonstration PDF
This slide represents the difference between the types of data reporting flow. It includes comparison between traditional BI and self-service BI on the basis of IT setup, agility, data governance, kind of reporting and data. If your project calls for a presentation, then Slidegeeks is your go-to partner because we have professionally designed, easy-to-edit templates that are perfect for any presentation. After downloading, you can easily edit Human Resource Analytics Comparison Between Reporting Type Flow Demonstration PDF and make the changes accordingly. You can rearrange slides or fill them with different images. Check out all the handy templates.
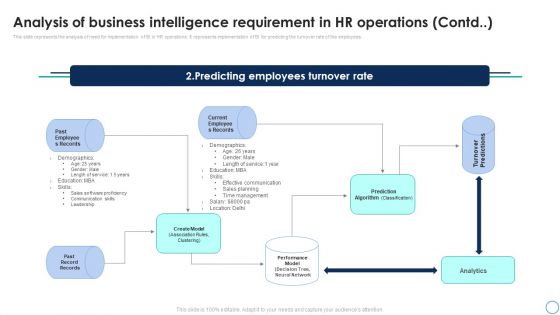
Business Analytics Application Analysis Of Business Intelligence Requirement In HR Infographics PDF
This slide represents the analysis of need for implementation of BI in HR operations. It represents implementation of BI for predicting the turnover rate of the employees. Create an editable Business Analytics Application Analysis Of Business Intelligence Requirement In HR Infographics PDF that communicates your idea and engages your audience. Whether youre presenting a business or an educational presentation, pre-designed presentation templates help save time. Business Analytics Application Analysis Of Business Intelligence Requirement In HR Infographics PDF is highly customizable and very easy to edit, covering many different styles from creative to business presentations. Slidegeeks has creative team members who have crafted amazing templates. So, go and get them without any delay.

Sustainable Initiatives For Competitive Business Intelligence Governance For Competitive Template PDF
This slide shows model which can guide companies in gaining competitive advantage through effective business intelligence BI governance. It provides information about BI deployment, internal resources, innovation perception, etc. If your project calls for a presentation, then Slidegeeks is your go-to partner because we have professionally designed, easy-to-edit templates that are perfect for any presentation. After downloading, you can easily edit Sustainable Initiatives For Competitive Business Intelligence Governance For Competitive Template PDF and make the changes accordingly. You can rearrange slides or fill them with different images. Check out all the handy templates
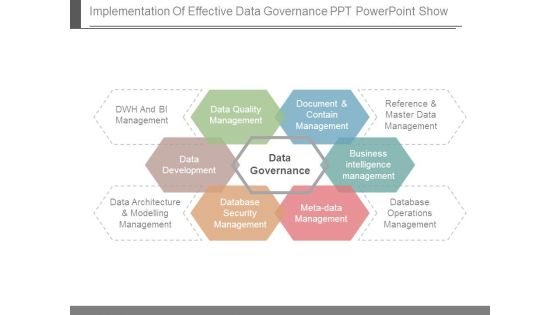
Implementation Of Effective Data Governance Ppt Powerpoint Show
This is a implementation of effective data governance ppt powerpoint show. This is a six stage process. The stages in this process are dwh and bi management, data quality management, document and contain management, reference and master data management, business intelligence management, database operations management, meta data management, database security management, data architecture and modelling management, data development, data governance.

Tools For HR Business Analytics Comparison Between Reporting Type Flow Inspiration PDF
This slide represents the difference between the types of data reporting flow. It includes comparison between traditional BI and self-service BI on the basis of IT setup, agility, data governance, kind of reporting and data. If you are looking for a format to display your unique thoughts, then the professionally designed Tools For HR Business Analytics Comparison Between Reporting Type Flow Inspiration PDF is the one for you. You can use it as a Google Slides template or a PowerPoint template. Incorporate impressive visuals, symbols, images, and other charts. Modify or reorganize the text boxes as you desire. Experiment with shade schemes and font pairings. Alter, share or cooperate with other people on your work. Download Tools For HR Business Analytics Comparison Between Reporting Type Flow Inspiration PDF and find out how to give a successful presentation. Present a perfect display to your team and make your presentation unforgettable.
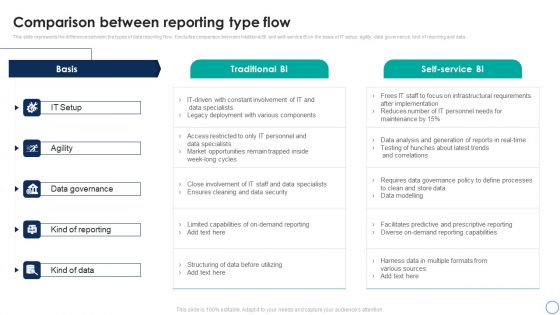
Business Analytics Application Comparison Between Reporting Type Flow Ideas PDF
This slide represents the difference between the types of data reporting flow. It includes comparison between traditional BI and self-service BI on the basis of IT setup, agility, data governance, kind of reporting and data. Are you in need of a template that can accommodate all of your creative concepts This one is crafted professionally and can be altered to fit any style. Use it with Google Slides or PowerPoint. Include striking photographs, symbols, depictions, and other visuals. Fill, move around, or remove text boxes as desired. Test out color palettes and font mixtures. Edit and save your work, or work with colleagues. Download Business Analytics Application Comparison Between Reporting Type Flow Ideas PDF and observe how to make your presentation outstanding. Give an impeccable presentation to your group and make your presentation unforgettable.

Tools For HR Business Analytics Roles And Responsibilities Of Business Intelligence Team Sample PDF
This slide represents the roles and responsibilities of people which would lead implementation proves and make architectural, technical and strategic decisions. It includes roles and responsibilities of Head of BI, BI engineer and data analyst. Retrieve professionally designed Tools For HR Business Analytics Roles And Responsibilities Of Business Intelligence Team Sample PDF to effectively convey your message and captivate your listeners. Save time by selecting pre-made slideshows that are appropriate for various topics, from business to educational purposes. These themes come in many different styles, from creative to corporate, and all of them are easily adjustable and can be edited quickly. Access them as PowerPoint templates or as Google Slides themes. You dont have to go on a hunt for the perfect presentation because Slidegeeks got you covered from everywhere.
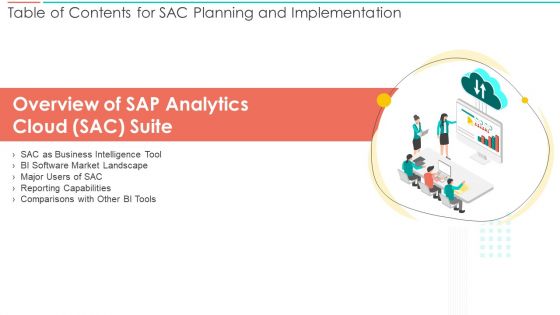
Table Of Contents For SAC Planning And Implementation Ppt PowerPoint Presentation File Graphics PDF
This is a Table Of Contents For SAC Planning And Implementation Ppt PowerPoint Presentation File Graphics PDF template with various stages. Focus and dispense information on one stages using this creative set, that comes with editable features. It contains large content boxes to add your information on topics like SAC Business, Intelligence Tool, BI Software, Market Landscape, Reporting Capabilities. You can also showcase facts, figures, and other relevant content using this PPT layout. Grab it now.

Planning And Predicting Of Logistics Management Inventory Management Information PDF
This is a planning and predicting of logistics management inventory management information pdf. template with various stages. Focus and dispense information on three stages using this creative set, that comes with editable features. It contains large content boxes to add your information on topics like stochastic modeling, uncertainty modeling, bi level optimization. You can also showcase facts, figures, and other relevant content using this PPT layout. Grab it now.
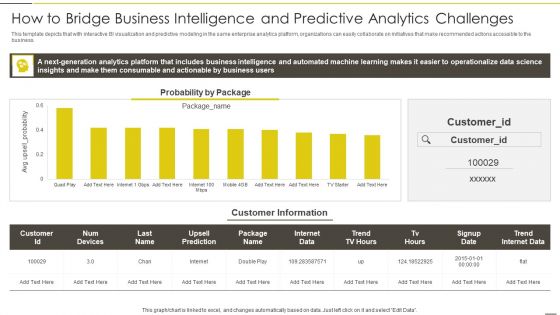
Administered Data And Analytic Quality Playbook How To Bridge Business Intelligence Sample PDF
This template depicts that with interactive BI visualization and predictive modeling in the same enterprise analytics platform, organizations can easily collaborate on initiatives that make recommended actions accessible to the business.Deliver an awe inspiring pitch with this creative Administered Data And Analytic Quality Playbook How To Bridge Business Intelligence Sample PDF bundle. Topics like Generation Analytics, Consumable Actionable, Operationalize Science can be discussed with this completely editable template. It is available for immediate download depending on the needs and requirements of the user.

Data Interpretation And Analysis Playbook How To Bridge Business Intelligence And Predictive Analytics Challenges Designs PDF
This template depicts that with interactive BI visualization and predictive modeling in the same enterprise analytics platform, organizations can easily collaborate on initiatives that make recommended actions accessible to the business. Deliver an awe inspiring pitch with this creative data interpretation and analysis playbook how to bridge business intelligence and predictive analytics challenges designs pdf bundle. Topics like how to bridge business intelligence and predictive analytics challenges can be discussed with this completely editable template. It is available for immediate download depending on the needs and requirements of the user.
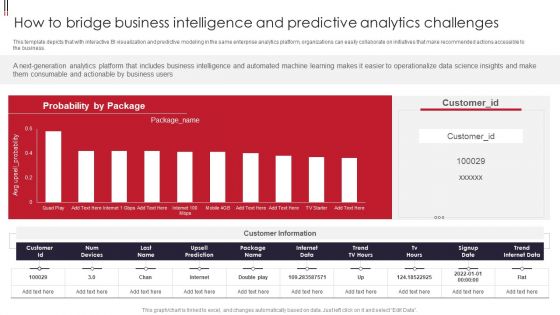
Information Visualizations Playbook How To Bridge Business Intelligence And Predictive Analytics Challenges Themes PDF
This template depicts that with interactive BI visualization and predictive modeling in the same enterprise analytics platform, organizations can easily collaborate on initiatives that make recommended actions accessible to the business. Deliver and pitch your topic in the best possible manner with this Information Visualizations Playbook How To Bridge Business Intelligence And Predictive Analytics Challenges Themes PDF. Use them to share invaluable insights on Business Users, Operationalize Data Science, Num Devices and impress your audience. This template can be altered and modified as per your expectations. So, grab it now.
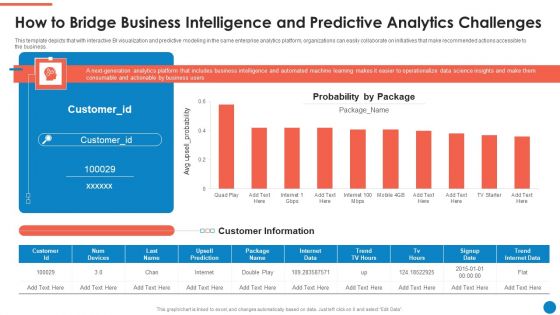
Data And Analytics Playbook How To Bridge Business Intelligence And Predictive Graphics PDF
This template depicts that with interactive BI visualization and predictive modeling in the same enterprise analytics platform, organizations can easily collaborate on initiatives that make recommended actions accessible to the business. Deliver and pitch your topic in the best possible manner with this Data And Analytics Playbook How To Bridge Business Intelligence And Predictive Graphics PDF. Use them to share invaluable insights on Probability By Package, Customer Information, Internet Data and impress your audience. This template can be altered and modified as per your expectations. So, grab it now.

How To Bridge Business Intelligence And Predictive Analytics Challenges Microsoft PDF
This template depicts that with interactive BI visualization and predictive modeling in the same enterprise analytics platform, organizations can easily collaborate on initiatives that make recommended actions accessible to the business. Deliver an awe inspiring pitch with this creative How To Bridge Business Intelligence And Predictive Analytics Challenges Microsoft PDF bundle. Topics like Business Intelligence, Operationalize Data Science, Probability By Package can be discussed with this completely editable template. It is available for immediate download depending on the needs and requirements of the user.

Data Interpretation And Analysis Playbook Business Intelligence And Predictive Analytics Challenges Template PDF
This template covers the problems while implementing BI and predictive analytics in the organization. The challenges are undefined KPIs and metrics, and unable to hire right data science talent. Presenting data interpretation and analysis playbook business intelligence and predictive analytics challenges template pdf to provide visual cues and insights. Share and navigate important information on two stages that need your due attention. This template can be used to pitch topics like security vulnerabilities, operationalizing, perform analysis, deployed. In addtion, this PPT design contains high resolution images, graphics, etc, that are easily editable and available for immediate download.
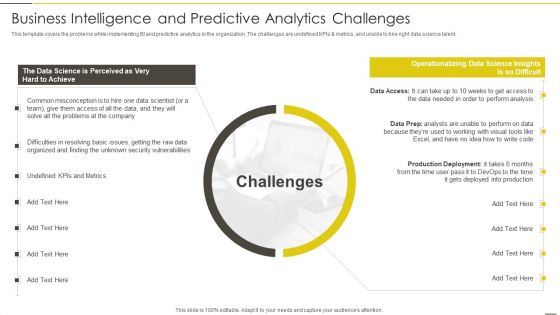
Administered Data And Analytic Quality Playbook Business Intelligence And Predictive Download PDF
This template covers the problems while implementing BI and predictive analytics in the organization. The challenges are undefined KPIs and metrics, and unable to hire right data science talent. Deliver and pitch your topic in the best possible manner with this Administered Data And Analytic Quality Playbook Business Intelligence And Predictive Download PDF Use them to share invaluable insights on Common Misconception, Operationalizing, Production Deployment and impress your audience. This template can be altered and modified as per your expectations. So, grab it now.
Information Visualizations Playbook Business Intelligence And Predictive Analytics Challenges Icons PDF
This template covers the problems while implementing BI and predictive analytics in the organization. The challenges are undefined KPIs and metrics, and unable to hire right data science talent. Presenting Information Visualizations Playbook Business Intelligence And Predictive Analytics Challenges Icons PDF to provide visual cues and insights. Share and navigate important information on two stages that need your due attention. This template can be used to pitch topics like Raw Data Organized, Security Vulnerabilities, Perform Analysis. In addtion, this PPT design contains high resolution images, graphics, etc, that are easily editable and available for immediate download.

Analysis Of Business Intelligence Requirement In HR Operations Background PDF
This slide represents the need for implementing business intelligence in HR operations. It represents the requirement of prediction of employee performance for which BI is required.Boost your pitch with our creative Analysis Of Business Intelligence Requirement In HR Operations Background PDF. Deliver an awe-inspiring pitch that will mesmerize everyone. Using these presentation templates you will surely catch everyones attention. You can browse the ppts collection on our website. We have researchers who are experts at creating the right content for the templates. So you do not have to invest time in any additional work. Just grab the template now and use them.
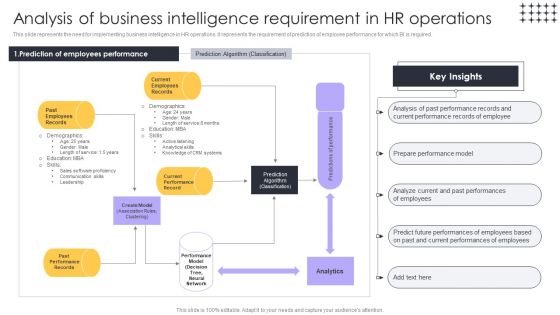
Tools For HR Business Analytics Analysis Of Business Intelligence Requirement In HR Slides PDF
This slide represents the need for implementing business intelligence in HR operations. It represents the requirement of prediction of employee performance for which BI is required. Boost your pitch with our creative Tools For HR Business Analytics Analysis Of Business Intelligence Requirement In HR Slides PDF. Deliver an awe-inspiring pitch that will mesmerize everyone. Using these presentation templates you will surely catch everyones attention. You can browse the ppts collection on our website. We have researchers who are experts at creating the right content for the templates. So you dont have to invest time in any additional work. Just grab the template now and use them.
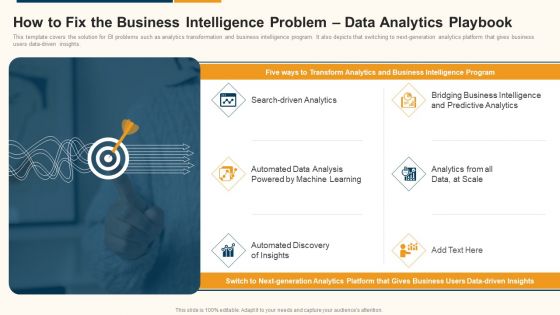
Data Interpretation And Analysis Playbook How To Fix The Business Intelligence Problem Data Analytics Playbook Sample PDF
This template covers the solution for BI problems such as analytics transformation and business intelligence program. It also depicts that switching to next-generation analytics platform that gives business users data-driven insights. Presenting data interpretation and analysis playbook how to fix the business intelligence problem data analytics playbook sample pdf to provide visual cues and insights. Share and navigate important information on six stages that need your due attention. This template can be used to pitch topics like analytics, business intelligence, predictive analytics. In addtion, this PPT design contains high resolution images, graphics, etc, that are easily editable and available for immediate download.

Salesforce Leaders In Product Salesforce Business Profile Information PDF
This slide highlights the leading products of salesforce which includes sales force automation, CRM customer engagement center, digital commerce, analytics and BI platform and enterprise integration platform. This is a Salesforce Leaders In Product Salesforce Business Profile Information PDF template with various stages. Focus and dispense information on tweleve stages using this creative set, that comes with editable features. It contains large content boxes to add your information on topics like Sales, Service, Marketing, Commerce. You can also showcase facts, figures, and other relevant content using this PPT layout. Grab it now.

How To Fix The Business Intelligence Problem Strategic Playbook For Data Analytics And Machine Learning Designs PDF
This template covers the solution for BI problems such as analytics transformation and business intelligence program. It also depicts that switching to next generation analytics platform that gives business users data driven insights. This is a How To Fix The Business Intelligence Problem Strategic Playbook For Data Analytics And Machine Learning Designs PDF template with various stages. Focus and dispense information on six stages using this creative set, that comes with editable features. It contains large content boxes to add your information on topics like Automated Data Analysis, Search Driven Analytics, Predictive Analytics. You can also showcase facts, figures, and other relevant content using this PPT layout. Grab it now.
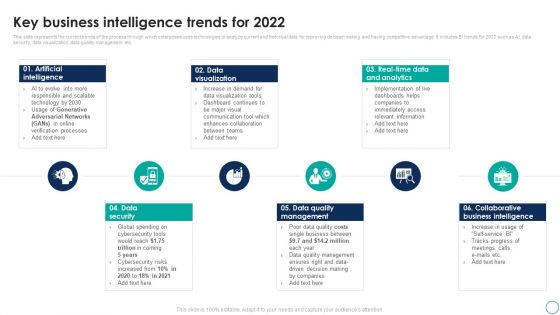
Business Analytics Application Key Business Intelligence Trends For 2022 Infographics PDF
This slide represents the current trends of the process through which enterprises uses technologies to analyze current and historical data for improving decision making and having competitive advantage. It includes BI trends for 2022 such as AI, data security, data visualization, data quality management etc. The best PPT templates are a great way to save time, energy, and resources. Slidegeeks have 100 percent editable powerpoint slides making them incredibly versatile. With these quality presentation templates, you can create a captivating and memorable presentation by combining visually appealing slides and effectively communicating your message. Download Business Analytics Application Key Business Intelligence Trends For 2022 Infographics PDF from Slidegeeks and deliver a wonderful presentation.

Web Hosting Software Company Outline Salesforce Leaders In Product Graphics PDF
This slide highlights the leading products of salesforce which includes sales force automation, CRM customer engagement center, digital commerce, analytics and BI platform and enterprise integration platform. The best PPT templates are a great way to save time, energy, and resources. Slidegeeks have 100 percent editable powerpoint slides making them incredibly versatile. With these quality presentation templates, you can create a captivating and memorable presentation by combining visually appealing slides and effectively communicating your message. Download Web Hosting Software Company Outline Salesforce Leaders In Product Graphics PDF from Slidegeeks and deliver a wonderful presentation.
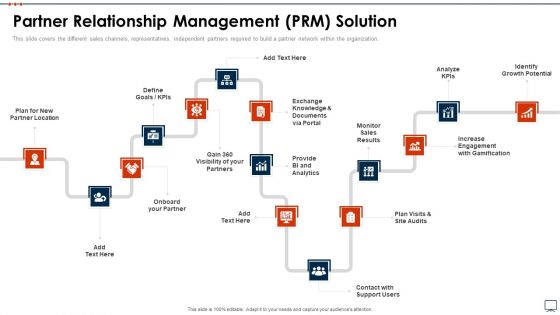
Business Plan Methods Tools And Templates Set 2 Partner Relationship Management PRM Solution Download PDF
This slide covers the different sales channels, representatives, independent partners required to build a partner network within the organization. Presenting business plan methods tools and templates set 2 partner relationship management prm solution download pdf to provide visual cues and insights. Share and navigate important information on one stages that need your due attention. This template can be used to pitch topics like analyze kpis, growth potential, monitor sales, provide bi and analytics. In addtion, this PPT design contains high resolution images, graphics, etc, that are easily editable and available for immediate download.
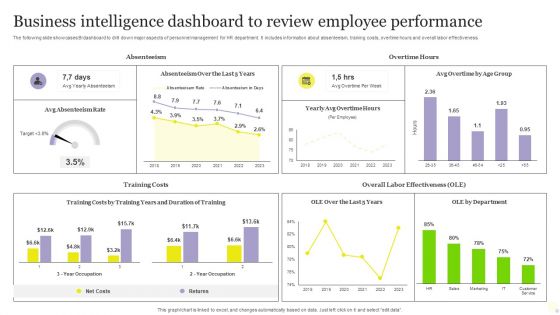
Business Intelligence Dashboard To Review Employee Performance Pictures PDF
The following slide showcases BI dashboard to drill down major aspects of personnel management for HR department. It includes information about absenteeism, training costs, overtime hours and overall labor effectiveness. Showcasing this set of slides titled Business Intelligence Dashboard To Review Employee Performance Pictures PDF. The topics addressed in these templates are Business Intelligence Dashboard, Review Employee Performance. All the content presented in this PPT design is completely editable. Download it and make adjustments in color, background, font etc. as per your unique business setting.
PowerPoint Slide Designs Process Cycle Process Ppt Designs
PowerPoint_Slide_Designs_Process_Cycle_Process_PPT_Designs Business Power Points-Cycle Diagrams are a type of graphics that shows how items are related to one another in a repeating cycle. In a cycle diagram, you can explain the main events in the cycle, how they interact, and how the cycle repeats. These Diagrams can be used to interact visually and logically with audiences. -PowerPoint_Slide_Designs_Process_Cycle_Process_PPT_Designs Business Power Points

PowerPoint Slide Designs Success Cycle Process Ppt Template
PowerPoint_Slide_Designs_Success_Cycle_Process_PPT_Template Business Power Points-Cycle Diagrams are a type of graphics that shows how items are related to one another in a repeating cycle. In a cycle diagram, you can explain the main events in the cycle, how they interact, and how the cycle repeats. These Diagrams can be used to interact visually and logically with audiences. -PowerPoint_Slide_Designs_Success_Cycle_Process_PPT_Template Business Power Points
PowerPoint Slide Diagram Cycle Process Ppt Theme
PowerPoint_Slide_Diagram_Cycle_Process_PPT_Theme Business Power Points-Cycle Diagrams are a type of graphics that shows how items are related to one another in a repeating cycle. In a cycle diagram, you can explain the main events in the cycle, how they interact, and how the cycle repeats. These Diagrams can be used to interact visually and logically with audiences. -PowerPoint_Slide_Diagram_Cycle_Process_PPT_Theme Business Power Points

PowerPoint Slide Graphic Cycle Chart Ppt Design
PowerPoint_Slide_Graphic_Cycle_Chart_PPT_Design Business Power Points-Cycle Diagrams are a type of graphics that shows how items are related to one another in a repeating cycle. In a cycle diagram, you can explain the main events in the cycle, how they interact, and how the cycle repeats. These Diagrams can be used to interact visually and logically with audiences. -PowerPoint_Slide_Graphic_Cycle_Chart_PPT_Design Business Power Points

PowerPoint Slide Layout Graphic Cycle Process Ppt Theme
PowerPoint_Slide_layout_Graphic_Cycle_Process_PPT_Theme Business Power Points-Cycle Diagrams are a type of graphics that shows how items are related to one another in a repeating cycle. In a cycle diagram, you can explain the main events in the cycle, how they interact, and how the cycle repeats. These Diagrams can be used to interact visually and logically with audiences. -PowerPoint_Slide_layout_Graphic_Cycle_Process_PPT_Theme Business Power Points

PowerPoint Slide Layout Teamwork Cycle Process Ppt Backgrounds
PowerPoint_Slide_layout_Teamwork_Cycle_Process_PPT_Backgrounds Business Power Points-Cycle Diagrams are a type of graphics that shows how items are related to one another in a repeating cycle. In a cycle diagram, you can explain the main events in the cycle, how they interact, and how the cycle repeats. These Diagrams can be used to interact visually and logically with audiences. -PowerPoint_Slide_layout_Teamwork_Cycle_Process_PPT_Backgrounds Business Power Points

PowerPoint Slide Leadership Cycle Chart Ppt Design
PowerPoint_Slide_Leadership_Cycle_Chart_PPT_Design Business Power Points-Cycle Diagrams are a type of graphics that shows how items are related to one another in a repeating cycle. In a cycle diagram, you can explain the main events in the cycle, how they interact, and how the cycle repeats. These Diagrams can be used to interact visually and logically with audiences. -PowerPoint_Slide_Leadership_Cycle_Chart_PPT_Design Business Power Points
PowerPoint Slide Marketing Cycle Process Ppt Slide
PowerPoint_Slide_Marketing_Cycle_Process_PPT_Slide Business Power Points-Cycle Diagrams are a type of graphics that shows how items are related to one another in a repeating cycle. In a cycle diagram, you can explain the main events in the cycle, how they interact, and how the cycle repeats. These Diagrams can be used to interact visually and logically with audiences. -PowerPoint_Slide_Marketing_Cycle_Process_PPT_Slide Business Power Points
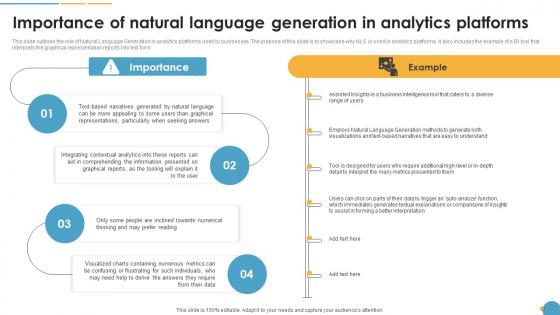
Importance Of Natural Language Generation In Analytics Platforms Natural Language Automation
This slide outlines the role of Natural Language Generation in analytics platforms used by businesses. The purpose of this slide is to showcase why NLG is used in analytics platforms. It also includes the example of a BI tool that interprets the graphical representation reports into text form. Explore a selection of the finest Importance Of Natural Language Generation In Analytics Platforms Natural Language Automation here. With a plethora of professionally designed and pre-made slide templates, you can quickly and easily find the right one for your upcoming presentation. You can use our Importance Of Natural Language Generation In Analytics Platforms Natural Language Automation to effectively convey your message to a wider audience. Slidegeeks has done a lot of research before preparing these presentation templates. The content can be personalized and the slides are highly editable. Grab templates today from Slidegeeks.

How To Bridge Business Intelligence And Predictive Analytics Challenges Mockup PDF
This template depicts that with interactive BI visualization and predictive modeling in the same enterprise analytics platform, organizations can easily collaborate on initiatives that make recommended actions accessible to the business. If you are looking for a format to display your unique thoughts, then the professionally designed How To Bridge Business Intelligence And Predictive Analytics Challenges Mockup PDF is the one for you. You can use it as a Google Slides template or a PowerPoint template. Incorporate impressive visuals, symbols, images, and other charts. Modify or reorganize the text boxes as you desire. Experiment with shade schemes and font pairings. Alter, share or cooperate with other people on your work. Download How To Bridge Business Intelligence And Predictive Analytics Challenges Mockup PDF and find out how to give a successful presentation. Present a perfect display to your team and make your presentation unforgettable.

Tools For HR Business Analytics Benefits Of Business Intelligence For HR Department Portrait PDF
This slide represents the importance of people-based business intelligence in transforming the scope of HR reporting and analytics. It includes benefits of BI in HR department such as improved performance, efficient hiring, robust CSR program and maintenance of good work culture. Want to ace your presentation in front of a live audience Our Tools For HR Business Analytics Benefits Of Business Intelligence For HR Department Portrait PDF can help you do that by engaging all the users towards you. Slidegeeks experts have put their efforts and expertise into creating these impeccable powerpoint presentations so that you can communicate your ideas clearly. Moreover, all the templates are customizable, and easy-to-edit and downloadable. Use these for both personal and commercial use.

Human Resource Analytics Analysis Of Business Intelligence Requirement Template PDF
This slide represents the need for implementing business intelligence in HR operations. It represents the requirement of prediction of employee performance for which BI is required. Do you know about Slidesgeeks Human Resource Analytics Analysis Of Business Intelligence Requirement Template PDF These are perfect for delivering any kind od presentation. Using it, create PowerPoint presentations that communicate your ideas and engage audiences. Save time and effort by using our pre-designed presentation templates that are perfect for a wide range of topic. Our vast selection of designs covers a range of styles, from creative to business, and are all highly customizable and easy to edit. Download as a PowerPoint template or use them as Google Slides themes.

Importance Of Natural Automated Content Generation PPT Sample
This slide outlines the role of Natural Language Generation in analytics platforms used by businesses. The purpose of this slide is to showcase why NLG is used in analytics platforms. It also includes the example of a BI tool that interprets the graphical representation reports into text form. Welcome to our selection of the Importance Of Natural Automated Content Generation PPT Sample. These are designed to help you showcase your creativity and bring your sphere to life. Planning and Innovation are essential for any business that is just starting out. This collection contains the designs that you need for your everyday presentations. All of our PowerPoints are 100Percent editable, so you can customize them to suit your needs. This multi-purpose template can be used in various situations. Grab these presentation templates today.
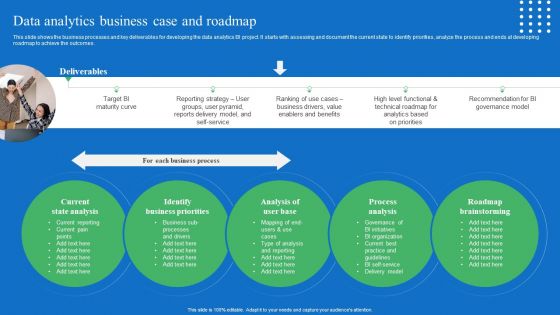
Toolkit For Data Science And Analytics Transition Data Analytics Business Case And Roadmap Designs PDF
This slide shows the business processes and key deliverables for developing the data analytics BI project. It starts with assessing and document the current state to identify priorities, analyze the process and ends at developing roadmap to achieve the outcomes. Get a simple yet stunning designed Toolkit For Data Science And Analytics Transition Data Analytics Business Case And Roadmap Designs PDF. It is the best one to establish the tone in your meetings. It is an excellent way to make your presentations highly effective. So, download this PPT today from Slidegeeks and see the positive impacts. Our easy to edit Toolkit For Data Science And Analytics Transition Data Analytics Business Case And Roadmap Designs PDF can be your go to option for all upcoming conferences and meetings. So, what are you waiting for Grab this template today.
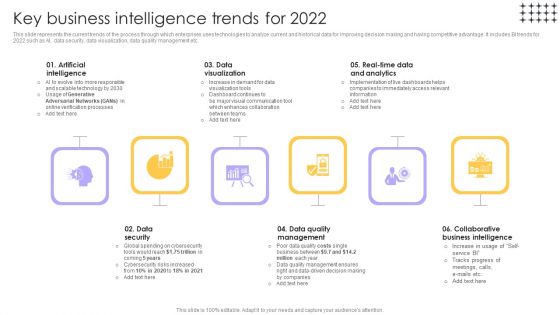
Tools For HR Business Analytics Key Business Intelligence Trends For 2022 Microsoft PDF
This slide represents the current trends of the process through which enterprises uses technologies to analyze current and historical data for improving decision making and having competitive advantage. It includes BI trends for 2022 such as AI, data security, data visualization, data quality management etc. Explore a selection of the finest Tools For HR Business Analytics Key Business Intelligence Trends For 2022 Microsoft PDF here. With a plethora of professionally designed and pre-made slide templates, you can quickly and easily find the right one for your upcoming presentation. You can use our Tools For HR Business Analytics Key Business Intelligence Trends For 2022 Microsoft PDF to effectively convey your message to a wider audience. Slidegeeks has done a lot of research before preparing these presentation templates. The content can be personalized and the slides are highly editable. Grab templates today from Slidegeeks.

Step 5 Employ Looker To Optimize Inventory Levels Data Analytics SS V
This slide explains use of inventory software aimed at helping businesses optimize inventory levels using effective analysis. It covers use of BI solution, vendor portal, hardware, accounting software, customer relationship management and enterprise resource planning.This modern and well-arranged Step 5 Employ Looker To Optimize Inventory Levels Data Analytics SS V provides lots of creative possibilities. It is very simple to customize and edit with the Powerpoint Software. Just drag and drop your pictures into the shapes. All facets of this template can be edited with Powerpoint, no extra software is necessary. Add your own material, put your images in the places assigned for them, adjust the colors, and then you can show your slides to the world, with an animated slide included.

Business Framework Predictive Analysis Enables Operational Insights PowerPoint Presentation
This Power Point template diagram slide has been designed with graphic of growth arrows with text boxes. This text box arrow contains the concept of predictive analysis for operational insights. Use this PPT slide for business operation related presentations.
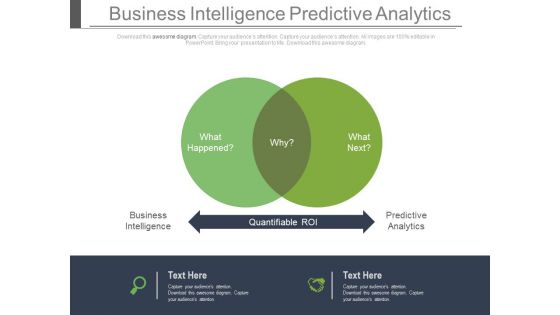
Venn Diagram For Business Intelligence And Predictive Analysis Powerpoint Slides
This power point template has been designed with two steps Venn diagram. Use this Venn diagram for business intelligence and predictive analysis. Illustrate your ideas and imprint them in the minds of your team with this template.
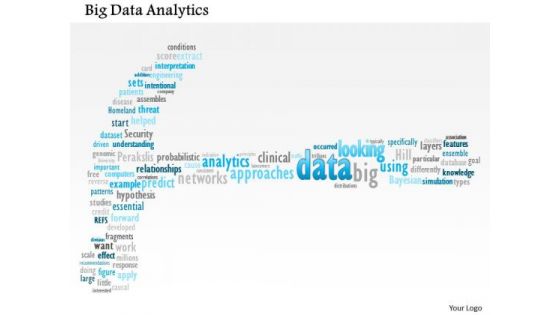
Business Framework Big Data Analytics PowerPoint Presentation
This unique power point diagram slide has been crafted with big data analytics. This data analytics is used to improve predictions and support decision making. Use this image slide for big data analysis related presentations.
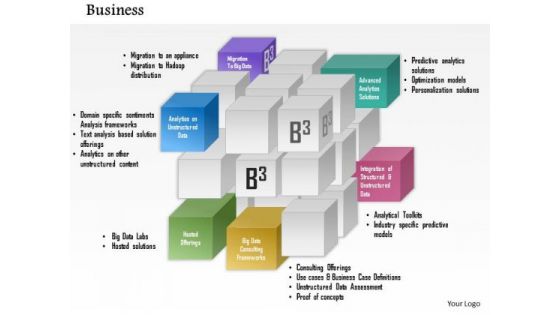
Business Framework Integrated Products And Services PowerPoint Presentation
This business framework power point diagram slide has been crafted for displaying business plan implementation. This PPT slide contains the cubical diagram to display multiple application of business plan. Use this PPT slide for Predictive analytics solutions, Optimization models and \nPersonalization solutions representation.
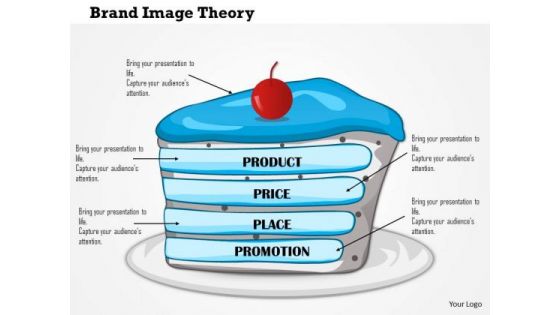
Business Framework Brand Image Theory PowerPoint Presentation
Colored chart graphic with multiple milestones has been used to decorate this Power Point template slide. This PPT slide contains the concept of data prediction. This slide shows big data from descriptive to predictive way. Use this PPT slide for business data analysis related presentation.

 Home
Home