Pie Chart Comparison

Business Circle Charts PowerPoint Templates Business Gears Process Ppt Slides
Business Circle Charts PowerPoint Templates Business Gears Process PPT Slides-This PowerPoint diagram shows gears aligned and working together. Can represent processing or teamwork-Business Circle Charts PowerPoint Templates Business Gears Process PPT Slides-This template can be used for presentations relating to 3d, Business, Circle, Circular, Clockwork, Cogs, Cogwheel, Colorful, Colors, Community, Component, Concept, Cooperate, Cooperation, Cycle, Cyclical, Different, Diverse, Diversity, Gear, Geometric, Hi-Tech, Idea, Industrial, Industry, Machine, Machinery, Mechanical, Mechanics, Round, Process,Progress
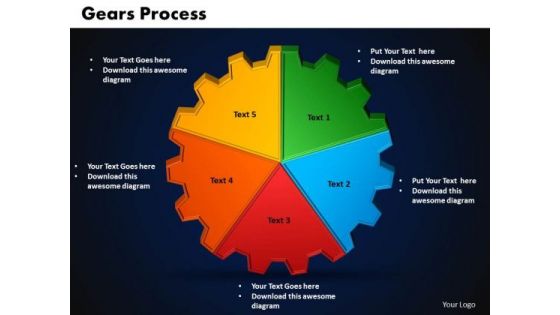
Business Circle Charts PowerPoint Templates Leadership Gears Process Ppt Slides
Business Circle Charts PowerPoint Templates Leadership Gears Process PPT Slides-This PowerPoint diagram shows gears aligned and working together. Can represent processing or teamwork-Business Circle Charts PowerPoint Templates Leadership Gears Process PPT Slides-This template can be used for presentations relating to 3d, Business, Circle, Circular, Clockwork, Cogs, Cogwheel, Colorful, Colors, Community, Component, Concept, Cooperate, Cooperation, Cycle, Cyclical, Different, Diverse, Diversity, Gear, Geometric, Hi-Tech, Idea, Industrial, Industry, Machine, Machinery, Mechanical, Mechanics, Round, Process,Progress
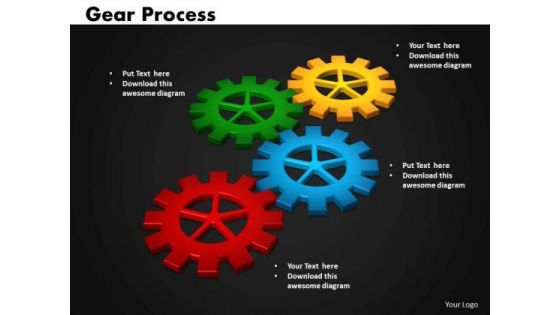
Business Circle Charts PowerPoint Templates Teamwork Gears Process Ppt Slides
Business Circle Charts PowerPoint Templates Teamwork Gears Process PPT Slides-This PowerPoint diagram slide shows gears aligned and working together. Can represent processing or teamwork-Business Circle Charts PowerPoint Templates Teamwork Gears Process PPT Slides-This template can be used for presentations relating to 3d, Business, Circle, Circular, Clockwork, Cogs, Cogwheel, Colorful, Colors, Community, Component, Concept, Cooperate, Cooperation, Cycle, Cyclical, Different, Diverse, Diversity, Gear, Geometric, Hi-Tech, Idea, Industrial, Industry, Machine, Machinery, Mechanical, Mechanics, Round, Process,Progress

Business Circle Charts PowerPoint Templates Strategy Gears Process Ppt Slides
Business Circle Charts PowerPoint Templates Strategy Gears Process PPT Slides-Development Strategy should primarily be seen as a process.. Illustrate your ideas with this diagram and demonstrate how each factor is important to prove how they mesh to motivate the company team and provide the steam to activate the composite machine-Business Circle Charts PowerPoint Templates Strategy Gears Process PPT Slides-This template can be used for presentations relating to 3d, Business, Circle, Circular, Clockwork, Cogs, Cogwheel, Colorful, Colors, Community, Component, Concept, Cooperate, Cooperation, Cycle, Cyclical, Different, Diverse, Diversity, Gear, Geometric, Hi-Tech, Idea, Industrial, Industry, Machine, Machinery, Mechanical, Mechanics, Round, Process,Progress

Customizable Circle Charts For Strategic Planning Process Clipart PDF
Pitch your topic with ease and precision using this Customizable Circle Charts For Strategic Planning Process Clipart PDF This layout presents information on Vision Statement, Mission Statement, Monitor Progress It is also available for immediate download and adjustment. So, changes can be made in the color, design, graphics or any other component to create a unique layout.

Business Circular Charts PowerPoint Templates Leadership Gears Process Ppt Slides
Business Circular Charts PowerPoint Templates Leadership Gears Process PPT Slides-This PowerPoint Template shows Leadership Gears Process Chart.You can easily edit the size, position, text and color.-Business Circular Charts PowerPoint Templates Leadership Gears Process PPT Slides-This template can be used for presentations relating to 3d, Business, Circle, Circular, Clockwork, Cogs, Cogwheel, Colorful, Colors, Community, Component, Concept, Cooperate, Cooperation, Cycle, Cyclical, Different, Diverse, Diversity, Gear, Geometric, Hi-Tech, Idea, Industrial, Industry, Machine, Machinery, Mechanical, Mechanics, Round, Process,Progress
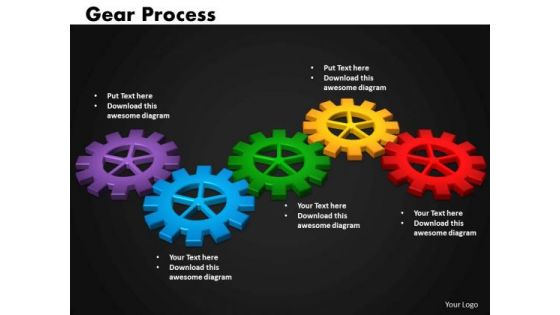
Business Circular Charts PowerPoint Templates Marketing Gears Process Ppt Slides
Business Circular Charts PowerPoint Templates Marketing Gears Process PPT Slides-Effective Marketing is Essential if You Want Your Business to Get Noticed. So explain you marketing plan with this wonderful diagram-Business Circular Charts PowerPoint Templates Marketing Gears Process PPT Slides-This template can be used for presentations relating to 3d, Business, Circle, Circular, Clockwork, Cogs, Cogwheel, Colorful, Colors, Community, Component, Concept, Cooperate, Cooperation, Cycle, Cyclical, Different, Diverse, Diversity, Gear, Geometric, Hi-Tech, Idea, Industrial, Industry, Machine, Machinery, Mechanical, Mechanics, Round, Process,Progress
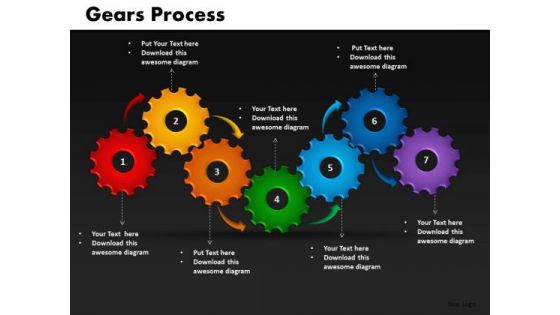
Business Circular Charts PowerPoint Templates Teamworks Gears Process Ppt Slides
Business Circular Charts PowerPoint Templates Teamworks Gears Process PPT Slides-This PowerPoint diagram slide shows gears aligned and working together. Can represent processing or teamwork-Business Circular Charts PowerPoint Templates Teamworks Gears Process PPT Slides-This template can be used for presentations relating to 3d, Business, Circle, Circular, Clockwork, Cogs, Cogwheel, Colorful, Colors, Community, Component, Concept, Cooperate, Cooperation, Cycle, Cyclical, Different, Diverse, Diversity, Gear, Geometric, Hi-Tech, Idea, Industrial, Industry, Machine, Machinery, Mechanical, Mechanics, Round, Process,Progress

Business Circular Charts PowerPoint Templates Business Gears Process Ppt Slides
Business Circular Charts PowerPoint Templates Business Gears Process PPT Slides-Develop ideas from this diagram and you can also map and Outline Views.-Business Circular Charts PowerPoint Templates Business Gears Process PPT Slides-This template can be used for presentations relating to 3d, Business, Circle, Circular, Clockwork, Cogs, Cogwheel, Colorful, Colors, Community, Component, Concept, Cooperate, Cooperation, Cycle, Cyclical, Different, Diverse, Diversity, Gear, Geometric, Hi-Tech, Idea, Industrial, Industry, Machine, Machinery, Mechanical, Mechanics, Round, Process,Progress
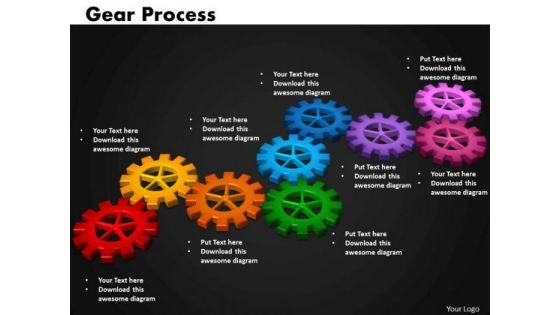
Business Circular Charts PowerPoint Templates Growth Gears Process Ppt Slides
Business Circular Charts PowerPoint Templates Growth Gears Process PPT Slides-Geared devices can change the speed, and direction of a power source. Use this graphic to explain sustainability objectives.-Business Circular Charts PowerPoint Templates Growth Gears Process PPT Slides-This template can be used for presentations relating to 3d, Business, Circle, Circular, Clockwork, Cogs, Cogwheel, Colorful, Colors, Community, Component, Concept, Cooperate, Cooperation, Cycle, Cyclical, Different, Diverse, Diversity, Gear, Geometric, Hi-Tech, Idea, Industrial, Industry, Machine, Machinery, Mechanical, Mechanics, Round, Process,Progress
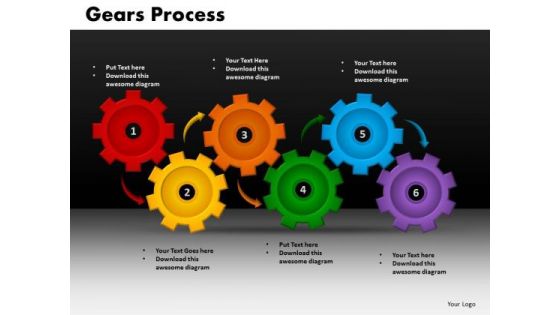
Business Circular Charts PowerPoint Templates Success Gears Process Ppt Slides
Business Circular Charts PowerPoint Templates Success Gears Process PPT Slides-Use this graphics for most important events during the event identification and analysis stage. -Business Circular Charts PowerPoint Templates Success Gears Process PPT Slides-This template can be used for presentations relating to 3d, Business, Circle, Circular, Clockwork, Cogs, Cogwheel, Colorful, Colors, Community, Component, Concept, Cooperate, Cooperation, Cycle, Cyclical, Different, Diverse, Diversity, Gear, Geometric, Hi-Tech, Idea, Industrial, Industry, Machine, Machinery, Mechanical, Mechanics, Round, Process,Progress

Business Circular Charts PowerPoint Templates Process Gears Process Ppt Slides
Business Circular Charts PowerPoint Templates Process Gears Process PPT Slides-Highlight the key components of your entire manufacturing/ business process. Illustrate how each element flows seamlessly onto the next stage. Emphasise on any critical or key factors within them. Demonstrate how they all combine to form the final product.-Business Circular Charts PowerPoint Templates Process Gears Process PPT Slides-This template can be used for presentations relating to 3d, Business, Circle, Circular, Clockwork, Cogs, Cogwheel, Colorful, Colors, Community, Component, Concept, Cooperate, Cooperation, Cycle, Cyclical, Different, Diverse, Diversity, Gear, Geometric, Hi-Tech, Idea, Industrial, Industry, Machine, Machinery, Mechanical, Mechanics, Round, Process,Progress

Business Circular Charts PowerPoint Templates Strategy Gears Process Ppt Slides
Business Circular Charts PowerPoint Templates Strategy Gears Process PPT Slides-Development Strategy should primarily be seen as a process.. Illustrate your ideas with this diagram and demonstrate how each factor is important to prove how they mesh to motivate the company team and provide the steam to activate the composite machi-Business Circular Charts PowerPoint Templates Strategy Gears Process PPT Slides-This template can be used for presentations relating to 3d, Business, Circle, Circular, Clockwork, Cogs, Cogwheel, Colorful, Colors, Community, Component, Concept, Cooperate, Cooperation, Cycle, Cyclical, Different, Diverse, Diversity, Gear, Geometric, Hi-Tech, Idea, Industrial, Industry, Machine, Machinery, Mechanical, Mechanics, Round, Process,Progress
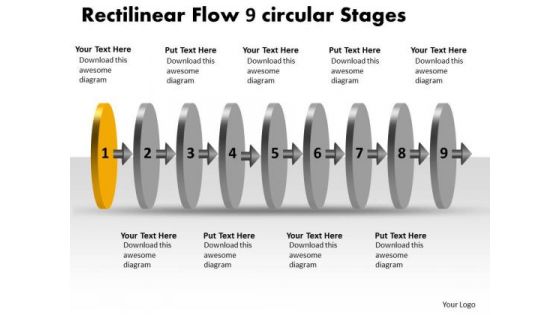
Rectilinear Flow 9 Circular Stages Free Charts PowerPoint Slides
We present our rectilinear flow 9 circular stages free charts PowerPoint Slides.Use our Circle Charts PowerPoint Templates because,The concept and strategy is your strength. Use our Arrows PowerPoint Templates because,You have the moves to sway the market. Use our Design PowerPoint Templates because,You are aware of some pitfalls ahead where you need to be cautious not to overrun and avoid a stall. Use our Shapes PowerPoint Templates because,They have fired the dreams of many fertile minds. Use our Process and Flows PowerPoint Templates because,Individual components well researched and understood in their place.Use these PowerPoint slides for presentations relating to abstract, arrow, blank, business, chart, circular, circulation, concept, conceptual, design, diagram, executive, flow, icon, idea, illustration, linear, management, model, numbers, organization, procedure, process, progression, resource, sequence, sequential, stages, steps, strategy. The prominent colors used in the PowerPoint template are Green, Gray, Black

Customizable Circle Charts Showing Revenue From US Region Themes PDF
Pitch your topic with ease and precision using this Customizable Circle Charts Showing Revenue From US Region Themes PDF This layout presents information on Customizable Circle, Charts Showing, Revenue Region It is also available for immediate download and adjustment. So, changes can be made in the color, design, graphics or any other component to create a unique layout.

Business Cycle Charts PowerPoint Templates Marketing Gears Process Ppt Slides
Business Cycle Charts PowerPoint Templates Marketing Gears Process PPT Slides-Effective Marketing is Essential if You Want Your Business to Get Noticed. So explain you marketing plan with this wonderful diagram-Business Cycle Charts PowerPoint Templates Marketing Gears Process PPT Slides-This template can be used for presentations relating to 3d, Business, Circle, Circular, Clockwork, Cogs, Cogwheel, Colorful, Colors, Community, Component, Concept, Cooperate, Cooperation, Cycle, Cyclical, Different, Diverse, Diversity, Gear, Geometric, Hi-Tech, Idea, Industrial, Industry, Machine, Machinery, Mechanical, Mechanics, Round, Process,Progress

Business Cycle Charts PowerPoint Templates Business Gears Process Ppt Slides
Business Cycle Charts PowerPoint Templates Business Gears Process PPT Slides-Graphic gears Process is a mechanism or group of parts performing one function or serving one purpose in a complex situation-Business Cycle Charts PowerPoint Templates Business Gears Process PPT Slides-This template can be used for presentations relating to 3d, Business, Circle, Circular, Clockwork, Cogs, Cogwheel, Colorful, Colors, Community, Component, Concept, Cooperate, Cooperation, Cycle, Cyclical, Different, Diverse, Diversity, Gear, Geometric, Hi-Tech, Idea, Industrial, Industry, Machine, Machinery, Mechanical, Mechanics, Round, Process,Progress

Business Cycle Charts PowerPoint Templates Growth Gears Process Ppt Slides
Business Cycle Charts PowerPoint Templates Growth Gears Process PPT Slides-Geared devices can change the speed, and direction of a power source. Use this graphic to explain sustainability objectives.-Business Cycle Charts PowerPoint Templates Growth Gears Process PPT Slides-This template can be used for presentations relating to 3d, Business, Circle, Circular, Clockwork, Cogs, Cogwheel, Colorful, Colors, Community, Component, Concept, Cooperate, Cooperation, Cycle, Cyclical, Different, Diverse, Diversity, Gear, Geometric, Hi-Tech, Idea, Industrial, Industry, Machine, Machinery, Mechanical, Mechanics, Round, Process,Progress
Business Charts PowerPoint Templates Shiney Emoticon Thinking Face Sales
Business Charts PowerPoint templates shiney emoticon thinking face Sales-Use this Thinking Face to make your PowerPoint Presentation more informative and Expressive. It imitates the concept of gleam, glimmer, glisten, glitter, glow, envision, esteem, estimate, expect, fancy, feature, feel, foresee, gather, guess, hold, image, imagine, judge, plan for, presume, project, realize, vision, visualize.

Business Cycle Charts PowerPoint Templates Success Gears Process Ppt Slides
Business Cycle Charts PowerPoint Templates Success Gears Process PPT Slides-Use this graphics for most important events during the event identification and analysis stage.-Business Cycle Charts PowerPoint Templates Success Gears Process PPT Slides-This template can be used for presentations relating to 3d, Business, Circle, Circular, Clockwork, Cogs, Cogwheel, Colorful, Colors, Community, Component, Concept, Cooperate, Cooperation, Cycle, Cyclical, Different, Diverse, Diversity, Gear, Geometric, Hi-Tech, Idea, Industrial, Industry, Machine, Machinery, Mechanical, Mechanics, Round, Process,Progress
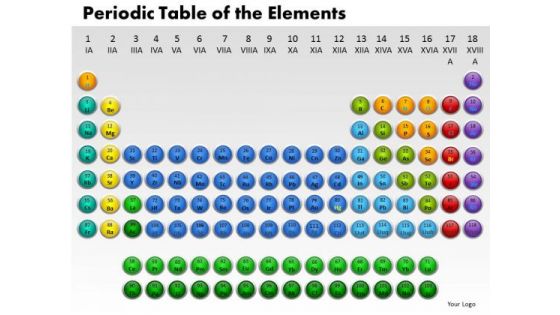
Business Circle Charts PowerPoint Templates Business Periodic Table Ppt Slides
Business Circle Charts PowerPoint Templates Business periodic table PPT Slides-Use this graphics to represent a continuing sequence of stages, tasks, or events in a circular flow and emphasize the connection between all components. -Business Circle Charts PowerPoint Templates Business periodic table PPT Slides-This template can be used for presentations relating to Actinoids, Atom, Atomic, Chemistry, Electrons, Element, Helium, Hydrogen, Lanthanoids, Liquid, Molecule, Noble, Periodic, Physics, Plutonium, Quantum, Radium, Science, Scientific, Solid, Symbol, Table
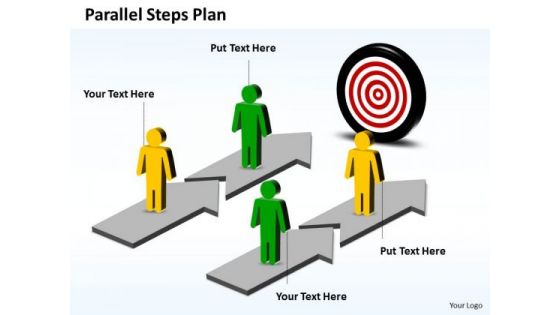
Business Charts PowerPoint Templates Parallel Steps Plan Towards Goal
Business Charts PowerPoint templates parallel steps plan towards goal-Use this Parallel Process with two steps in each process to represent a continuing sequence of stages, tasks, or events in a circular flow and emphasize the connection between all components. This Diagram will definitely make your Presentation more attractive and interesting.-Business Charts PowerPoint templates parallel steps plan towards goal

Business Charts PowerPoint Templates Parallel Steps Plan For Achieving Results
Business Charts PowerPoint templates parallel steps plan for achieving results-Use this Parallel Process with six steps in each process to represent a continuing sequence of stages, tasks, or events in a circular flow and emphasize the connection between all components. You can change color, size and orientation of any icon to your liking.-Business Charts PowerPoint templates parallel steps plan for achieving results

Business Circle Charts PowerPoint Templates Marketing Financial Planning Process Ppt Slides
Business Circle Charts PowerPoint Templates Marketing Financial Planning Process PPT Slides-This circle chart can be used in business, education and economic presentations to help the audience visualize the content better, or to find flaws in a financial planning process.-Business Circle Charts PowerPoint Templates Marketing Financial Planning Process PPT Slides-This template can be used for presentations relating to Abstract, Action, Business, Chart, Commerce, Competitor, Components, Concept, Conceptual, Design, Diagram, Executive, Financial, Goals, Guide, Guidelines, Hierarchy, Icon, Idea, Illustration, Manage, Management, Marketing, Mind, Mission, Model, Operations, Organization, Performance, Plan, Planning, Process
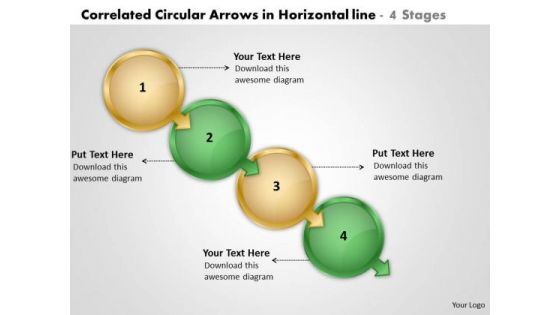
Correlated Circular Arrows In Horizontal Line 4 Stages Create Flow Charts PowerPoint Slides
We present our correlated circular arrows in horizontal line 4 stages create flow charts PowerPoint Slides.Use our Circle Charts PowerPoint Templates because,Motivating your team will cross all barriers. Use our Arrows PowerPoint Templates because,The foundation stones of many a life. Use our Leadership PowerPoint Templates because, You can Show them how to churn out fresh ideas. Use our Business PowerPoint Templates because, You have had your share of being a goldfish in a small bowl.You are ready to launch out and spread your wings Use our Process and Flows PowerPoint Templates because, It can illustrate your chain of ideas focusing on that aspect or resource in order to enhance the quality of your product.Use these PowerPoint slides for presentations relating to 3d, abstract, around, arrows, blue, border, business, center, circle, circular, concept, connections, copy, curve, cycle, directions, distribution, illustration, management, middle, objects, pieces, plan, pointing, process, recycle, rounded, shadows, space, system. The prominent colors used in the PowerPoint template are Yellow, Green, Black. People tell us our correlated circular arrows in horizontal line 4 stages create flow charts PowerPoint Slides will get their audience's attention. The feedback we get is that our circle PowerPoint templates and PPT Slides are Charming. People tell us our correlated circular arrows in horizontal line 4 stages create flow charts PowerPoint Slides are Graceful. Presenters tell us our circle PowerPoint templates and PPT Slides will make you look like a winner. The feedback we get is that our correlated circular arrows in horizontal line 4 stages create flow charts PowerPoint Slides are Romantic. Professionals tell us our around PowerPoint templates and PPT Slides are Adorable.

Business Circle Charts PowerPoint Templates Business Financial Planning Process Ppt Slides
Business Circle Charts PowerPoint Templates Business Financial Planning Process PPT Slides-This PowerPoint diagram shows transformations from one stage to others stage of Financial Planning Process-Business Circle Charts PowerPoint Templates Business Financial Planning Process PPT Slides-This template can be used for presentations relating to Abstract, Action, Business, Chart, Commerce, Competitor, Components, Concept, Conceptual, Design, Diagram, Executive, Financial, Goals, Guide, Guidelines, Hierarchy, Icon, Idea, Illustration, Manage, Management, Marketing, Mind, Mission, Model, Operations, Organization, Performance, Plan, Planning, Process
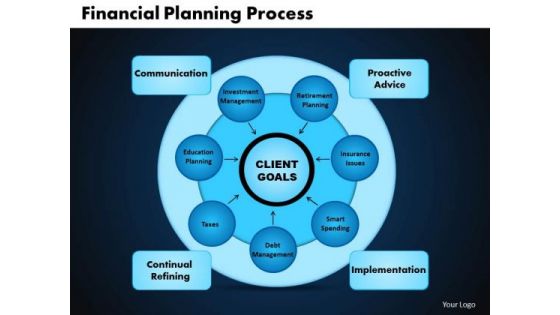
Business Circle Charts PowerPoint Templates Leadership Financial Planning Process Ppt Slides
Business Circle Charts PowerPoint Templates Leadership Financial Planning Process PPT Slides-This PowerPoint diagram shows transformations from one stage to others stage of Financial Planning Process-Business Circle Charts PowerPoint Templates Leadership Financial Planning Process PPT Slides-This template can be used for presentations relating to Abstract, Action, Business, Chart, Commerce, Competitor, Components, Concept, Conceptual, Design, Diagram, Executive, Financial, Goals, Guide, Guidelines, Hierarchy, Icon, Idea, Illustration, Manage, Management, Marketing, Mind, Mission, Model, Operations, Organization, Performance, Plan, Planning, Process

Venn Diagram Of Help Circle Charts PowerPoint Templates Ppt Backgrounds For Slides 1112
We present our Venn Diagram Of Help Circle Charts PowerPoint Templates PPT Backgrounds For Slides 1112.Download and present our Circle charts PowerPoint Templates because there are a bucketful of brilliant ideas swirling around within your group. Download our Venn diagrams PowerPoint Templates because you have an idea of which you are sure. Download our Business PowerPoint Templates because maximising sales of your product is the intended destination. Download and present our Education PowerPoint Templates because we all know Education is the foundation of growth in any endeavour. Use our Success PowerPoint Templates because iT outlines the entire thought process for the benefit of others. Tell it to the world with your characteristic aplomb.Use these PowerPoint slides for presentations relating to Venn diagram help others help yourself, circle charts, venn diagrams, business, education, success. The prominent colors used in the PowerPoint template are Green, Blue, Blue navy. People tell us our Venn Diagram Help Others Help Yourself Circle Charts PowerPoint Templates PPT Backgrounds For Slides 1112 are specially created by a professional team with vast experience. They diligently strive to come up with the right vehicle for your brilliant Ideas. Presenters tell us our charts PowerPoint templates and PPT Slides are Nostalgic. PowerPoint presentation experts tell us our Venn Diagram Help Others Help Yourself Circle Charts PowerPoint Templates PPT Backgrounds For Slides 1112 are Efficient. Customers tell us our charts PowerPoint templates and PPT Slides are Ritzy. Customers tell us our Venn Diagram Help Others Help Yourself Circle Charts PowerPoint Templates PPT Backgrounds For Slides 1112 are Awesome. Customers tell us our charts PowerPoint templates and PPT Slides are Stylish.
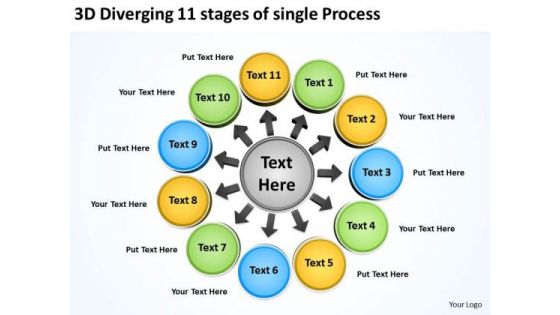
3d Diverging 11 Stages Of Single Process Ppt Charts And Diagrams PowerPoint Templates
We present our 3d diverging 11 stages of single process ppt Charts and Diagrams PowerPoint templates.Use our Circle Charts PowerPoint Templates because it is a step by step process with levels rising at every stage. Use our Arrows PowerPoint Templates because this PPt slide can educate your listeners on the relevance and importance of each one as per your plan and how they all contribute as you strive to hit the Bullseye. Download our Business PowerPoint Templates because The foundation of the structure of your business is resilient and dependable. Convey this confidence to your colleagues and assure them of a great and enduring future. Download our Shapes PowerPoint Templates because others naturally tend to follow in the path blazed by you. Present our Flow Charts PowerPoint Templates because our PowerPoint templates designed for your ideas to sell.Use these PowerPoint slides for presentations relating to advice, analysis, analyze, background, blank, business, center, central, chalk, component, concept, connection, core, counter, deploy, diagram, distribute, draw, education, element, exchange, flow, gather, industry, input, join, link, management, manager, output, people, person, plan, process, reaction, strategy, support, surround, teamwork. The prominent colors used in the PowerPoint template are Yellow, Green, Blue. Customers tell us our 3d diverging 11 stages of single process ppt Charts and Diagrams PowerPoint templates are Liberated. PowerPoint presentation experts tell us our analyze PowerPoint templates and PPT Slides are Ultra. People tell us our 3d diverging 11 stages of single process ppt Charts and Diagrams PowerPoint templates are topically designed to provide an attractive backdrop to any subject. People tell us our background PowerPoint templates and PPT Slides will help you be quick off the draw. Just enter your specific text and see your points hit home. Customers tell us our 3d diverging 11 stages of single process ppt Charts and Diagrams PowerPoint templates are Fashionable. People tell us our center PowerPoint templates and PPT Slides are Enchanting.
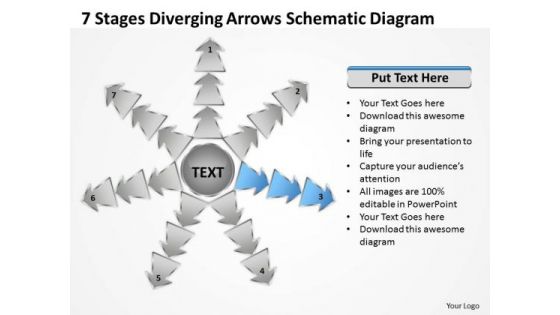
7 Stages Diverging Arrows Schematic Diagram Ppt Charts And Networks PowerPoint Slide
We present our 7 stages diverging arrows schematic diagram ppt Charts and Networks PowerPoint Slide.Use our Marketing PowerPoint Templates because you can Break it all down to Key Result Areas. Use our Shapes PowerPoint Templates because this diagram is designed to help your audience to develop their thoughts along the way. Use our Arrows PowerPoint Templates because this slide illuminates the spiritual brilliance of Jesus and showers the love for mankind he showed even while being crucified. Use our Business PowerPoint Templates because you can Lead your flock steadily to greater heights. Look around at the vast potential of achievement around you. Use our Process and Flows PowerPoint Templates because you can Highlight the key components of your entire manufacturing/ business process.Use these PowerPoint slides for presentations relating to Arrows, Business, Chart, Cyclic, Data, Diagram, Financial, Goal, Graph, Illustration, Info, Information, Marketing, Model, Option, Part, Pie, Presentation, Process, Result, Sphere, Statistics. The prominent colors used in the PowerPoint template are Blue, Gray, Black. The feedback we get is that our 7 stages diverging arrows schematic diagram ppt Charts and Networks PowerPoint Slide are Fashionable. People tell us our Data PowerPoint templates and PPT Slides are Perfect. Presenters tell us our 7 stages diverging arrows schematic diagram ppt Charts and Networks PowerPoint Slide will make the presenter successul in his career/life. Use our Goal PowerPoint templates and PPT Slides are Bold. Use our 7 stages diverging arrows schematic diagram ppt Charts and Networks PowerPoint Slide are Spiffy. Use our Financial PowerPoint templates and PPT Slides are Functional.

Business Circle Charts PowerPoint Templates Business Periodic Table Of Elements Ppt Slides
Business Circle Charts PowerPoint Templates Business periodic table of elements PPT Slides-Use this graphic to represent a continuing sequence of stages, tasks, or events in a circular flow and emphasize the connection between all components. -Business Circle Charts PowerPoint Templates Business periodic table of elements PPT Slides-This template can be used for presentations relating to Actinoids, Atom, Atomic, Chemistry, Electrons, Element, Helium, Hydrogen, Lanthanoids, Liquid, Molecule, Noble, Periodic, Physics, Plutonium, Quantum, Radium, Science, Scientific, Solid, Symbol, Table
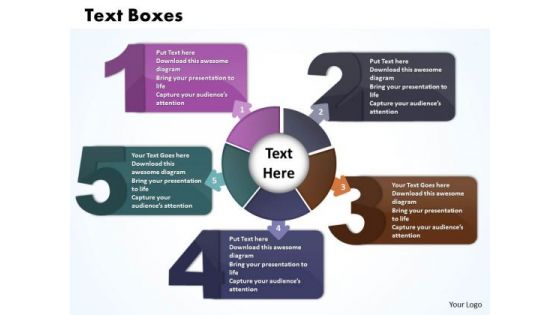
Business Charts PowerPoint Templates Five Text Boxes Connected With Circular Direction
Business Charts PowerPoint templates five text boxes connected with circular direction-Use this Circular Process with five text Boxes to represent a continuing sequence of stages, tasks, or events in a circular flow and emphasize the connection between all components. You can change color, size and orientation of any icon to your liking.-Business Charts PowerPoint templates five text boxes connected with circular direction
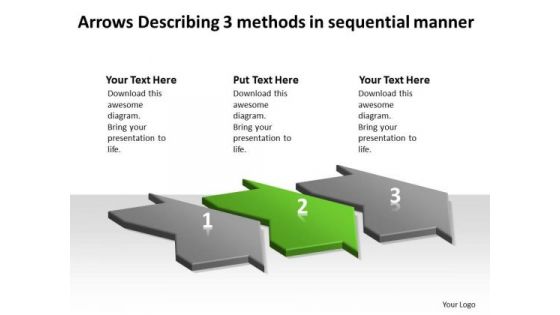
Arrows Describing 3 Methods Sequential Manner Flow Charts Vision PowerPoint Templates
We present our arrows describing 3 methods sequential manner flow charts vision PowerPoint templates.Present our Marketing PowerPoint Templates because they are Designed to attract the attention of your audience. Present our Business PowerPoint Templates because you have selected your team man for man. Download our Process and Flows PowerPoint Templates because you can Highlight the key components of your entire manufacturing/ business process. Use our Shapes PowerPoint Templates because clarity of thought has been the key to your growth. Download and present our Arrows PowerPoint Templates because you have an idea of which you are sure.Use these PowerPoint slides for presentations relating to 3d, Abstract, Around, Arrows, Blue, Border, Business, Center, Circle, Circular, Concept, Connections, Copy, Curve, Cycle, Directions, Distribution, Illustration, Management, Middle, Objects, Pieces, Plan, Pointing, Process, Recycle, Rounded, Shadows, Space, System. The prominent colors used in the PowerPoint template are Green, Gray, Black. People tell us our arrows describing 3 methods sequential manner flow charts vision PowerPoint templates are Wistful. PowerPoint presentation experts tell us our Center PowerPoint templates and PPT Slides are Beautiful. Presenters tell us our arrows describing 3 methods sequential manner flow charts vision PowerPoint templates are Vintage. The feedback we get is that our Arrows PowerPoint templates and PPT Slides are Ultra. You can be sure our arrows describing 3 methods sequential manner flow charts vision PowerPoint templates are One-of-a-kind. Professionals tell us our Circle PowerPoint templates and PPT Slides are Tasteful.
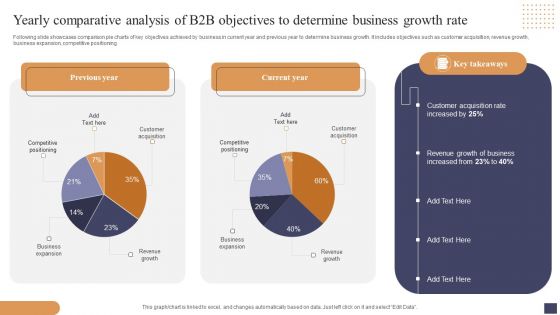
Yearly Comparative Analysis Of B2b Objectives To Determine Business Growth Rate Mockup PDF
Following slide showcases comparison pie charts of key objectives achieved by business in current year and previous year to determine business growth. It includes objectives such as customer acquisition, revenue growth, business expansion, competitive positioning. Showcasing this set of slides titled Yearly Comparative Analysis Of B2b Objectives To Determine Business Growth Rate Mockup PDF. The topics addressed in these templates are Customer Acquisition, Revenue Growth Business, Business Expansion. All the content presented in this PPT design is completely editable. Download it and make adjustments in color, background, font etc. as per your unique business setting.
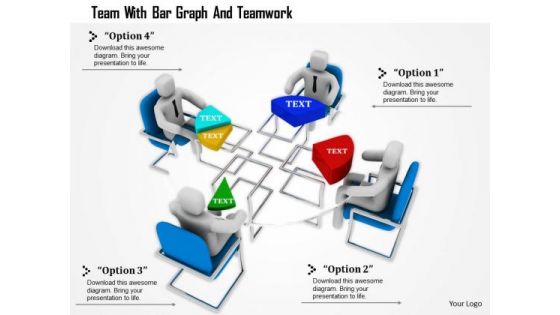
Team With Bar Graph And Teamwork
This Power Point template has been designed with graphic of 3d team forming a pie chart. In this slide team is displaying data analysis and comparison. Use this editable slide to build innovative presentation for your viewers.
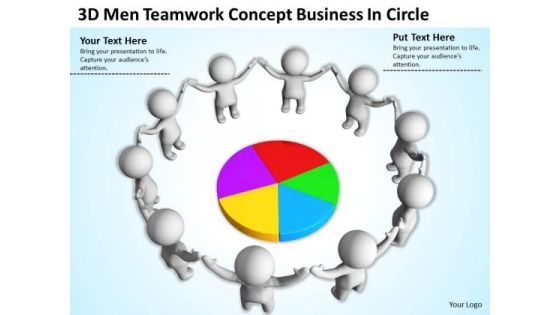
Pictures Of Business Men Concept PowerPoint Presentation Circle Slides
We present our pictures of business men concept powerpoint presentation circle Slides.Download our Business PowerPoint Templates because You have gained great respect for your brilliant ideas. Use our PowerPoint Templates and Slides to strengthen and enhance your reputation. Present our Teamwork PowerPoint Templates because Our PowerPoint Templates and Slides are created by a hardworking bunch of busybees. Always flitting around with solutions gauranteed to please. Present our Pie Charts PowerPoint Templates because Our PowerPoint Templates and Slides provide you with a vast range of viable options. Select the appropriate ones and just fill in your text. Download our Marketing PowerPoint Templates because You can Be the puppeteer with our PowerPoint Templates and Slides as your strings. Lead your team through the steps of your script. Download our Success PowerPoint Templates because Our PowerPoint Templates and Slides are created with admirable insight. Use them and give your group a sense of your logical mind.Use these PowerPoint slides for presentations relating to 3d, accounting, achievement, business, businesspeople, chart, communication, company, comparison, corporate, diagram, earn, forecast, future, gain, graph, graphic, group, grow, growth, guy, human, investment, isolated, office, people, progress, sign, small, staff, stat, success, symbol, team, teamwork, together, up, wealth, work . The prominent colors used in the PowerPoint template are Purple, Red, Yellow.

Engage Customers Ppt PowerPoint Presentation Summary Portrait
This is a business structure comparison chart ppt powerpoint presentation infographic template vector. This is a three stage process. The stages in this process are business structure comparison chart.
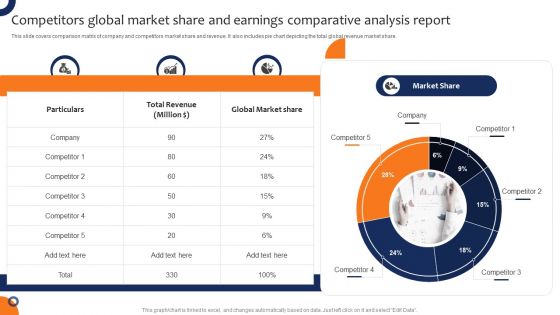
Competitors Global Market Share And Earnings Comparative Analysis Report Slides PDF
This slide covers comparison matrix of company and competitors market share and revenue. It also includes pie chart depicting the total global revenue market share. Showcasing this set of slides titled Competitors Global Market Share And Earnings Comparative Analysis Report Slides PDF. The topics addressed in these templates are Revenue, Global Market Share, Earnings Comparative Analysis Report. All the content presented in this PPT design is completely editable. Download it and make adjustments in color, background, font etc. as per your unique business setting.
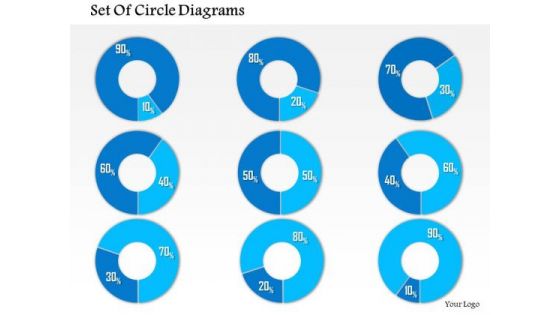
Business Framework 10 Percent To 90 Percent PowerPoint Presentation
This business diagram has been designed with graphic of multiple pie graphs. This diagram slide contains the concept of result analysis with percentage values. Use this diagram to present and compare data in an impressive manner
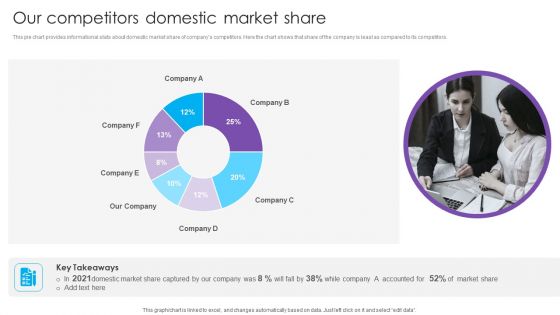
Our Competitors Domestic Market Share Real Estate Project Funding Brochure PDF
This pie chart provides informational stats about domestic market share of companys competitors. Here the chart shows that share of the company is least as compared to its competitors.Deliver an awe inspiring pitch with this creative Our Competitors Domestic Market Share Real Estate Project Funding Brochure PDF bundle. Topics like Domestic Market, Captured Company, Accounted Market can be discussed with this completely editable template. It is available for immediate download depending on the needs and requirements of the user.

Capital Investment Options Our Competitors Domestic Market Share Slides PDF
This pie chart provides informational stats about domestic market share of companys competitors. Here the chart shows that share of the company is least as compared to its competitors. Deliver an awe inspiring pitch with this creative Capital Investment Options Our Competitors Domestic Market Share Slides PDF bundle. Topics like Domestic, Market Share can be discussed with this completely editable template. It is available for immediate download depending on the needs and requirements of the user.

Components Of Integrated Solid Waste Administration In Municipal Corporation Structure PDF
This slide shows the pie chart representing the elements of management of solid waste in municipal corporation. It includes waste in the form of glass, rags, plastic, metals etc. Showcasing this set of slides titled Components Of Integrated Solid Waste Administration In Municipal Corporation Structure PDF. The topics addressed in these templates are Integrated, Administration, Corporation. All the content presented in this PPT design is completely editable. Download it and make adjustments in color, background, font etc. as per your unique business setting.

Term Life Insurance Analytics Plan Claims Dashboard Structure PDF
This slide illustrates claim status of life insurance corporation. It includes yearly claim status pie chart, total claims quarter-wise and total closed claims quarter wise. Pitch your topic with ease and precision using this Term Life Insurance Analytics Plan Claims Dashboard Structure PDF. This layout presents information on Insurance Analytics, Plan Claims Dashboard. It is also available for immediate download and adjustment. So, changes can be made in the color, design, graphics or any other component to create a unique layout.
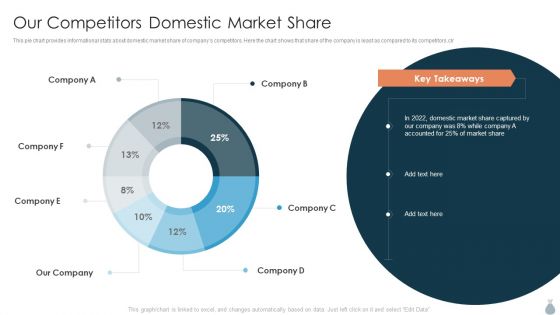
Real Estate Development Project Financing Our Competitors Domestic Market Share Elements PDF
This pie chart provides informational stats about domestic market share of companys competitors. Here the chart shows that share of the company is least as compared to its competitors.Deliver and pitch your topic in the best possible manner with this Real Estate Development Project Financing Our Competitors Domestic Market Share Elements PDF. Use them to share invaluable insights on Key Takeaways, Domestic Market, Company Accounted and impress your audience. This template can be altered and modified as per your expectations. So, grab it now.

Real Estate Developers Funding Alternatives Our Competitors Domestic Market Share Rules PDF
This pie chart provides informational stats about domestic market share of companys competitors. Here the chart shows that share of the company is least as compared to its competitors. Deliver and pitch your topic in the best possible manner with this Real Estate Developers Funding Alternatives Our Competitors Domestic Market Share Rules PDF. Use them to share invaluable insights on Our Competitors Domestic, Market Share and impress your audience. This template can be altered and modified as per your expectations. So, grab it now.
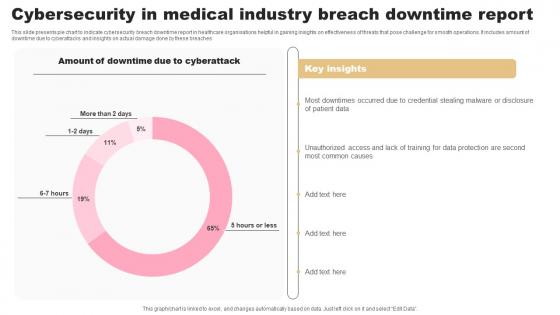
Cybersecurity In Medical Industry Breach Downtime Report Designs Pdf
This slide presents pie chart to indicate cybersecurity breach downtime report in healthcare organisations helpful in gaining insights on effectiveness of threats that pose challenge for smooth operations. It includes amount of downtime due to cyberattacks and insights on actual damage done by these breaches Pitch your topic with ease and precision using this Cybersecurity In Medical Industry Breach Downtime Report Designs Pdf. This layout presents information on Cyberattack, Insights, Report. It is also available for immediate download and adjustment. So, changes can be made in the color, design, graphics or any other component to create a unique layout.
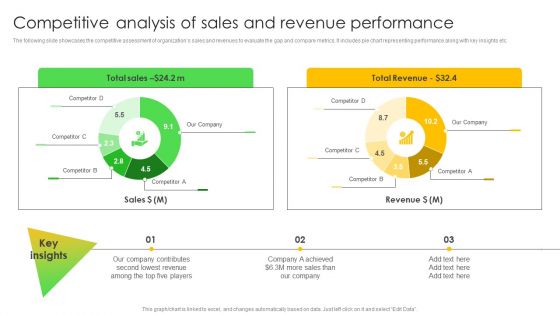
Competitive Analysis Of Sales And Revenue Performance Information PDF
The following slide showcases the competitive assessment of organizations sales and revenues to evaluate the gap and compare metrics. It includes pie chart representing performance along with key insights etc. Slidegeeks is one of the best resources for PowerPoint templates. You can download easily and regulate Competitive Analysis Of Sales And Revenue Performance Information PDF for your personal presentations from our wonderful collection. A few clicks is all it takes to discover and get the most relevant and appropriate templates. Use our Templates to add a unique zing and appeal to your presentation and meetings. All the slides are easy to edit and you can use them even for advertisement purposes.
Competitive Analysis Of Sales And Revenue Performance Elements PDF
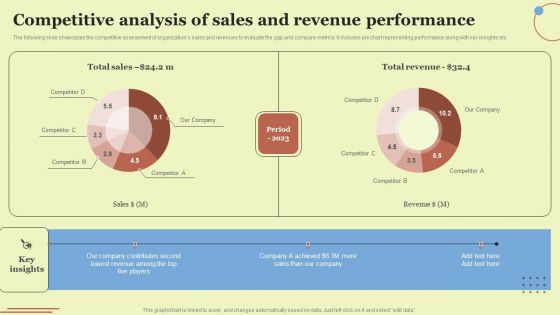
The following slide showcases the competitive assessment of organizations sales and revenues to evaluate the gap and compare metrics. It includes pie chart representing performance along with key insights etc. Take your projects to the next level with our ultimate collection of Competitive Analysis Of Sales And Revenue Performance Elements PDF. Slidegeeks has designed a range of layouts that are perfect for representing task or activity duration, keeping track of all your deadlines at a glance. Tailor these designs to your exact needs and give them a truly corporate look with your own brand colors they will make your projects stand out from the rest.
Competitive Analysis Of Sales And Revenue Performance Designs PDF
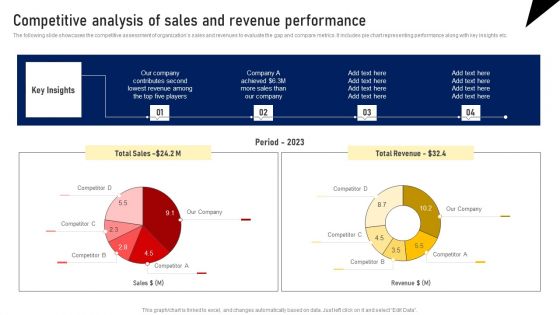
The following slide showcases the competitive assessment of organizations sales and revenues to evaluate the gap and compare metrics. It includes pie chart representing performance along with key insights etc. Take your projects to the next level with our ultimate collection of Competitive Analysis Of Sales And Revenue Performance Designs PDF. Slidegeeks has designed a range of layouts that are perfect for representing task or activity duration, keeping track of all your deadlines at a glance. Tailor these designs to your exact needs and give them a truly corporate look with your own brand colors they will make your projects stand out from the rest.

Mitigating Sales Risks With Strategic Action Planning Competitive Analysis Of Sales And Revenue Performance Slides PDF
The following slide showcases the competitive assessment of organizations sales and revenues to evaluate the gap and compare metrics. It includes pie chart representing performance along with key insights etc. Find a pre designed and impeccable Mitigating Sales Risks With Strategic Action Planning Competitive Analysis Of Sales And Revenue Performance Slides PDF. The templates can ace your presentation without additional effort. You can download these easy to edit presentation templates to make your presentation stand out from others. So, what are you waiting for Download the template from Slidegeeks today and give a unique touch to your presentation.
Executing Sales Risk Reduction Plan Competitive Analysis Of Sales And Revenue Performance Diagrams PDF
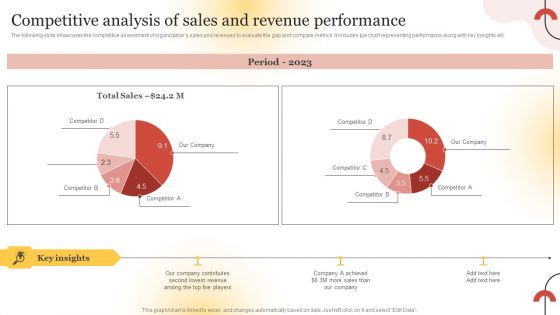
The following slide showcases the competitive assessment of organizations sales and revenues to evaluate the gap and compare metrics. It includes pie chart representing performance along with key insights etc. Take your projects to the next level with our ultimate collection of Executing Sales Risk Reduction Plan Competitive Analysis Of Sales And Revenue Performance Diagrams PDF. Slidegeeks has designed a range of layouts that are perfect for representing task or activity duration, keeping track of all your deadlines at a glance. Tailor these designs to your exact needs and give them a truly corporate look with your own brand colors they will make your projects stand out from the rest.

Determining Risks In Sales Administration Procedure Competitive Analysis Of Sales And Revenue Introduction PDF
The following slide showcases the competitive assessment of organizations sales and revenues to evaluate the gap and compare metrics. It includes pie chart representing performance along with key insights etc. Make sure to capture your audiences attention in your business displays with our gratis customizable Determining Risks In Sales Administration Procedure Competitive Analysis Of Sales And Revenue Introduction PDF. These are great for business strategies, office conferences, capital raising or task suggestions. If you desire to acquire more customers for your tech business and ensure they stay satisfied, create your own sales presentation with these plain slides.
Customer Service Request Tickets Administration Dashboard Icons PDF
This slide covers division of tickets into different groups. It also includes a pie chart dividing tickets in multiple categories such as status, tech groups, alert level, request type and alert condition. Pitch your topic with ease and precision using this Customer Service Request Tickets Administration Dashboard Icons PDF. This layout presents information on Tickets Activity, Tickets Alert Level, Tickets Teach Group. It is also available for immediate download and adjustment. So, changes can be made in the color, design, graphics or any other component to create a unique layout.
Support Center Report On Customer Executive Performance Evaluation Background PDF
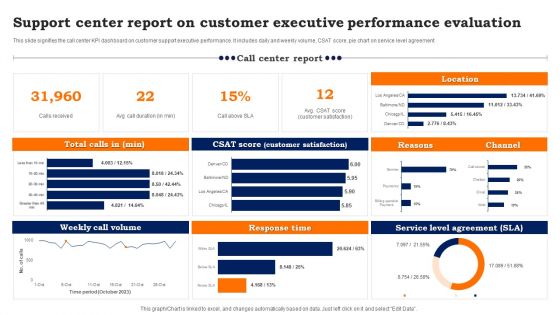
This slide signifies the call center KPI dashboard on customer support executive performance. It includes daily and weekly volume, CSAT score, pie chart on service level agreement. Pitch your topic with ease and precision using this Support Center Report On Customer Executive Performance Evaluation Background PDF. This layout presents information on Weekly Call Volume, Response Time, Service Level Agreement. It is also available for immediate download and adjustment. So, changes can be made in the color, design, graphics or any other component to create a unique layout.

Software Development Project Weekly Status Update Summary Document Inspiration PDF
This slide represents a dashboard showing the weekly status of the software development projects of the IT department. It represents pie chart showing failed login rate, status of projects and aborted connects. Pitch your topic with ease and precision using this Software Development Project Weekly Status Update Summary Document Inspiration PDF. This layout presents information on High Failed, Login Rate, Abort Connects, Failed Login. It is also available for immediate download and adjustment. So, changes can be made in the color, design, graphics or any other component to create a unique layout.
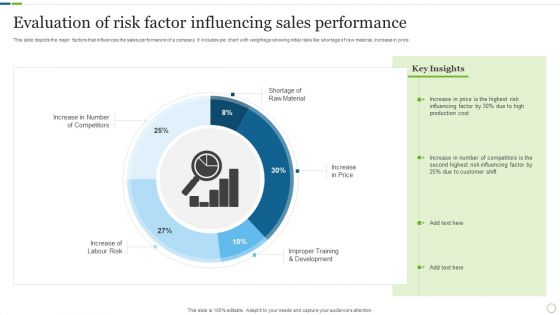
Evaluation Of Risk Factor Influencing Sales Performance Inspiration PDF
This slide depicts the major factors that influences the sales performance of a company. It includes pie chart with weightage showing initial risks like shortage of raw material, increase in price. Pitch your topic with ease and precision using this Evaluation Of Risk Factor Influencing Sales Performance Inspiration PDF. This layout presents information on Production Cost, Customer Shift, Risk Influencing. It is also available for immediate download and adjustment. So, changes can be made in the color, design, graphics or any other component to create a unique layout.

Support Center Report With Activity And Statistics Guidelines PDF
This slide signifies the report on call centre with activities and statistics. It includes agent activity sum, pie chart based on group calls, abandonment rate, service level and average queue time. Pitch your topic with ease and precision using this Support Center Report With Activity And Statistics Guidelines PDF. This layout presents information on Support Center Report, Activity And Statistics. It is also available for immediate download and adjustment. So, changes can be made in the color, design, graphics or any other component to create a unique layout.

Overview Of Site Survey Results Survey SS
Following slide shows the complete overview of survey in graphs and pie charts which assist in setting future trends. It basically shows the result of website visitors, overall website rating, etc. Pitch your topic with ease and precision using this Overview Of Site Survey Results Survey SS. This layout presents information on Overview, Site Survey Results. It is also available for immediate download and adjustment. So, changes can be made in the color, design, graphics or any other component to create a unique layout.
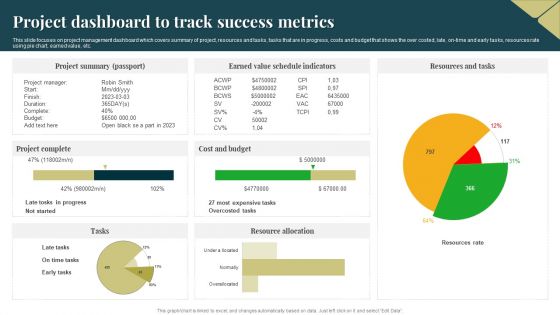
Project Dashboard To Track Success Metrics Background PDF
This slide focuses on project management dashboard which covers summary of project, resources and tasks, tasks that are in progress, costs and budget that shows the over costed, late, on time and early tasks, resources rate using pie chart, earned value, etc. Pitch your topic with ease and precision using this Project Dashboard To Track Success Metrics Background PDF. This layout presents information on Cost And Budget, Project Summary, Resource Allocation. It is also available for immediate download and adjustment. So, changes can be made in the color, design, graphics or any other component to create a unique layout.

Assessing Sales Risks Competitive Analysis Of Sales And Revenue Performance Clipart PDF
The following slide showcases the competitive assessment of organizations sales and revenues to evaluate the gap and compare metrics. It includes pie chart representing performance along with key insights etc. Present like a pro with Assessing Sales Risks Competitive Analysis Of Sales And Revenue Performance Clipart PDF Create beautiful presentations together with your team, using our easy-to-use presentation slides. Share your ideas in real-time and make changes on the fly by downloading our templates. So whether you are in the office, on the go, or in a remote location, you can stay in sync with your team and present your ideas with confidence. With Slidegeeks presentation got a whole lot easier. Grab these presentations today.

 Home
Home