Percentage Progress
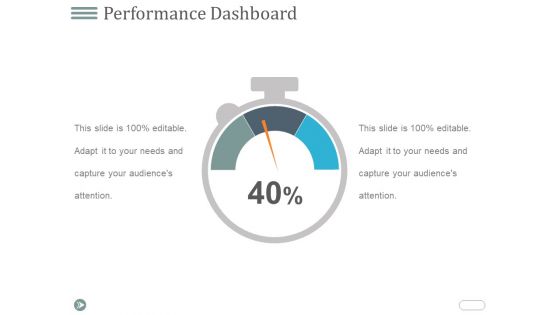
Performance Dashboard Ppt PowerPoint Presentation Visual Aids Example 2015
This is a performance dashboard ppt powerpoint presentation visual aids example 2015. This is a one stage process. The stages in this process are dashboard, percentage, business, marketing, strategy.

Clustered Column Ppt PowerPoint Presentation File Slide
This is a clustered column ppt powerpoint presentation file slide. This is a two stage process. The stages in this process are product, financial year, sales in percentage, bar graph.
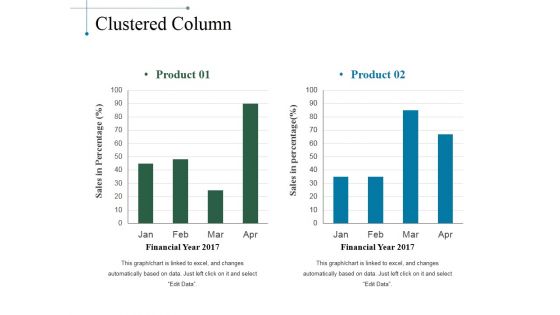
Clustered Column Ppt PowerPoint Presentation Slides Smartart
This is a clustered column ppt powerpoint presentation slides smartart. This is a two stage process. The stages in this process are product, sales in percentage, financial year, bar graph.

Stacked Area Clustered Column Ppt PowerPoint Presentation Styles Background Image
This is a stacked area clustered column ppt powerpoint presentation styles background image. This is a three stage process. The stages in this process are in percentage, graph, business, marketing, finance.
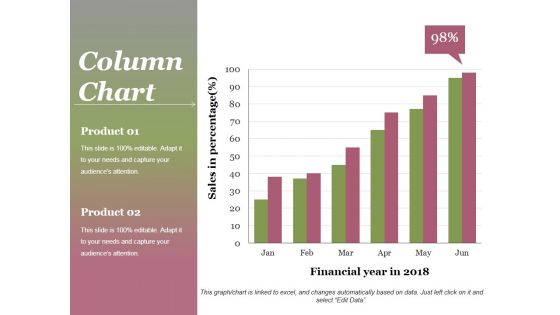
Column Chart Ppt PowerPoint Presentation Gallery Background
This is a column chart ppt powerpoint presentation gallery background. This is a two stage process. The stages in this process are product, sales in percentage, financial year, graph, success.

Line Chart Ppt PowerPoint Presentation Slides Graphics Tutorials
This is a line chart ppt powerpoint presentation slides graphics tutorials. This is a two stage process. The stages in this process are product, in millions, line chart, percentage, finance.
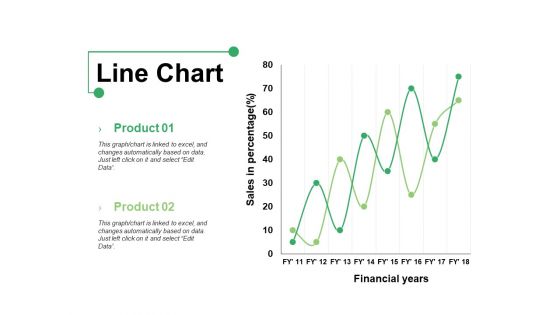
Line Chart Ppt PowerPoint Presentation Show Graphics Example
This is a line chart ppt powerpoint presentation show graphics example. This is a two stage process. The stages in this process are product, line chart, financial years, sales in percentage.

Column Chart Ppt PowerPoint Presentation Layouts Vector
This is a column chart ppt powerpoint presentation layouts vector. This is a two stage process. The stages in this process are product, column chart, bar graph, percentage, finance.

Line Chart Ppt PowerPoint Presentation Professional Grid
This is a line chart ppt powerpoint presentation professional grid. This is a two stage process. The stages in this process are sales in percentage, financial years, product, line chart.

Line Chart Ppt PowerPoint Presentation Ideas Elements
This is a line chart ppt powerpoint presentation ideas elements. This is a two stage process. The stages in this process are product, sales in percentage, financial year, business, line chart.

Stacked Area Clustered Column Ppt PowerPoint Presentation Gallery Gridlines
This is a stacked area clustered column ppt powerpoint presentation gallery gridlines. This is a three stage process. The stages in this process are bar graph, product, in percentage.
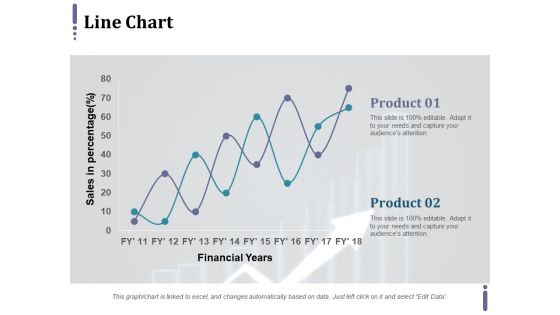
Line Chart Ppt PowerPoint Presentation Infographic Template Master Slide
This is a line chart ppt powerpoint presentation infographic template master slide. This is a two stage process. The stages in this process are product, financial years, sales in percentage.

Stacked Area Clustered Column Ppt PowerPoint Presentation Outline Diagrams
This is a stacked area clustered column ppt powerpoint presentation outline diagrams. This is a three stage process. The stages in this process are product, in percentage, area chart.
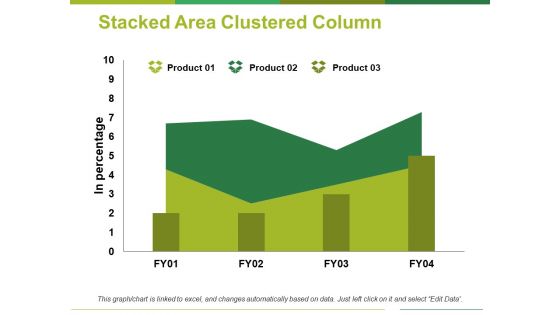
Stacked Area Clustered Column Ppt PowerPoint Presentation Professional Clipart
This is a stacked area clustered column ppt powerpoint presentation professional clipart. This is a three stage process. The stages in this process are product, in percentage, area chart.

Clustered Column Ppt PowerPoint Presentation Infographic Template Backgrounds
This is a clustered column ppt powerpoint presentation infographic template backgrounds. This is a two stage process. The stages in this process are sales in percentage, financial year, product.

Scatter Line Ppt PowerPoint Presentation Infographics Background Images
This is a scatter line ppt powerpoint presentation infographics background images. This is a one stage process. The stages in this process are dollar in millions, product, sales in percentage.

Stacked Area Clustered Column Ppt PowerPoint Presentation Summary Slides
This is a stacked area clustered column ppt powerpoint presentation summary slides. This is a three stage process. The stages in this process are product, in percentage, financial year, bar graph.
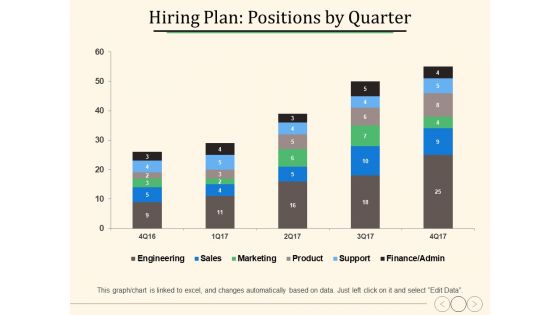
Hiring Plan Positions By Quarter Ppt PowerPoint Presentation Slides Deck
This is a hiring plan positions by quarter ppt powerpoint presentation slides deck. This is a five stage process. The stages in this process are percentage, product, business, management.

Bar Graph Product Ppt PowerPoint Presentation Model Graphic Tips
This is a bar graph product ppt powerpoint presentation model graphic tips. This is a three stage process. The stages in this process are product, percentage, business, management, marketing.
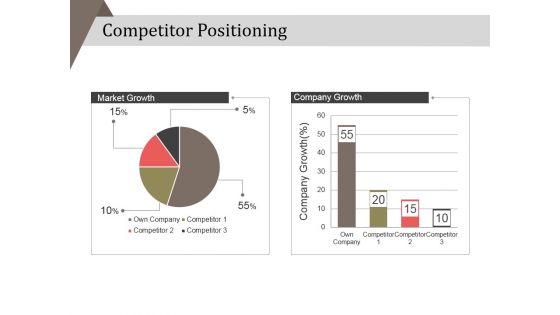
Competitor Positioning Ppt PowerPoint Presentation Professional Picture
This is a competitor positioning ppt powerpoint presentation professional picture. This is a two stage process. The stages in this process are company growth, percentage, market growth , business.
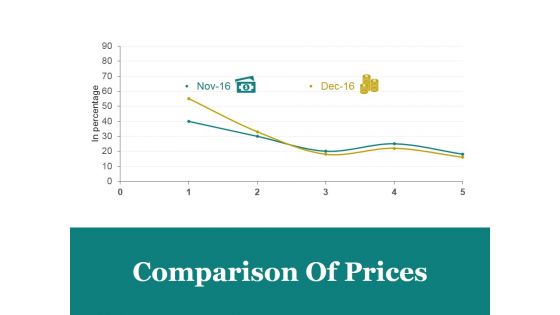
Comparison Of Prices Ppt PowerPoint Presentation Designs Download
This is a comparison of prices ppt powerpoint presentation designs download. This is a two stage process. The stages in this process are comparison of prices, marketing, in percentage, bar graph, business.
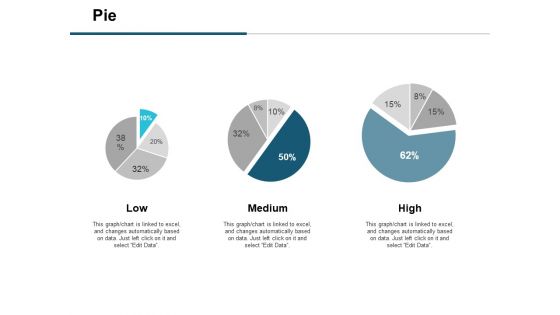
Pie Financial Ppt PowerPoint Presentation Infographics Master Slide
This is a pie financial ppt powerpoint presentation infographics master slide. This is a three stage process. The stages in this process are business strategy, marketing, management, percentage, pie, financial.
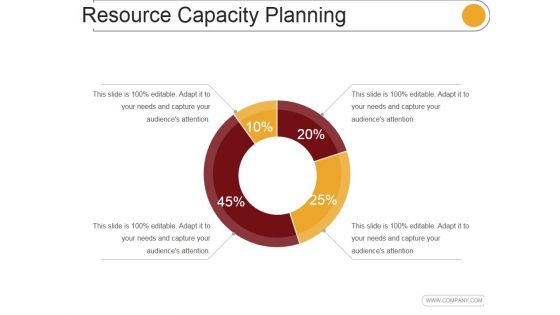
Resource Capacity Planning Template 2 Ppt PowerPoint Presentation Show
This is a resource capacity planning template 2 ppt powerpoint presentation show. This is a four stage process. The stages in this process are percentage, finance, donut, growth, success.
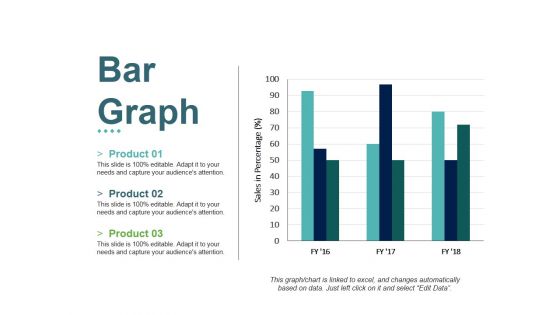
Bar Graph Ppt PowerPoint Presentation File Slides
This is a bar graph ppt powerpoint presentation file slides. This is a three stage process. The stages in this process are product, sales in percentage, bar graph, growth, success.
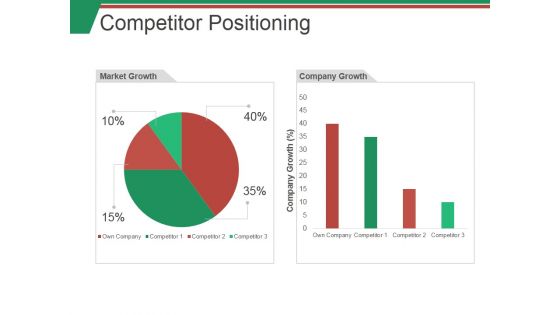
Competitor Positioning Ppt PowerPoint Presentation Show Example Introduction
This is a competitor positioning ppt powerpoint presentation show example introduction. This is a two stage process. The stages in this process are market growth, company growth, business, finance, percentage.
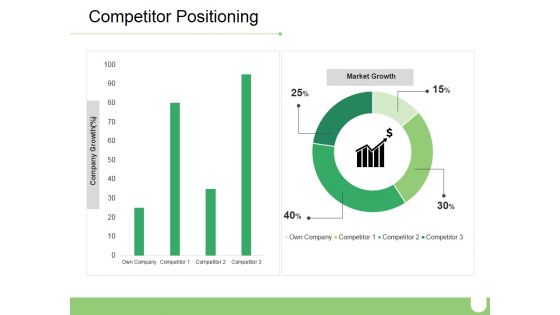
Competitor Positioning Ppt PowerPoint Presentation Gallery Portrait
This is a competitor positioning ppt powerpoint presentation gallery portrait. This is a two stage process. The stages in this process are company growth, market growth, business, marketing, percentage.

Big Data Opportunities And Challenges In Construction Ppt PowerPoint Presentation Outline
This is a big data opportunities and challenges in construction ppt powerpoint presentation outline. This is a three stage process. The stages in this process are finance, management, growth, percentage, business.

Portfolio Evaluation Template 2 Ppt PowerPoint Presentation Inspiration Information
This is a portfolio evaluation template 2 ppt powerpoint presentation inspiration information. This is a five stage process. The stages in this process are pie, finance, percentage, business, growth.

Clustered Column Line Ppt PowerPoint Presentation Slide
This is a clustered column line ppt powerpoint presentation slide. This is a three stage process. The stages in this process are bar graph, growth, finance, product, sales in percentage.

PowerPoint Design Slides Circular Process Business Ppt Backgrounds
PowerPoint Design Slides Circular Process Business PPT Backgrounds-This PowerPoint slide has circular process chart divided two parts that can be used for comparison. You can easily edit the size, percentage, text and color.-PowerPoint Design Slides Circular Process Business PPT Backgrounds

Prospective Sources Of Profit Generation Ppt Example 2015
This is a prospective sources of profit generation ppt example 2015. This is a five stage process. The stages in this process are finance, success, business, marketing, percentage, pie.
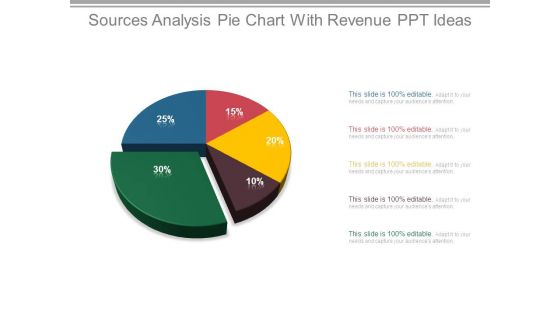
Sources Analysis Pie Chart With Revenue Ppt Ideas
This is a sources analysis pie chart with revenue ppt ideas. This is a five stage process. The stages in this process are finance, success, business, marketing, percentage, pie chart.

Sources Of Revenue Segmentation Powerpoint Slide Presentation Examples
This is a sources of revenue segmentation powerpoint slide presentation examples. This is a five stage process. The stages in this process are finance, success, business, marketing, percentage, pie chart.
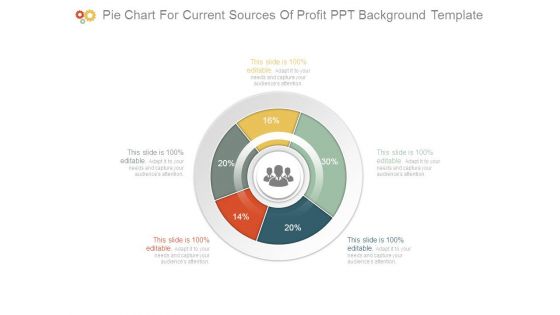
Pie Chart For Current Sources Of Profit Ppt Background Template
This is a pie chart for current sources of profit ppt background template. This is a five stage process. The stages in this process are finance, success, business, marketing, percentage, donut.
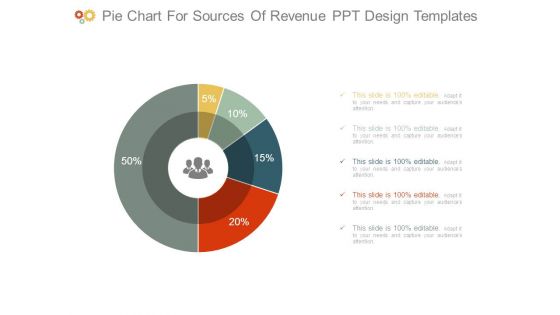
Pie Chart For Sources Of Revenue Ppt Design Templates
This is a pie chart for sources of revenue ppt design templates. This is a five stage process. The stages in this process are finance, success, business, marketing, percentage, donut.
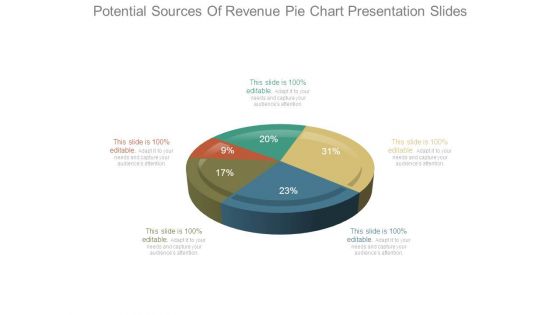
Potential Sources Of Revenue Pie Chart Presentation Slides
This is a potential sources of revenue pie chart presentation slides. This is a five stage process. The stages in this process are finance, success, business, marketing, percentage, pie.

Market Share Of Competitors Ppt PowerPoint Presentation Slides
This is a market share of competitors ppt powerpoint presentation slides. This is a six stage process. The stages in this process are market share in, competitor, pie, finance, percentage.

Meet Our Awesome Team Ppt PowerPoint Presentation Styles Graphics Design
This is a meet our awesome team ppt powerpoint presentation styles graphics design. This is a one stage process. The stages in this process are strategy, management, finance, business, percentage.
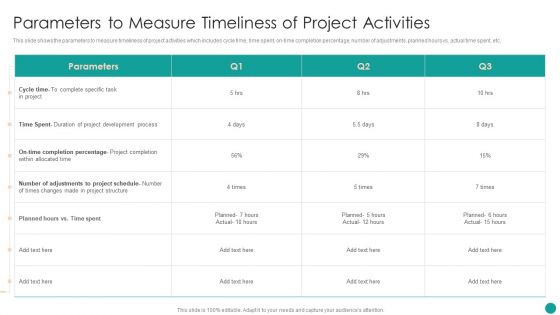
Time Management Techniques For Successful Project Parameters To Measure Timeliness Diagrams PDF
This slide shows the parameters to measure timeliness of project activities which includes cycle time, time spent, on-time completion percentage, number of adjustments, planned hours vs. actual time spent, etc.Deliver an awe inspiring pitch with this creative Time Management Techniques For Successful Project Parameters To Measure Timeliness Diagrams PDF bundle. Topics like Development Process, Completion Percentage, Adjustments Project can be discussed with this completely editable template. It is available for immediate download depending on the needs and requirements of the user.

Magnifying Glass For Sales Performance Review Ppt PowerPoint Presentation Model
This is a magnifying glass for sales performance review ppt powerpoint presentation model. This is a four stage process. The stage in this process are magnifier glass, pie, finance, percentage, research.

Stacked Bar Ppt PowerPoint Presentation Infographics Graphics
This is a stacked bar ppt powerpoint presentation infographics graphics. This is a four stage process. The stages in this process are business, strategy, marketing, success, unit count, in percentage.
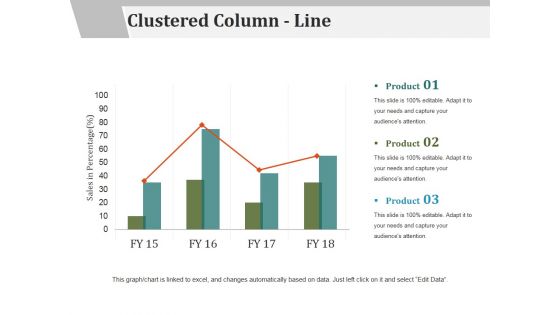
Clustered Column Line Ppt PowerPoint Presentation File Examples
This is a clustered column line ppt powerpoint presentation file examples. This is a three stage process. The stages in this process are sales in percentage, product, business, marketing, success.

Line Chart Ppt PowerPoint Presentation Outline Samples
This is a line chart ppt powerpoint presentation outline samples. This is a two stage process. The stages in this process are sales in percentage, product, business, marketing, success.
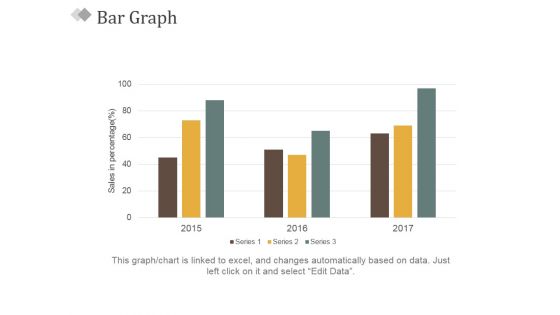
Bar Graph Ppt PowerPoint Presentation Slides Visual Aids
This is a bar graph ppt powerpoint presentation slides visual aids. This is a three stage process. The stages in this process are sales in percentage, bar graph, business, marketing, success.
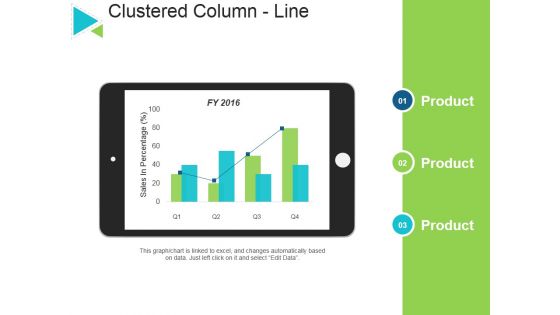
Clustered Column Line Ppt PowerPoint Presentation Outline Infographic Template
This is a clustered column line ppt powerpoint presentation outline infographic template. This is a three stage process. The stages in this process are product, sales in percentage, business, marketing, success.

Funding Updates Equity Ppt PowerPoint Presentation Outline Gridlines
This is a funding updates equity ppt powerpoint presentation outline gridlines. This is a one stage process. The stages in this process are shareholding pattern, percentage, business, marketing, success.
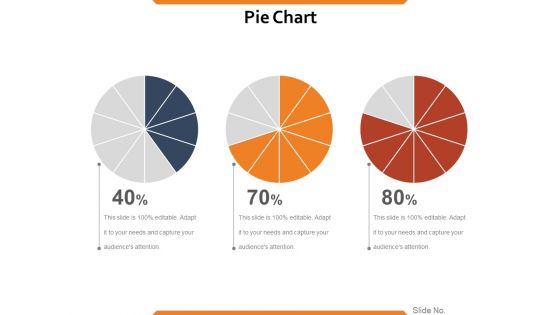
Pie Chart Ppt PowerPoint Presentation Infographics Show
This is a pie chart ppt powerpoint presentation infographics show. This is a three stage process. The stages in this process are process, percentage, business, marketing, success, pie chart.
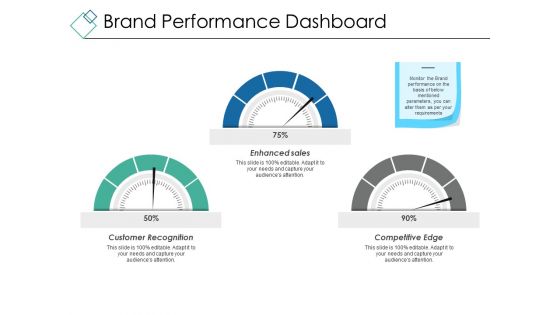
Brand Performance Dashboard Ppt PowerPoint Presentation Show Graphic Tips
This is a brand performance dashboard ppt powerpoint presentation show graphic tips. This is a three stage process. The stages in this process are customer recognition, enhanced sales, competitive edge, dashboard, business, percentage.
Funding Request And Use Of Funds Template 1 Ppt PowerPoint Presentation Icon Background
This is a funding request and use of funds template 1 ppt powerpoint presentation icon background. This is a three stage process. The stages in this process are key hires, marketing, product development, percentage, process.
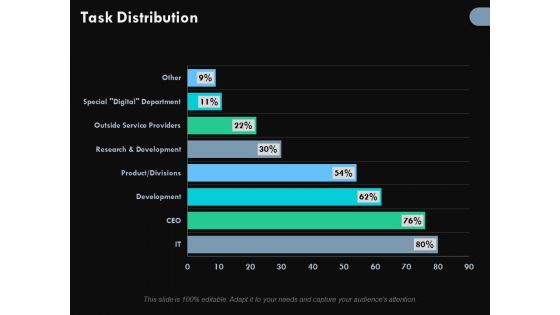
Task Distribution Ppt PowerPoint Presentation Design Ideas
This is a task distribution ppt powerpoint presentation design ideas. This is a eight stage process. The stages in this process are outside service providers, research and development, product, divisions, percentage.
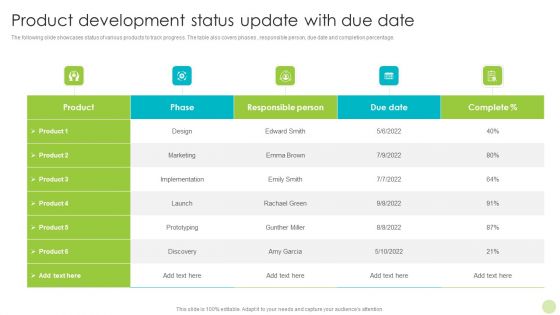
Product Development Status Update With Due Date Graphics PDF
The following slide showcases status of various products to track progress. The table also covers phases , responsible person, due date and completion percentage. Pitch your topic with ease and precision using this Product Development Status Update With Due Date Graphics PDF. This layout presents information on Design, Implementation, Marketing. It is also available for immediate download and adjustment. So, changes can be made in the color, design, graphics or any other component to create a unique layout.
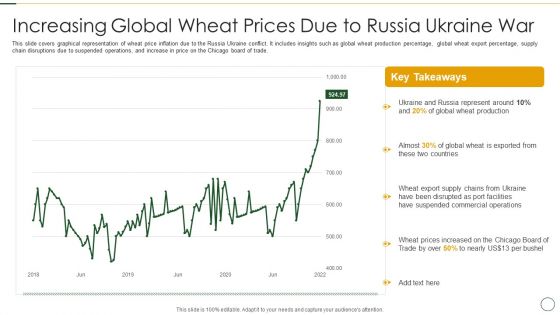
Analyzing The Impact Of Russia Ukraine Conflict On Agriculture Sector Increasing Global Wheat Professional PDF
This slide covers graphical representation of wheat price inflation due to the Russia Ukraine conflict. It includes insights such as global wheat production percentage, global wheat export percentage, supply chain disruptions due to suspended operations, and increase in price on the Chicago board of trade. Deliver an awe inspiring pitch with this creative analyzing the impact of russia ukraine conflict on agriculture sector increasing global wheat professional pdf bundle. Topics like russia represent around, global wheat production, suspended commercial operations can be discussed with this completely editable template. It is available for immediate download depending on the needs and requirements of the user.

Lead Metrics To Track And Measure Product Success Ppt Visual Aids Ideas Pdf
This slide highlights various key performance indicators to track and calculate product success in market. It includes key metrics such as net promoter score, client retention rate, active user percentage, customer lifetime value and churn rate. Showcasing this set of slides titled Lead Metrics To Track And Measure Product Success Ppt Visual Aids Ideas Pdf. The topics addressed in these templates are Client Retention Rate, Active User Percentage, Customer Lifetime. All the content presented in this PPT design is completely editable. Download it and make adjustments in color, background, font etc. as per your unique business setting.

Project Time Management To Enhance Productivity Parameters To Measure Timeliness Of Project Activities Diagrams PDF
This slide shows the parameters to measure timeliness of project activities which includes cycle time, time spent, on-time completion percentage, number of adjustments, planned hours vs. actual time spent, etc.Deliver an awe inspiring pitch with this creative Project Time Management To Enhance Productivity Parameters To Measure Timeliness Of Project Activities Diagrams PDF bundle. Topics like Development Process, Completion Percentage, Completion Allocated can be discussed with this completely editable template. It is available for immediate download depending on the needs and requirements of the user.
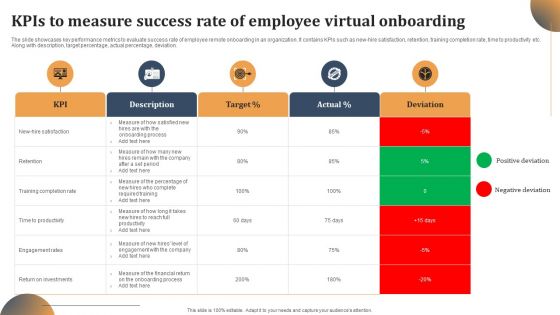
Kpis To Measure Success Rate Of Employee Virtual Onboarding Brochure PDF
The slide showcases key performance metrics to evaluate success rate of employee remote onboarding in an organization. It contains KPIs such as new-hire satisfaction, retention, training completion rate, time to productivity etc. Along with description, target percentage, actual percentage, deviation. Showcasing this set of slides titled Kpis To Measure Success Rate Of Employee Virtual Onboarding Brochure PDF. The topics addressed in these templates are Retention, Training Completion Rate, Engagement Rates. All the content presented in this PPT design is completely editable. Download it and make adjustments in color, background, font etc. as per your unique business setting.
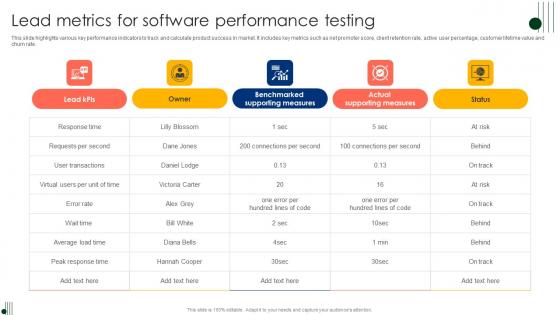
Lead Metrics For Software Performance Testing Ppt Show Visual Aids Pdf
This slide highlights various key performance indicators to track and calculate product success in market. It includes key metrics such as net promoter score, client retention rate, active user percentage, customer lifetime value and churn rate. Showcasing this set of slides titled Lead Metrics For Software Performance Testing Ppt Show Visual Aids Pdf. The topics addressed in these templates are Client Retention Rate, Active User Percentage, Customer Lifetime. All the content presented in this PPT design is completely editable. Download it and make adjustments in color, background, font etc. as per your unique business setting.

Business Chart Showing Economic Growth Trend Ppt PowerPoint Presentation Infographic Template Format
Presenting this set of slides with name business chart showing economic growth trend ppt powerpoint presentation infographic template format. The topics discussed in these slides are gdp growth rate, percentage. This is a completely editable PowerPoint presentation and is available for immediate download. Download now and impress your audience.

Business Marketing PowerPoint Templates Business Product Comparisons Over Time Ppt Slides
Business Marketing PowerPoint Templates Business product comparisons over time PPT Slides--This chart is useful for showing data changes over a period of time or for illustrating comparisons among items. -Business Marketing PowerPoint Templates Business product comparison over time PPT Slides-This ppt can be used for concepts relating to-chart,, graph, growth, investment, , market, percentage, , presentation report, results, statistics, stock, success and business.

Business Editable PowerPoint Templates Business Beveled Column Chart Ppt Slides
Business Editable PowerPoint Templates Business beveled column chart PPT Slides-This PowerPoint slide is a data driven Columns Chart. The number of columns depend on the data.-Business Editable PowerPoint Templates Business beveled column chart PPT Slides-This ppt can be used for concepts relating to-chart,, graph, growth, investment, , market, percentage, , presentation report, results, statistics, stock, success and business.

Business Education PowerPoint Templates Business Bar Graph Data Driven Ppt Slides
Business Education PowerPoint Templates Business bar graph data driven PPT Slides-This PowerPoint slide is a data driven Columns Chart. The number of columns depend on the data.-Business Editable PowerPoint Templates Business beveled column chart PPT Slides-This ppt can be used for concepts relating to-chart,, graph, growth, investment, , market, percentage, , presentation report, results, statistics, stock, success and business.

 Home
Home