Percentage Growth
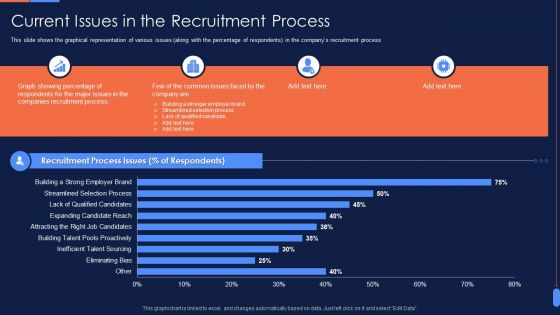
Recruitment Training To Optimize Current Issues In The Recruitment Process Designs PDF
This slide shows the graphical representation of various issues along with the percentage of respondents in the companys recruitment process. Deliver an awe inspiring pitch with this creative Recruitment Training To Optimize Current Issues In The Recruitment Process Designs PDF bundle. Topics like Graph Showing Percentage, Recruitment Process Issues, Eliminating Bias, Inefficient Talent Sourcing can be discussed with this completely editable template. It is available for immediate download depending on the needs and requirements of the user.
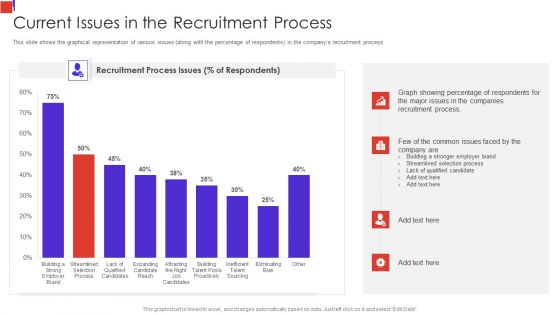
Outline Of Employee Recruitment Current Issues In The Recruitment Process Information PDF
This slide shows the graphical representation of various issues along with the percentage of respondents in the companys recruitment process Deliver an awe inspiring pitch with this creative Outline Of Employee Recruitment Current Issues In The Recruitment Process Information PDF bundle. Topics like Showing Percentage, Issues In The Companies, Recruitment Process can be discussed with this completely editable template. It is available for immediate download depending on the needs and requirements of the user.
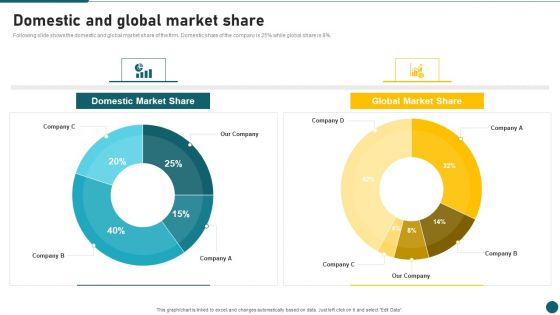
Due Diligence In Amalgamation And Acquisition Domestic And Global Market Share Slides PDF
Following slide shows the domestic and global market share of the firm. Domestic share of the company is 25 percentage while global share is 8 percentage. Deliver an awe inspiring pitch with this creative Due Diligence In Amalgamation And Acquisition Domestic And Global Market Share Slides PDF bundle. Topics like Domestic Market Share, Global Market Share can be discussed with this completely editable template. It is available for immediate download depending on the needs and requirements of the user.
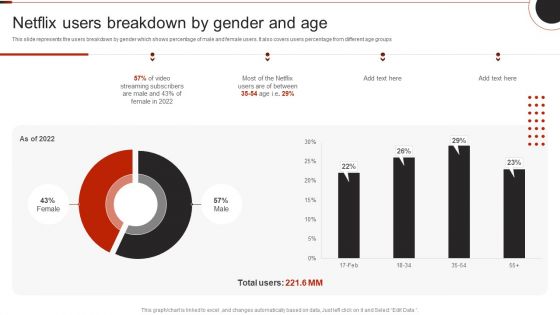
Netflix Company Outline Netflix Users Breakdown By Gender And Age Template PDF
This slide represents the users breakdown by gender which shows percentage of male and female users. It also covers users percentage from different age groups.Deliver an awe inspiring pitch with this creative Netflix Company Outline Netflix Users Breakdown By Gender And Age Template PDF bundle. Topics like Streaming Subscribers, Male Female, Total Users can be discussed with this completely editable template. It is available for immediate download depending on the needs and requirements of the user.
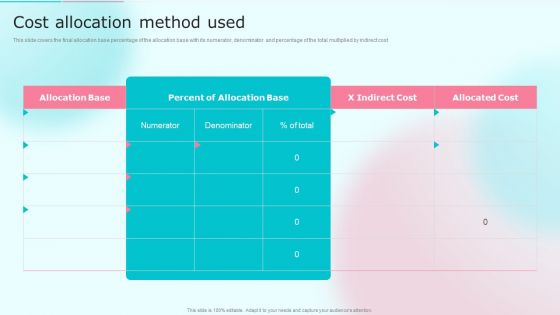
Cost Distribution Accounting Techniques Cost Allocation Method Used Download PDF
This slide covers the final allocation base percentage of the allocation base with its numerator, denominator and percentage of the total multiplied by indirect cost. Deliver and pitch your topic in the best possible manner with this Cost Distribution Accounting Techniques Cost Allocation Method Used Download PDF. Use them to share invaluable insights on Indirect Cost, Allocated Cost and impress your audience. This template can be altered and modified as per your expectations. So, grab it now.

Computer Virtualization Problems Faced By The Company Download PDF
This slide describes the problems faced by the company that include the percentage of total spreadsheets, percentage of excel sheets that contains errors and number of managers who dont know about high risk spreadsheets.Deliver an awe inspiring pitch with this creative Computer Virtualization Problems Faced By The Company Download PDF bundle. Topics like Spreadsheets Make, Spreadsheets That Posses, Provide Official can be discussed with this completely editable template. It is available for immediate download depending on the needs and requirements of the user.

BPO Call Center Company Profile Integrated Performance Of The Company Portrait PDF
This slide highlights the integrated performance of call center which covers different elements such as jobs created, percentage of women, renewable energy consumption, employees trained on data security and code of conduct.Deliver an awe inspiring pitch with this creative BPO Call Center Company Profile Integrated Performance Of The Company Portrait PDF bundle. Topics like Percentage Women, Agents Trained, Technology Analytics can be discussed with this completely editable template. It is available for immediate download depending on the needs and requirements of the user.

Cost Allocation Method Used Cost Sharing And Exercisebased Costing System Brochure PDF
This slide covers the final allocation base percentage of the allocation base with its numerator, denominator and percentage of the total multiplied by indirect cost. Deliver an awe inspiring pitch with this creative Cost Allocation Method Used Cost Sharing And Exercisebased Costing System Brochure PDF bundle. Topics like Allocation Base, Percent Allocation, Allocation Cost can be discussed with this completely editable template. It is available for immediate download depending on the needs and requirements of the user.
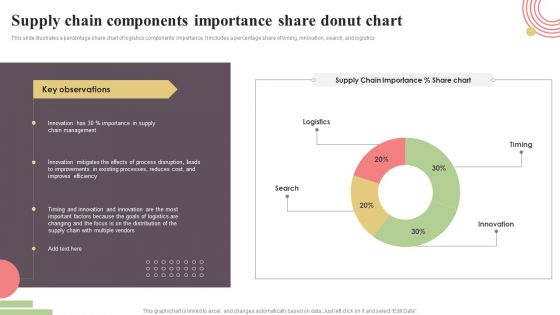
Supply Chain Components Importance Share Donut Chart Rules PDF
This slide illustrates a percentage share chart of logistics components importance. It includes a percentage share of timing, innovation, search, and logistics. Showcasing this set of slides titled Supply Chain Components Importance Share Donut Chart Rules PDF. The topics addressed in these templates are Timing, Innovation, Search, Logistics. All the content presented in this PPT design is completely editable. Download it and make adjustments in color, background, font etc. as per your unique business setting.
Scatter Chart Ppt PowerPoint Presentation Icon Mockup
This is a scatter chart ppt powerpoint presentation icon mockup. This is a nine stage process. The stages in this process are product, in percentage, dollars, percentage, finance.
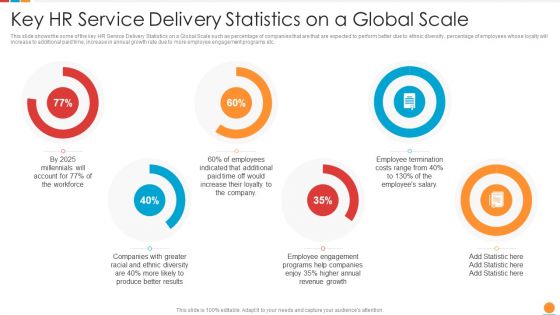
Providing HR Service To Improve Key HR Service Delivery Statistics On A Global Scale Designs PDF
This slide shows the some of the key HR Service Delivery Statistics on a Global Scale such as percentage of companies that are that are expected to perform better due to ethnic diversity, percentage of employees whose loyalty will increase to additional paid time, increase in annual growth rate due to more employee engagement programs etc. Deliver and pitch your topic in the best possible manner with this providing hr service to improve key hr service delivery statistics on a global scale designs pdf. Use them to share invaluable insights on revenue growth, employee, employee termination costs and impress your audience. This template can be altered and modified as per your expectations. So, grab it now.
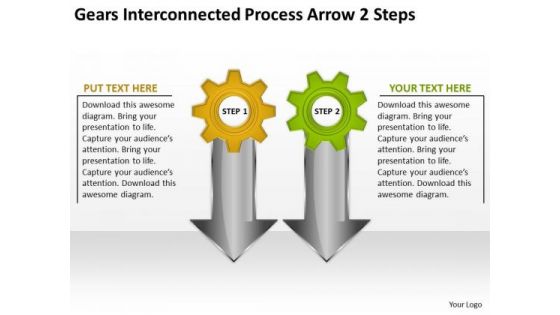
Gears Interconnected Process Arrow 2 Steps Help Writing Business Plan PowerPoint Slides
We present our gears interconnected process arrow 2 steps help writing business plan PowerPoint Slides.Download and present our Arrows PowerPoint Templates because Our PowerPoint Templates and Slides will let your team Walk through your plans. See their energy levels rise as you show them the way. Use our Shapes PowerPoint Templates because You have a driving passion to excel in your field. Our PowerPoint Templates and Slides will prove ideal vehicles for your ideas. Download our Gear Wheels PowerPoint Templates because Our PowerPoint Templates and Slides will provide weight to your words. They will bring out the depth of your thought process. Present our Business PowerPoint Templates because Our PowerPoint Templates and Slides are Clear and concise. Use them and dispel any doubts your team may have. Present our Success PowerPoint Templates because Watching this your Audience will Grab their eyeballs, they wont even blink.Use these PowerPoint slides for presentations relating to accounting, arrow, ascending, background, bank, blue, business, charts, compare, comparison, computer, corporate, count, descending, fame, famous, finance, generated, gradient, grow, growth, illustration, income, international, linear, money, papers, parallel, percentage, point, record, scale, shares, signs, stock, success, symbols, tax, tip, vary, white, world. The prominent colors used in the PowerPoint template are Yellow, Green, Gray.
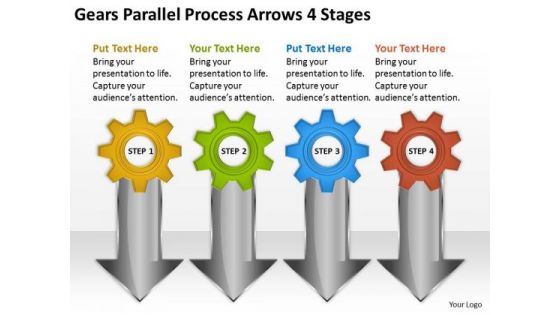
Parallel Process Arrows 4 Stages Business Plans For Small PowerPoint Slides
We present our parallel process arrows 4 stages business plans for small PowerPoint Slides.Present our Arrows PowerPoint Templates because It will Strengthen your hand with your thoughts. They have all the aces you need to win the day. Use our Shapes PowerPoint Templates because Our PowerPoint Templates and Slides will embellish your thoughts. See them provide the desired motivation to your team. Download our Gear Wheels PowerPoint Templates because Our PowerPoint Templates and Slides will Activate the energies of your audience. Get their creative juices flowing with your words. Use our Business PowerPoint Templates because Our PowerPoint Templates and Slides will generate and maintain the level of interest you desire. They will create the impression you want to imprint on your audience. Download our Success PowerPoint Templates because Our PowerPoint Templates and Slides will Embellish your thoughts. They will help you illustrate the brilliance of your ideas.Use these PowerPoint slides for presentations relating to accounting, arrow, ascending, background, bank, blue, business, charts, compare, comparison, computer, corporate, count, descending, fame, famous, finance, generated, gradient, grow, growth, illustration, income, international, linear, money, papers, parallel, percentage, point, record, scale, shares, signs, stock, success, symbols, tax, tip, vary, white, world. The prominent colors used in the PowerPoint template are Yellow, Green, Gray.
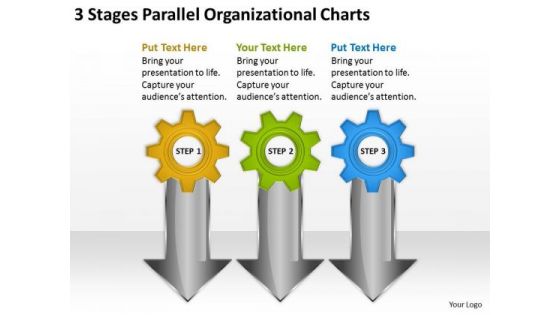
3 Stages Parallel Organizational Charts Business Plan Downloads PowerPoint Slides
We present our 3 stages parallel organizational charts business plan downloads PowerPoint Slides.Use our Arrows PowerPoint Templates because Our PowerPoint Templates and Slides will provide you a launch platform. Give a lift off to your ideas and send them into orbit. Download our Shapes PowerPoint Templates because Our PowerPoint Templates and Slides will Embellish your thoughts. They will help you illustrate the brilliance of your ideas. Download our Gear Wheels PowerPoint Templates because Our PowerPoint Templates and Slides will provide weight to your words. They will bring out the depth of your thought process. Present our Business PowerPoint Templates because you can Set pulses racing with our PowerPoint Templates and Slides. They will raise the expectations of your team. Download our Success PowerPoint Templates because They will Put the wind in your sails. Skim smoothly over the choppy waters of the market.Use these PowerPoint slides for presentations relating to accounting, arrow, ascending, background, bank, blue, business, charts, compare, comparison, computer, corporate, count, descending, fame, famous, finance, generated, gradient, grow, growth, illustration, income, international, linear, money, papers, parallel, percentage, point, record, scale, shares, signs, stock, success, symbols, tax, tip, vary, white, world. The prominent colors used in the PowerPoint template are Yellow, Blue, Green.

Patient Retention Approaches For Improving Brand Loyalty Current Patient Satisfaction Status Graphics PDF
This slide shows the current Patient Satisfaction Status at the medical facility. This slide shows the percentage of patients that are satisfied and percentage that are dissatisfied at a medical facility due to various reasons.Deliver and pitch your topic in the best possible manner with this patient retention approaches for improving brand loyalty current patient satisfaction status graphics pdf Use them to share invaluable insights on percentages patients, patient satisfaction status, dissatisfied are around and impress your audience. This template can be altered and modified as per your expectations. So, grab it now.

Consumer Retention Techniques Current Patient Satisfaction Status At The Medical Facility Introduction PDF
This slide shows the current Patient Satisfaction Status at the medical facility. This slide shows the percentage of patients that are satisfied and percentage that are dissatisfied at a medical facility due to various reasons. Deliver an awe inspiring pitch with this creative consumer retention techniques current patient satisfaction status at the medical facility introduction pdf bundle. Topics like percentages patients satisfied, medical facility, high treatment costs, poor calling experience can be discussed with this completely editable template. It is available for immediate download depending on the needs and requirements of the user.

Impact Effort Task Prioritization Matrix Ppt PowerPoint Presentation Infographics Show
This is a impact effort task prioritization matrix ppt powerpoint presentation infographics show. The topics discussed in this diagram are priority matrix, responsibility matrix, action matrix. This is a completely editable PowerPoint presentation, and is available for immediate download.

Project Planning Task Assignment Matrix Ppt PowerPoint Presentation Ideas Brochure
This is a project planning task assignment matrix ppt powerpoint presentation ideas brochure. The topics discussed in this diagram are priority matrix, responsibility matrix, action matrix. This is a completely editable PowerPoint presentation, and is available for immediate download.
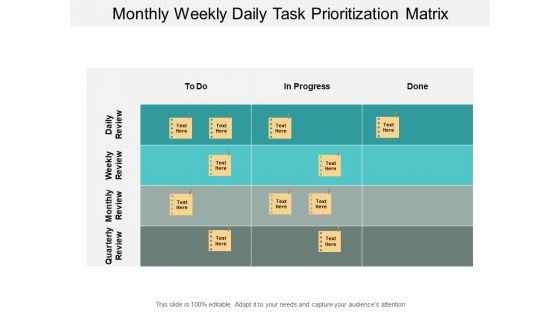
Monthly Weekly Daily Task Prioritization Matrix Ppt PowerPoint Presentation Model Guide
This is a monthly weekly daily task prioritization matrix ppt powerpoint presentation model guide. The topics discussed in this diagram are priority matrix, responsibility matrix, action matrix. This is a completely editable PowerPoint presentation, and is available for immediate download.
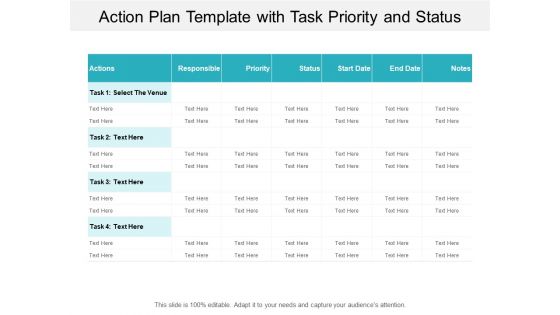
Action Plan Template With Task Priority And Status Ppt PowerPoint Presentation Slides Samples
This is a action plan template with task priority and status ppt powerpoint presentation slides samples. The topics discussed in this diagram are priority matrix, responsibility matrix, action matrix. This is a completely editable PowerPoint presentation, and is available for immediate download.
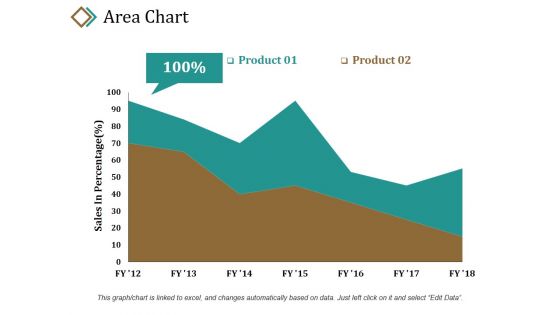
Area Chart Ppt PowerPoint Presentation Summary Example Introduction
This is a area chart ppt powerpoint presentation summary example introduction. This is a two stage process. The stages in this process are product, sales in percentage, percentage, area chart, business.

5 Stages Life Cycle Assesment Business Plan PowerPoint Slides
We present our 5 stages life cycle assesment business plan PowerPoint Slides.Download and present our Circle Charts PowerPoint Templates because Our PowerPoint Templates and Slides are designed to help you succeed. They have all the ingredients you need. Present our Business PowerPoint Templates because Our PowerPoint Templates and Slides will definately Enhance the stature of your presentation. Adorn the beauty of your thoughts with their colourful backgrounds. Download and present our Marketing PowerPoint Templates because You can Bask in the warmth of our PowerPoint Templates and Slides. Enjoy the heartfelt glowing response of your listeners. Download our Shapes PowerPoint Templates because Our PowerPoint Templates and Slides will give good value for money. They also have respect for the value of your time. Use our Process and Flows PowerPoint Templates because Our PowerPoint Templates and Slides has conjured up a web of all you need with the help of our great team. Use them to string together your glistening ideas.Use these PowerPoint slides for presentations relating to Graphic, business, data, profit, market, statistics, sales, slice, economy, display, corporate, concept, render, success,presentation, percentage, finance, bank, report, marketing, accounting, management, illustration, piece, strategy, money, growth, company, competition, progress,account, part, information, investment, improvement, banking,financial, reflect, results, performance, exchange. The prominent colors used in the PowerPoint template are Purple, Gray, Black.

5 Stages Life Cycle Assesment Business Plans Template PowerPoint Templates
We present our 5 stages life cycle assesment business plans template PowerPoint templates.Download and present our Process and Flows PowerPoint Templates because Our PowerPoint Templates and Slides will bullet point your ideas. See them fall into place one by one. Download our Marketing PowerPoint Templates because you can Break through with our PowerPoint Templates and Slides. Bring down the mental barriers of your audience. Present our Circle Charts PowerPoint Templates because It is Aesthetically crafted by artistic young minds. Our PowerPoint Templates and Slides are designed to display your dexterity. Present our Business PowerPoint Templates because Our PowerPoint Templates and Slides have the Brilliant backdrops. Guaranteed to illuminate the minds of your audience. Download our Marketing PowerPoint Templates because Our PowerPoint Templates and Slides will let your words and thoughts hit bullseye everytime.Use these PowerPoint slides for presentations relating to Graphic, business, data, profit, market, statistics, sales, slice, economy, display, corporate, concept, render, success,presentation, percentage, finance, bank, report, marketing, accounting, management, illustration, piece, strategy, money, growth, company, competition, progress,account, part, information, investment, improvement, banking,financial, reflect, results, performance, exchange. The prominent colors used in the PowerPoint template are Red, White, Gray.

9 Stages Hub And Spoke Comparison Diagram How Business Plan PowerPoint Templates
We present our 9 stages hub and spoke comparison diagram how business plan PowerPoint templates.Use our Process and Flows PowerPoint Templates because Our PowerPoint Templates and Slides will let Your superior ideas hit the target always and everytime. Download our Arrows PowerPoint Templates because Our PowerPoint Templates and Slides are a sure bet. Gauranteed to win against all odds. Download our Business PowerPoint Templates because Our PowerPoint Templates and Slides have the Brilliant backdrops. Guaranteed to illuminate the minds of your audience. Use our Circle Charts PowerPoint Templates because Our PowerPoint Templates and Slides will let you meet your Deadlines. Download our Flow Charts PowerPoint Templates because Our PowerPoint Templates and Slides will effectively help you save your valuable time. They are readymade to fit into any presentation structure. Use these PowerPoint slides for presentations relating to Pie, chart, graph, market, isolated, statistics, sales, economy, display, white, corporate, business, income, concept, arrow, success, presentation, nine,diagram, percentage, graphic, finance, data, report, marketing, accounting, management, result, piece, strategy, growth, company, competition, progress, account,profit, part, information, investment, improvement, index, financial, reflect, performance. The prominent colors used in the PowerPoint template are Black, Green, Blue.
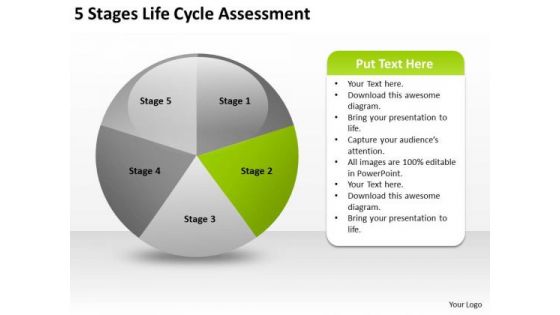
5 Stages Life Cycle Assesment Small Business Plan Samples PowerPoint Slides
We present our 5 stages life cycle assesment small business plan samples PowerPoint Slides.Download our Circle Charts PowerPoint Templates because Our PowerPoint Templates and Slides are conceived by a dedicated team. Use them and give form to your wondrous ideas. Use our Process and Flows PowerPoint Templates because Our PowerPoint Templates and Slides will let your words and thoughts hit bullseye everytime. Present our Business PowerPoint Templates because You can Connect the dots. Fan expectations as the whole picture emerges. Download our Marketing PowerPoint Templates because Our PowerPoint Templates and Slides offer you the widest possible range of options. Download our Shapes PowerPoint Templates because Our PowerPoint Templates and Slides will let your words and thoughts hit bullseye everytime.Use these PowerPoint slides for presentations relating to Graphic, business, data, profit, market, statistics, sales, slice, economy, display, corporate, concept, render, success,presentation, percentage, finance, bank, report, marketing, accounting, management, illustration, piece, strategy, money, growth, company, competition, progress,account, part, information, investment, improvement, banking,financial, reflect, results, performance, exchange. The prominent colors used in the PowerPoint template are Green, White, Gray.
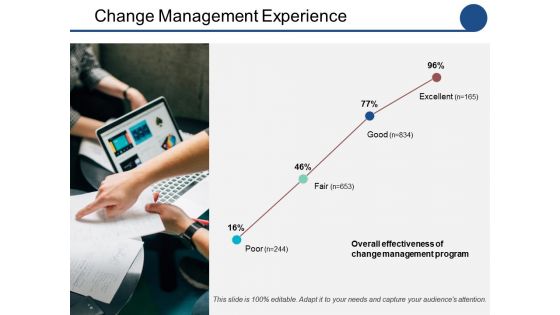
Change Management Experience Ppt PowerPoint Presentation Styles Professional
This is a change management experience ppt powerpoint presentation styles professional. This is a four stage process. The stages in this process are business, marketing, management, percentage.

Providing Electronic Financial Services To Existing Consumers Mobile Subscribers Projection Demonstration PDF
Mentioned slide shows informational stats about mobile subscribers and tele density growth for five years. The graph depicts that Total mobile subscription for MFS will get increased by 84 percentage in 2026. Deliver an awe inspiring pitch with this creative Providing Electronic Financial Services To Existing Consumers Mobile Subscribers Projection Demonstration PDF bundle. Topics like Mobile Subscribers Projection And Tele Density Growth can be discussed with this completely editable template. It is available for immediate download depending on the needs and requirements of the user.
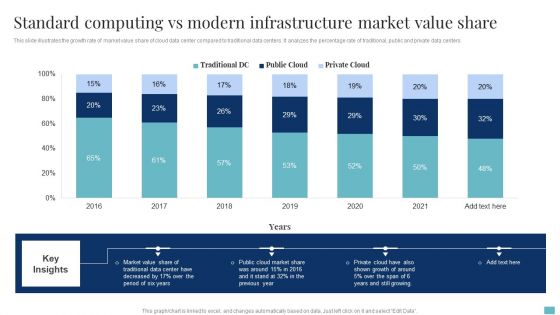
Standard Computing Vs Modern Infrastructure Market Value Share Brochure PDF
This slide illustrates the growth rate of market value share of cloud data center compared to traditional data centers. It analyzes the percentage rate of traditional, public and private data centers. Pitch your topic with ease and precision using this Standard Computing Vs Modern Infrastructure Market Value Share Brochure PDF. This layout presents information on Cloud Market Share, Market Value Share, Growth. It is also available for immediate download and adjustment. So, changes can be made in the color, design, graphics or any other component to create a unique layout.
Line Chart Ppt PowerPoint Presentation Icon Inspiration
This is a line chart ppt powerpoint presentation icon inspiration. This is a two stage process. The stages in this process are product, financial years, sales in percentage.
Area Chart Ppt PowerPoint Presentation Icon Gallery
This is a area chart ppt powerpoint presentation icon gallery. This is a two stage process. The stages in this process are sales in percentage, product, bar graph.
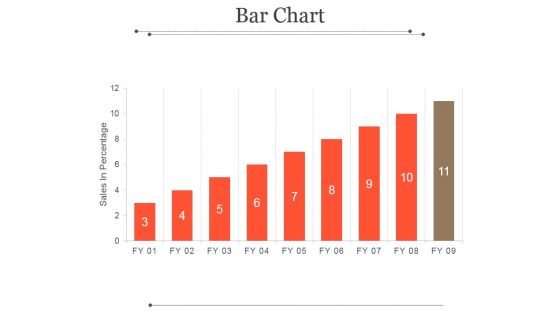
Bar Chart Ppt PowerPoint Presentation Microsoft
This is a bar chart ppt powerpoint presentation microsoft. This is a eleven stage process. The stages in this process are sales in percentage, fy, graph, success, business.
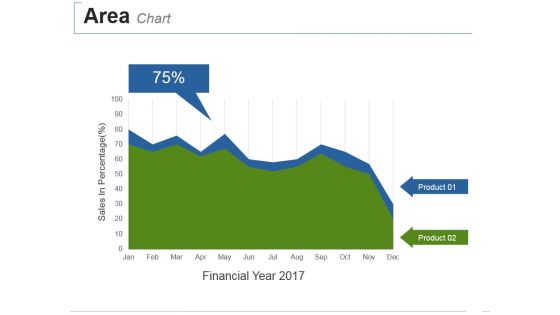
Area Chart Ppt PowerPoint Presentation Summary Deck
This is a area chart ppt powerpoint presentation summary deck. This is a two stage process. The stages in this process are sales in percentage, financial year.
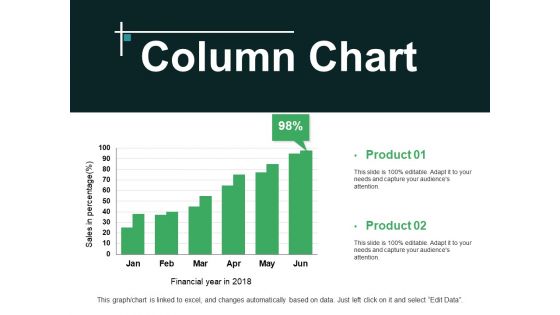
Column Chart Ppt PowerPoint Presentation Professional Aids
This is a column chart ppt powerpoint presentation professional aids. This is a two stage process. The stages in this process are product, sales in percentage, financial years.
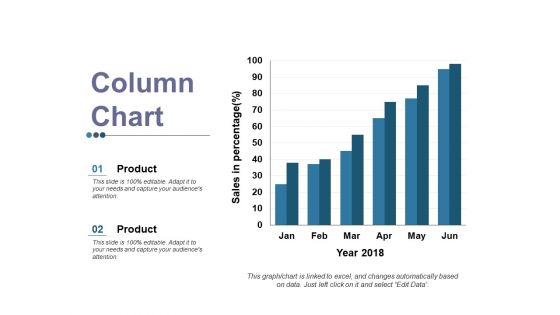
Column Chart Ppt PowerPoint Presentation Gallery Layout
This is a column chart ppt powerpoint presentation gallery layout. This is a two stage process. The stages in this process are product, sales in percentage, year.
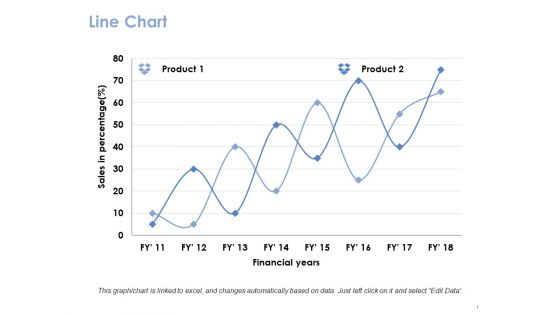
Line Chart Ppt PowerPoint Presentation Gallery Guide
This is a line chart ppt powerpoint presentation gallery guide. This is a two stage process. The stages in this process are product, financial years, sales in percentage.

Bar Graph Ppt PowerPoint Presentation Ideas Display
This is a bar graph ppt powerpoint presentation ideas display. This is a two stage process. The stages in this process are product, sales in percentage, bar graph.
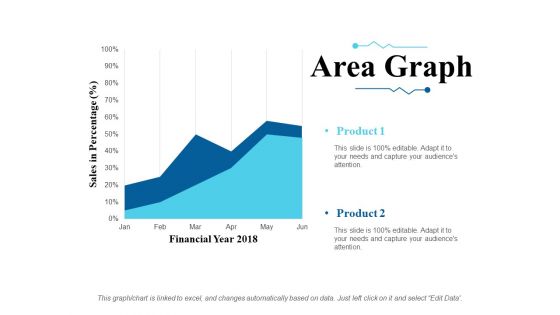
Area Graph Ppt PowerPoint Presentation Slides Ideas
This is a area graph ppt powerpoint presentation slides ideas. This is a two stage process. The stages in this process are sales in percentage, financial year, product.
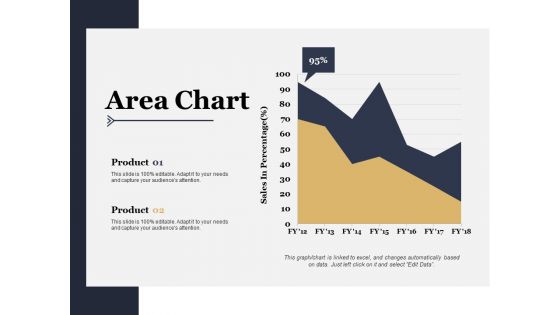
Area Chart Ppt PowerPoint Presentation Styles Professional
This is a area chart ppt powerpoint presentation styles professional. This is a two stage process. The stages in this process are sales in percentage, product, area chart.

Overall Revenue Analysis Bar Chart Powerpoint Slide Information
This is a overall revenue analysis bar chart powerpoint slide information. This is a nine stage process. The stages in this process are finance, success, business, marketing, percentage.
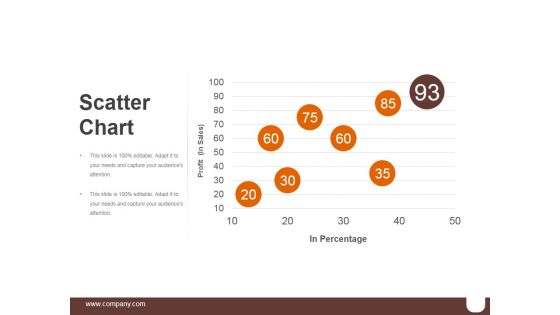
Scatter Chart Ppt PowerPoint Presentation Graphics
This is a scatter chart ppt powerpoint presentation graphics. This is a five stage process. The stages in this process are business, marketing, percentage, success, finance.

Clustered Bar Ppt PowerPoint Presentation Inspiration
This is a clustered bar ppt powerpoint presentation inspiration. This is a five stage process. The stages in this process are bar graph, business, marketing, finance, percentage.
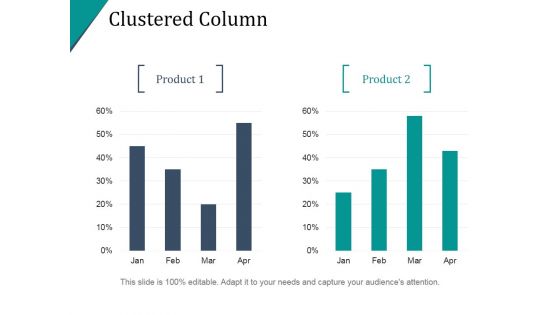
Clustered Column Ppt PowerPoint Presentation Infographic Template
This is a clustered column ppt powerpoint presentation infographic template. This is a two stage process. The stages in this process are finance, percentage, bar graph, business, marketing.
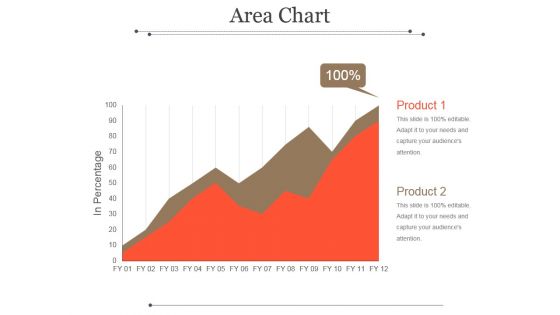
Area Chart Ppt PowerPoint Presentation Picture
This is a area chart ppt powerpoint presentation picture. This is a two stage process. The stages in this process are product, in percentage, graph, management, business.

Clustered Column Line Ppt PowerPoint Presentation Layout
This is a clustered column line ppt powerpoint presentation layout. This is a three stage process. The stages in this process are percentage, product, business, management.
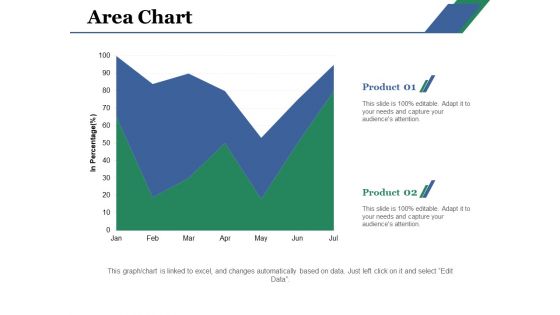
Area Chart Ppt PowerPoint Presentation Layouts Gridlines
This is a area chart ppt powerpoint presentation layouts gridlines. This is a two stage process. The stages in this process are area chart, product, percentage, analysis, capture.

Combo Chart Ppt PowerPoint Presentation Styles Format Ideas
This is a combo chart ppt powerpoint presentation styles format ideas. This is a three stage process. The stages in this process are percentage, product, marketing.

Comparison Ppt PowerPoint Presentation Show
This is a comparison ppt powerpoint presentation show. This is a five stage process. The stages in this process are compare, percentage, finance, people, ratio.

Dashboard Ppt PowerPoint Presentation Rules
This is a dashboard ppt powerpoint presentation rules. This is a three stage process. The stages in this process are dashboard, measurement, percentage, analysis, business.
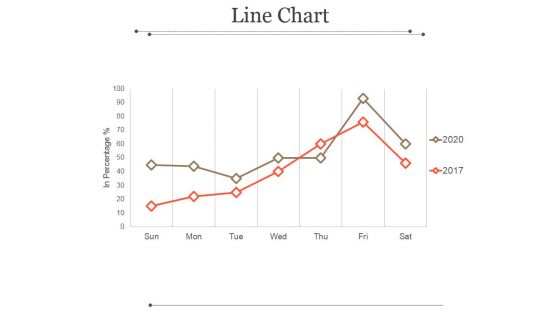
Line Chart Ppt PowerPoint Presentation Ideas
This is a line chart ppt powerpoint presentation ideas. This is a two stage process. The stages in this process are marketing, in percentage, sun, mon, tue, wed.
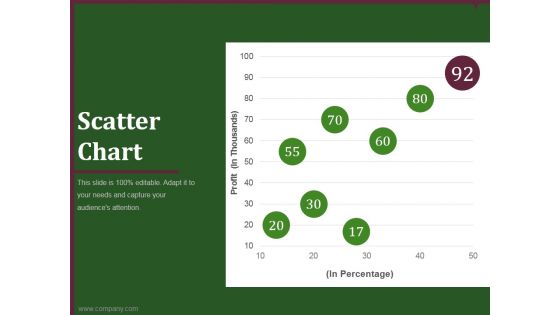
Scatter Chart Ppt PowerPoint Presentation Outline
This is a scatter chart ppt powerpoint presentation outline. This is a five stage process. The stages in this process are business, marketing, graph, percentage, finance.
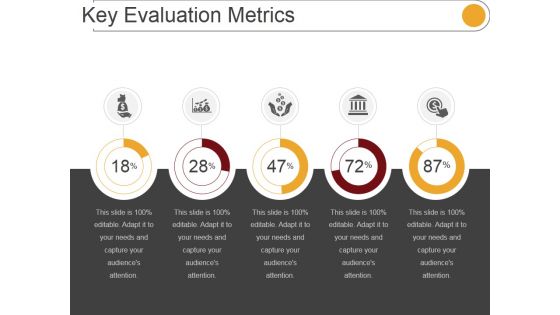
Key Evaluation Metrics Ppt PowerPoint Presentation Influencers
This is a key evaluation metrics ppt powerpoint presentation influencers. This is a five stage process. The stages in this process are icons, percentage, marketing, management.

Scatter Chart Ppt PowerPoint Presentation Professional Deck
This is a scatter chart ppt powerpoint presentation professional deck. This is a nine stage process. The stages in this process are percentage, business, marketing, graph, line.
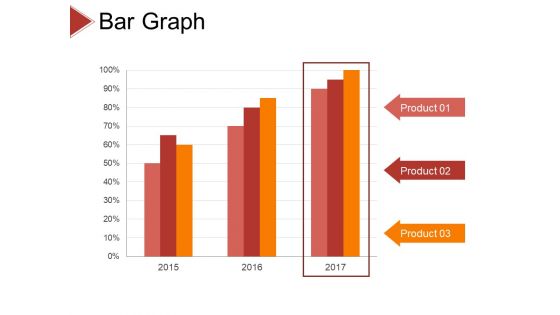
Bar Graph Ppt PowerPoint Presentation Layouts Gridlines
This is a bar graph ppt powerpoint presentation layouts gridlines. this is a three stage process. The stages in this process are product, percentage, business, marketing, management.
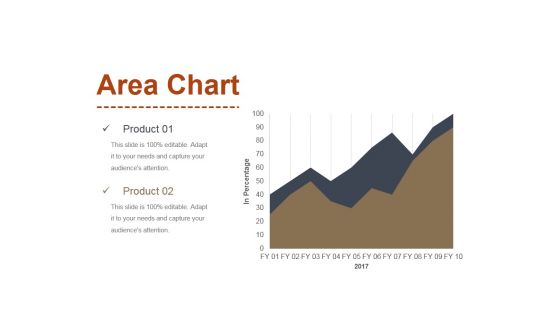
Area Chart Ppt PowerPoint Presentation Inspiration Slides
This is a area chart ppt powerpoint presentation inspiration slides. This is a two stage process. The stages in this process are area chart, product, in percentage.

Clustered Column Ppt PowerPoint Presentation Outline Slide Portrait
This is a clustered column ppt powerpoint presentation outline slide portrait. This is a two stage process. The stages in this process are product, finance, business, marketing, percentage.
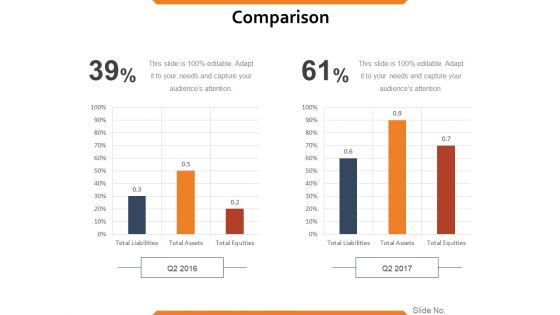
Comparison Ppt PowerPoint Presentation Gallery Outfit
This is a comparison ppt powerpoint presentation gallery outfit. This is a two stage process. The stages in this process are comparison, finance, business, percentage, marketing.

Financial Ppt PowerPoint Presentation Gallery Templates
This is a financial ppt powerpoint presentation gallery templates. This is a three stage process. The stages in this process are circular, percentage, strategy, business, finance.
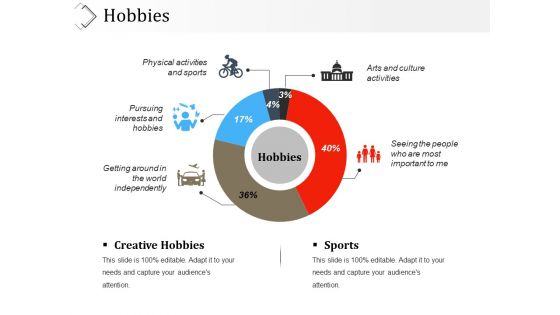
Hobbies Ppt PowerPoint Presentation Visual Aids Styles
This is a hobbies ppt powerpoint presentation visual aids styles. This is a five stage process. The stages in this process are icons, business, percentage, process, marketing.

Hobbies Ppt PowerPoint Presentation Show Templates
This is a hobbies ppt powerpoint presentation show templates. This is a five stage process. The stages in this process are creative hobbies, sports, icons, business, percentage.

Financial Ppt PowerPoint Presentation Show Graphics Pictures
This is a financial ppt powerpoint presentation show graphics pictures. This is a three stage process. The stages in this process are business, finance, percentage, icons.

 Home
Home