Output
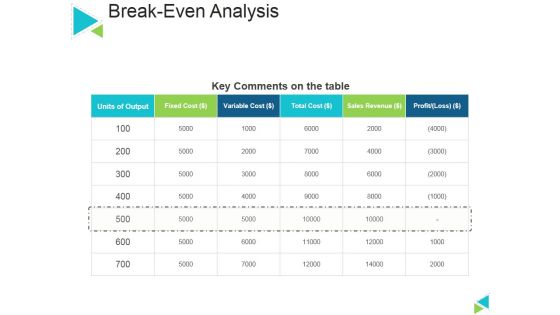
Break Even Analysis Ppt PowerPoint Presentation Layouts Portrait
This is a break even analysis ppt powerpoint presentation layouts portrait. This is a six stage process. The stages in this process are key comments on the table, units of output, total cost, sales revenue, profit.
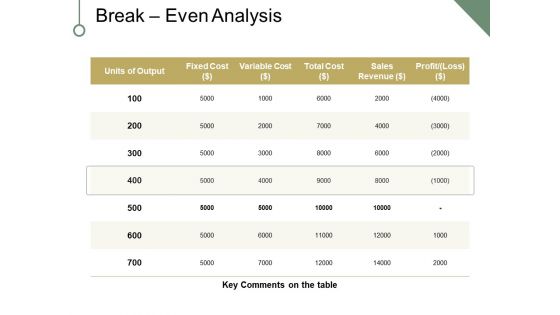
Break Even Analysis Ppt PowerPoint Presentation Portfolio Clipart
This is a break even analysis ppt powerpoint presentation portfolio clipart. This is a five stage process. The stages in this process are fixed cost, variable cost, sales revenue, profit, key comments on the table, units of output.
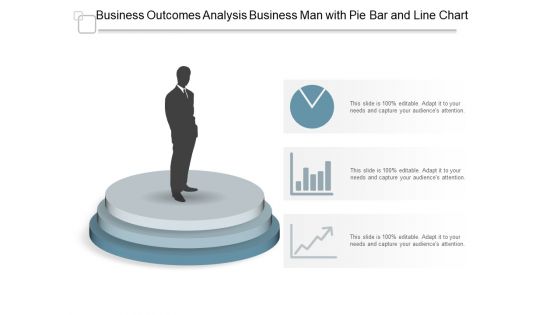
Business Outcomes Analysis Business Man With Pie Bar And Line Chart Ppt Powerpoint Presentation Infographics Visual Aids
This is a business outcomes analysis business man with pie bar and line chart ppt powerpoint presentation infographics visual aids. This is a three stage process. The stages in this process are business outcomes, business results, business output.
Business Outcomes Vector Icons Showing Pie And Bar Graph Ppt Powerpoint Presentation File Graphic Images
This is a business outcomes vector icons showing pie and bar graph ppt powerpoint presentation file graphic images. This is a three stage process. The stages in this process are business outcomes, business results, business output.
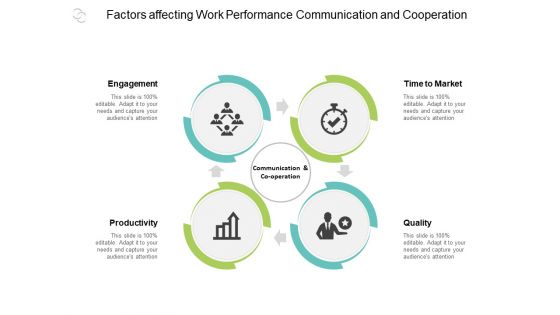
Factors Affecting Work Performance Communication And Cooperation Ppt Powerpoint Presentation Infographics Introduction
This is a factors affecting work performance communication and cooperation ppt powerpoint presentation infographics introduction. This is a four stage process. The stages in this process are business outcomes, business results, business output.
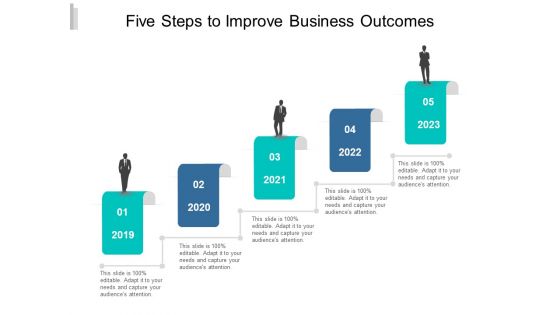
Five Steps To Improve Business Outcomes Ppt Powerpoint Presentation File Background Designs
This is a five steps to improve business outcomes ppt powerpoint presentation file background designs. This is a five stage process. The stages in this process are business outcomes, business results, business output.
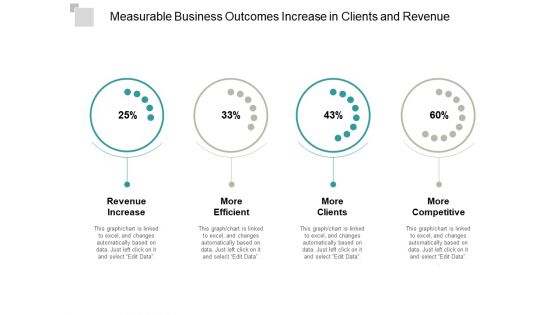
Measurable Business Outcomes Increase In Clients And Revenue Ppt Powerpoint Presentation Portfolio Ideas
This is a measurable business outcomes increase in clients and revenue ppt powerpoint presentation portfolio ideas. This is a four stage process. The stages in this process are business outcomes, business results, business output.
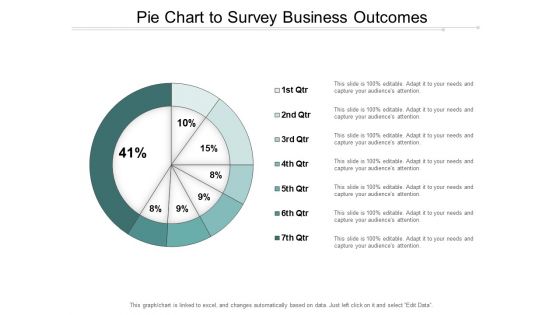
Pie Chart To Survey Business Outcomes Ppt Powerpoint Presentation Infographic Template Gridlines
This is a pie chart to survey business outcomes ppt powerpoint presentation infographic template gridlines. This is a seven stage process. The stages in this process are business outcomes, business results, business output.

Yearly Roadmap For Business Performance Analysis And Planning Ppt Powerpoint Presentation Show Professional
This is a yearly roadmap for business performance analysis and planning ppt powerpoint presentation show professional. This is a five stage process. The stages in this process are business outcomes, business results, business output.
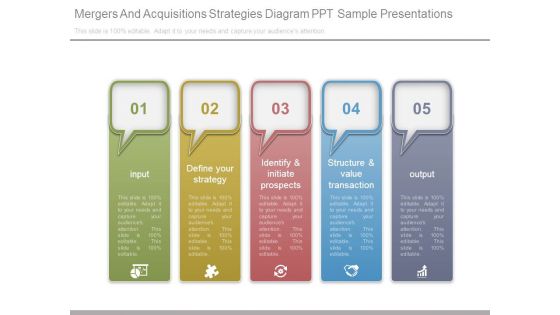
Mergers And Acquisitions Strategies Diagram Ppt Sample Presentations
This is a mergers and acquisitions strategies diagram ppt sample presentations. This is a five stage process. The stages in this process are input, define your strategy, identify and initiate prospects, structure and value transaction, output.

Quality Management System For Customer Service Presentation Images
This is a quality management system for customer service presentation images. This is a four stage process. The stages in this process are customer, requirement, input, product realization, output, product, satisfaction, resource management, measure and analysis enhancement, responsibility, customer.
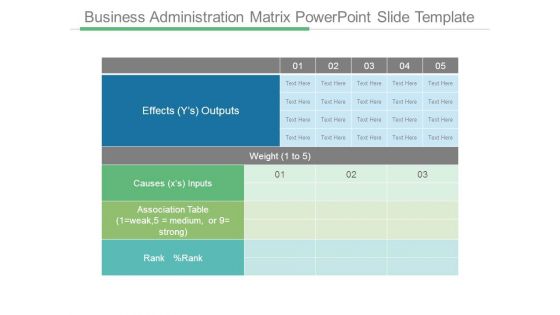
Business Administration Matrix Powerpoint Slide Template
This is a business administration matrix powerpoint slide template. This is a two stage process. The stages in this process are effects outputs, weight, causes inputs, association table, rank.
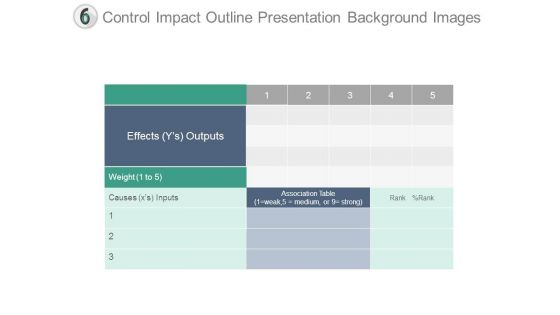
Control Impact Outline Presentation Background Images
This is a control impact outline presentation background images. This is a two stage process. The stages in this process are effects outputs, rank, association table, weight, causes inputs.
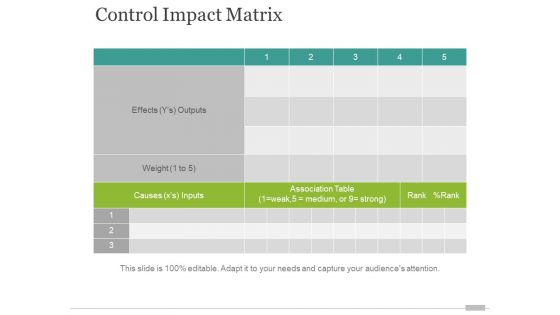
Control Impact Matrix Ppt PowerPoint Presentation File Designs
This is a control impact matrix ppt powerpoint presentation file designs. This is a five stage process. The stages in this process are causes x s inputs, association table, effects y s outputs, weight, rank.
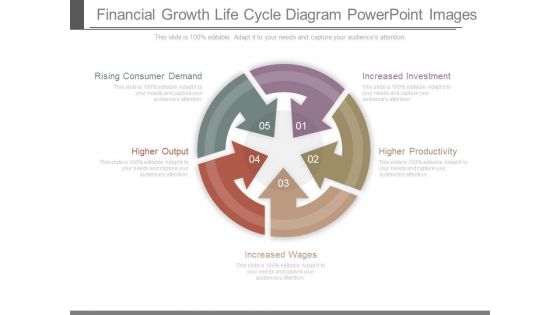
Financial Growth Life Cycle Diagram Powerpoint Images
This is a financial growth life cycle diagram powerpoint images. This is a five stage process. The stages in this process are rising consumer demand, higher output, increased wages, higher productivity, increased investment.
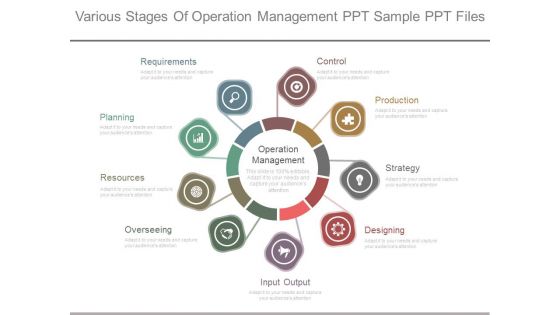
Various Stages Of Operation Management Ppt Sample Ppt Files
This is a various stages of operation management ppt sample ppt files. This is a nine stage process. The stages in this process are operation management, requirements, planning, resources, overseeing, input output, designing, strategy, production, control.

Various Stages Of Operation Management Ppt Slide
This is a various stages of operation management ppt slide. This is a eight stage process. The stages in this process are operation management, requirements, planning, resources, overseeing, input output, designing, strategy, production, control.
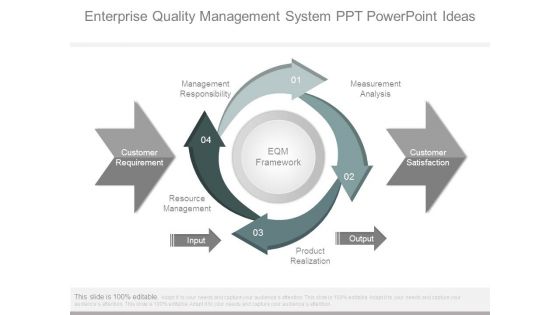
Enterprise Quality Management System Ppt Powerpoint Ideas
This is a enterprise quality management system ppt powerpoint ideas. This is a four stage process. The stages in this process are eqm framework, management responsibility, customer requirement, resource management, input, product realization, output, customer satisfaction, measurement analysis.

Structure Possibility Management Template Powerpoint Slide Information
This is a structure possibility management template powerpoint slide information. This is a four stage process. The stages in this process are tools and techniques, output, production of wbs, collection of project.
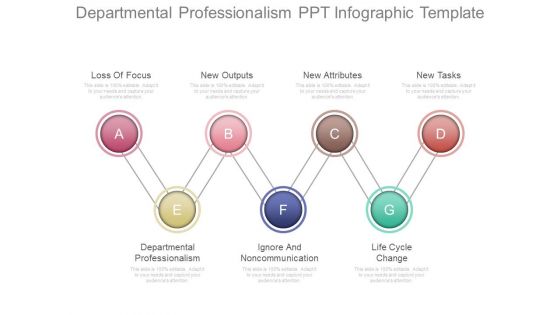
Departmental Professionalism Ppt Infographic Template
This is a departmental professionalism ppt infographic template. This is a seven stage process. The stages in this process are loss of focus, new outputs, new attributes, new tasks, departmental professionalism, ignore and noncommunication.
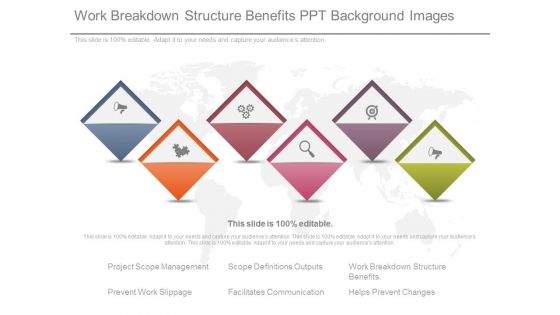
Work Breakdown Structure Benefits Ppt Background Images
This is a work breakdown structure benefits ppt background images. This is a six stage process. The stages in this process are project scope management, prevent work slippage, scope definitions outputs, facilitates communication, work breakdown structure benefits, helps prevent changes.
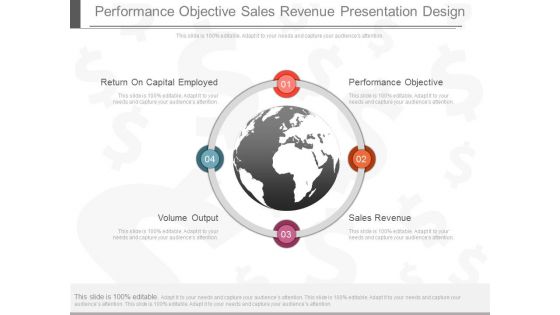
Performance Objective Sales Revenue Presentation Design
This is a performance objective sales revenue presentation design. This is a four stage process. The stages in this process are return on capital employed, volume output, performance objective, sales revenue.
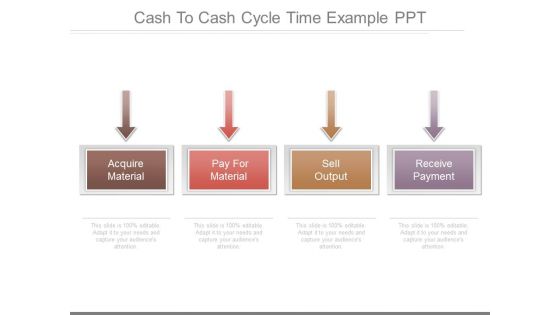
Cash To Cash Cycle Time Example Ppt
This is a cash to cash cycle time example ppt. This is a four stage process. The stages in this process are acquire material, pay for material, sell output, receive payment.

Processes Demonstrating Benefits Diagram Templates Microsoft
This is a processes demonstrating benefits diagram templates microsoft. This is a four stage process. The stages in this process are how, input, with what, with who, output, how many, process.
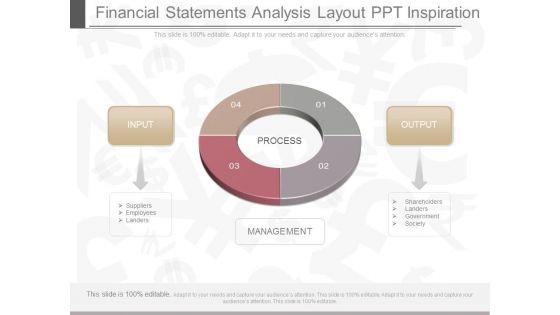
Financial Statements Analysis Layout Ppt Inspiration
This is a financial statements analysis layout ppt inspiration. This is a four stage process. The stages in this process are input, process, output, suppliers, employees, landers, management, shareholders, landers, government, society.
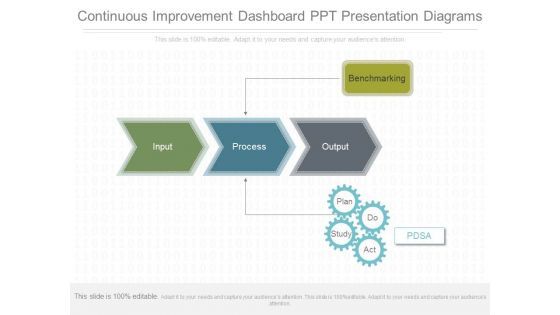
Continuous Improvement Dashboard Ppt Presentation Diagrams
This is a continuous improvement dashboard ppt presentation diagrams. This is a five stage process. The stages in this process are benchmarking, input, process, output, pdsa, plan, do, study, act.
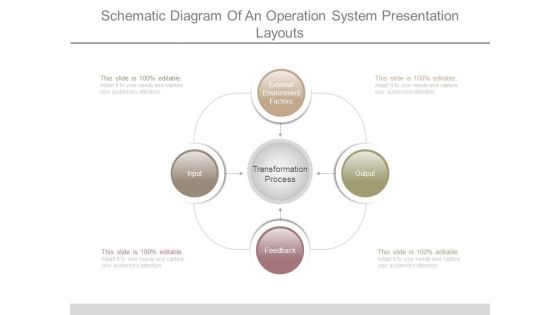
Schematic Diagram Of An Operation System Presentation Layouts
This is a schematic diagram of an operation system presentation layouts. This is a four stage process. The stages in this process are external environment factors, input, feedback, output, transformation process.

Tactical Planning Template Diagram Ppt Design
This is a tactical planning template diagram ppt design. This is a five stage process. The stages in this process are current reality assessment, organization environment profile, controls, outputs, mechanisms.
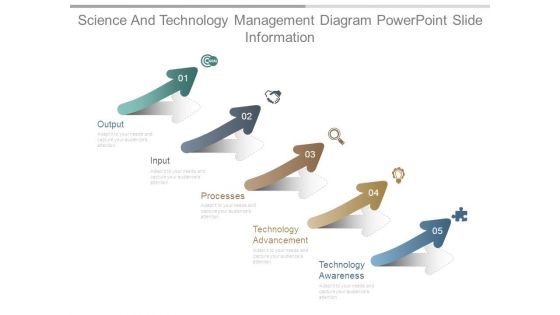
Science And Technology Management Diagram Powerpoint Slide Information
This is a science and technology management diagram powerpoint slide information. This is a five stage process. The stages in this process are output, input, processes, technology advancement, technology awareness.

Structural Engineering Ppt Template Ppt Background Images
This is a structural engineering ppt template ppt background images. This is a six stage process. The stages in this process are controls, activity, outputs, structural analysis, numerical method, network method.

Mesh Program Execution Model Example Of Ppt Presentation
This is a mesh program execution model example of ppt presentation. This is a five stage process. The stages in this process are reporting and intervention, planning supervisory work, process, input, output.
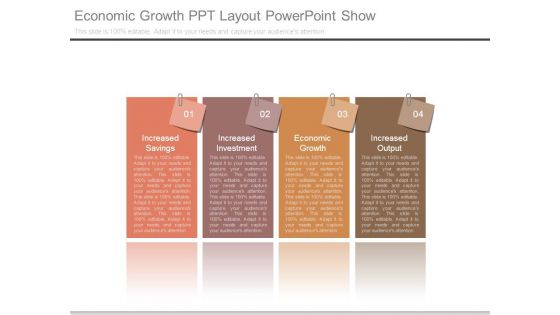
Economic Growth Ppt Layout Powerpoint Show
This is a economic growth ppt layout powerpoint show. This is a four stage process. The stages in this process are increased savings, increased investment, economic growth, increased output.
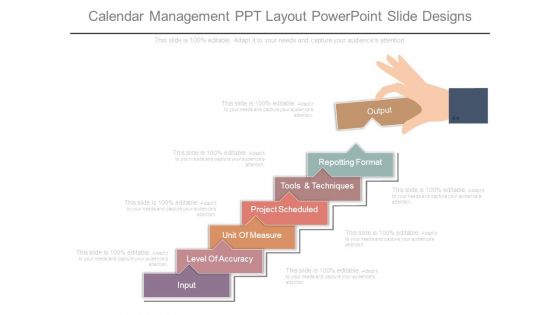
Calendar Management Ppt Layout Powerpoint Slide Designs
This is a calendar management ppt layout powerpoint slide designs. This is a seven stage process. The stages in this process are input, level of accuracy, unit of measure, project scheduled, tools and techniques, repotting format, output.
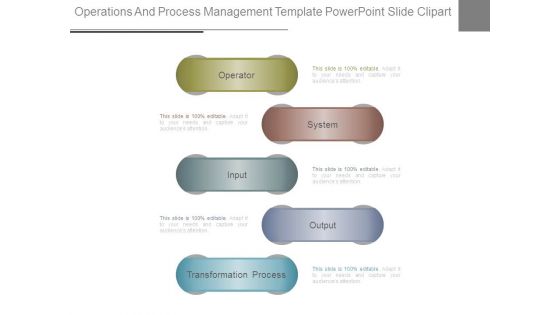
Operations And Process Management Template Powerpoint Slide Clipart
This is a operations and process management template powerpoint slide clipart. This is a five stage process. The stages in this process are operator, system, input, output, transformation process.
Sipoc Process With Icons Ppt Images Gallery
This is a sipoc process with icons ppt images gallery. This is a five stage process. The stages in this process are start, finish, suppliers, input, process, output, customer, sipoc.
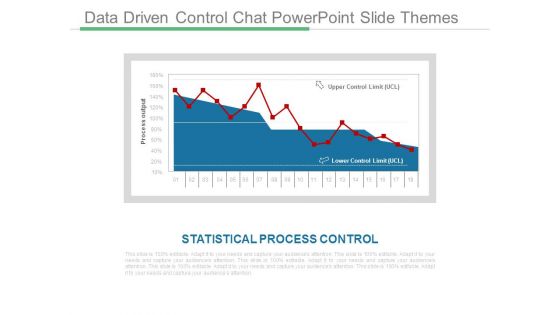
Data Driven Control Chat Powerpoint Slide Themes
This is a data driven control chat powerpoint slide themes. This is a one stage process. The stages in this process are process output, upper control limit, statistical process control, lower control limit.
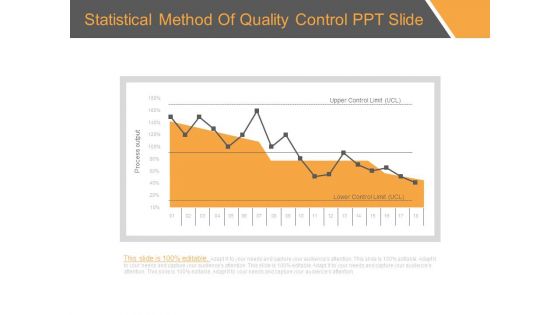
Statistical Method Of Quality Control Ppt Slide
This is a statistical method of quality control ppt slide. This is a one stage process. The stages in this process are process output, upper control limit, lower control limit.
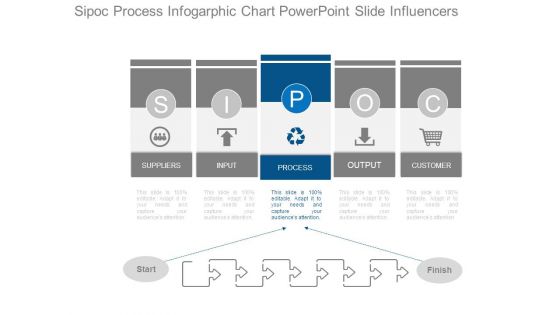
Sipoc Process Infogarphic Chart Powerpoint Slide Influencers
This is a sipoc process infogarphic chart powerpoint slide influencers. This is a five stage process. The stages in this process are suppliers, input, process, output, customer, start, finish, sipoc.

Statistical Method For Control Powerpoint Slide Designs
This is a statistical method for control powerpoint slide designs. This is a one stage process. The stages in this process are process output, upper control limit, lower control limit.
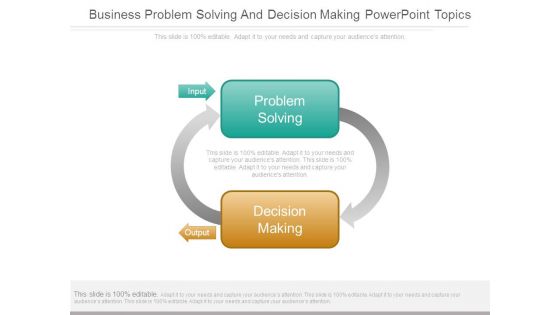
Business Problem Solving And Decision Making Powerpoint Topics
This is a business problem solving and decision making powerpoint topics. This is a two stage process. The stages in this process are problem solving, decision making, input, output.
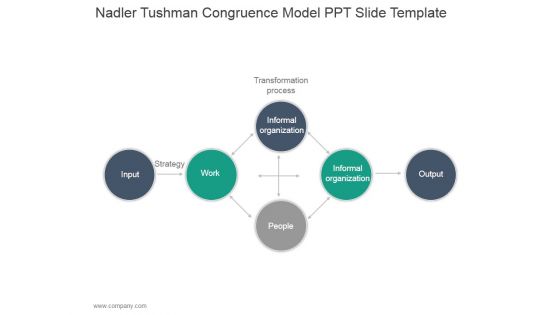
Nadler Tushman Congruence Model Ppt PowerPoint Presentation Design Ideas
This is a nadler tushman congruence model ppt powerpoint presentation design ideas. This is a six stage process. The stages in this process are transformation process, input, strategy, work, informal organization, informal organization, people, output.
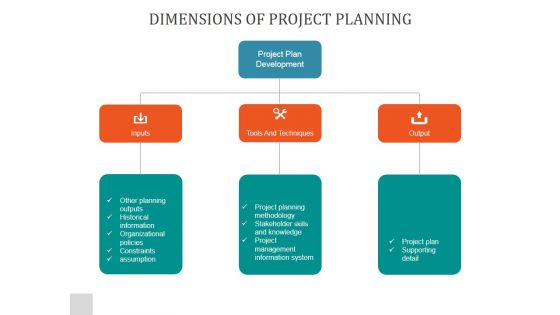
Dimensions Of Project Planning Ppt PowerPoint Presentation Outline
This is a dimensions of project planning ppt powerpoint presentation outline. This is a three stage process. The stages in this process are project plan development, inputs, tools and techniques, output.
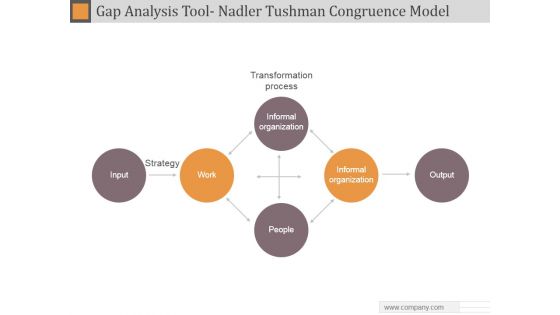
Gap Analysis Tool Nadler Tushman Congruence Model Ppt PowerPoint Presentation Samples
This is a gap analysis tool nadler tushman congruence model ppt powerpoint presentation samples. This is a four stage process. The stages in this process are transformation process, strategy, input, work, informal organization, output, people.
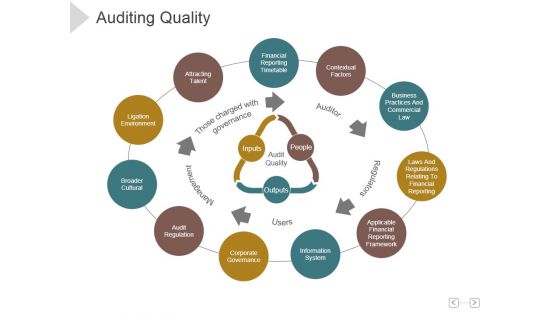
Auditing Quality Ppt PowerPoint Presentation Deck
This is a auditing quality ppt powerpoint presentation deck. This is a three stage process. The stages in this process are audit quality, inputs, outputs, people, auditor, regulators, users.

Process Mapping Sipoc Tamplate 1 Ppt PowerPoint Presentation Outline
This is a process mapping sipoc tamplate 1 ppt powerpoint presentation outline. This is a five stage process. The stages in this process are suppliers, input, process, output, customer, start, finish.

Process Mapping Sipoc Tamplate 2 Ppt PowerPoint Presentation Background Images
This is a process mapping sipoc tamplate 2 ppt powerpoint presentation background images. This is a five stage process. The stages in this process are suppliers, process, customers, input, output.

Dimensions Of Project Planning Ppt PowerPoint Presentation Styles
This is a dimensions of project planning ppt powerpoint presentation styles. This is a three stage process. The stages in this process are other planning outputs, historical information, organizational policies, constraints, assumption, project plan, supporting detail.

Break Even Analysis Ppt PowerPoint Presentation Deck
This is a break even analysis ppt powerpoint presentation deck. This is a five stage process. The stages in this process are key comments on the table, units of output, fixed cost, variable cost.
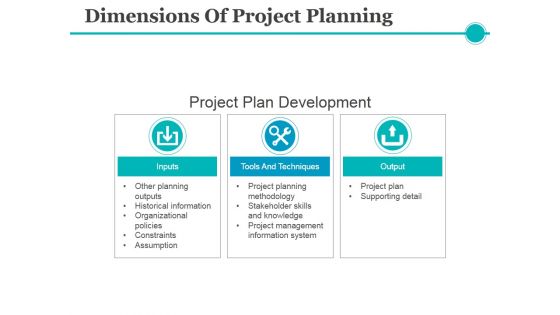
Dimensions Of Project Planning Ppt PowerPoint Presentation Gallery Professional
This is a dimensions of project planning ppt powerpoint presentation gallery professional. This is a three stage process. The stages in this process are inputs, tools and techniques, output.
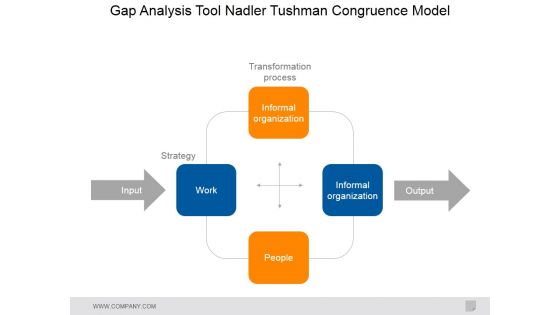
Gap Analysis Tool Nadler Tushman Congruence Model Ppt PowerPoint Presentation Slides Guidelines
This is a gap analysis tool nadler tushman congruence model ppt powerpoint presentation slides guidelines. This is a four stage process. The stages in this process are transformation process, strategy, people, output, input, work, informal organization, informal organization.

Gap Analysis Tool Nadler Tushman Congruence Model Ppt PowerPoint Presentation Styles Display
This is a gap analysis tool nadler tushman congruence model ppt powerpoint presentation styles display. This is a four stage process. The stages in this process are work, informal organization, informal organization, people, input, output.
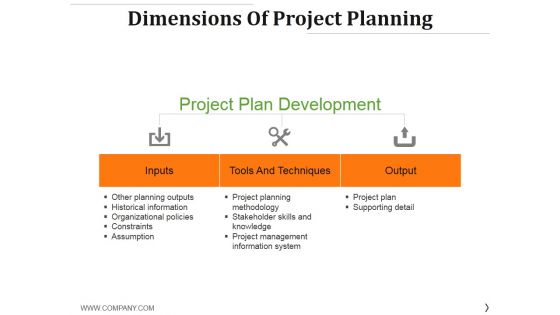
Dimensions Of Project Planning Ppt PowerPoint Presentation Model Graphic Images
This is a dimensions of project planning ppt powerpoint presentation model graphic images. This is a three stage process. The stages in this process are inputs, tools and techniques, output.
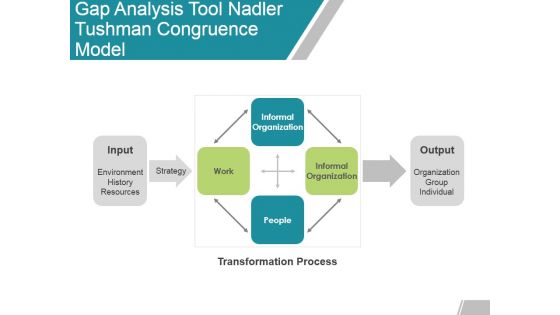
Gap Analysis Tool Nadler Tushman Congruence Model Ppt Powerpoint Presentation Outline Ideas
This is a gap analysis tool nadler tushman congruence model ppt powerpoint presentation outline ideas. This is a six stage process. The stages in this process are input, output, work, informal organization, people.
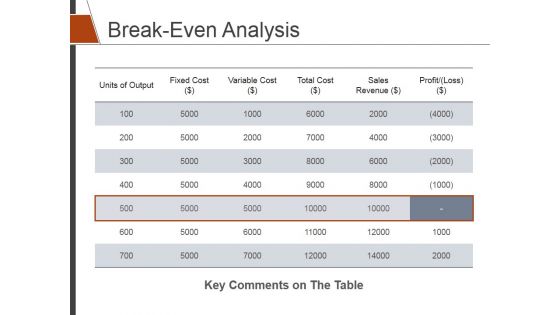
Break Even Analysis Ppt PowerPoint Presentation Summary Background Designs
This is a break even analysis ppt powerpoint presentation summary background designs. This is a five stage process. The stages in this process are units of output, fixed cost, variable cost, total cost, sales revenue.

Gap Analysis Tool Nadler Tushman Congruence Model Ppt PowerPoint Presentation Layouts Slides
This is a gap analysis tool nadler tushman congruence model ppt powerpoint presentation layouts slides. This is a four stage process. The stages in this process are input, strategy, work, people, output.
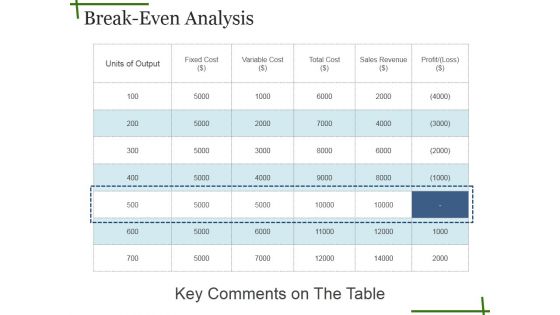
Breakeven Analysis Ppt PowerPoint Presentation Summary Example Introduction
This is a breakeven analysis ppt powerpoint presentation summary example introduction. This is a six stage process. The stages in this process are units of output, key comments on the table, data, table, analysis.
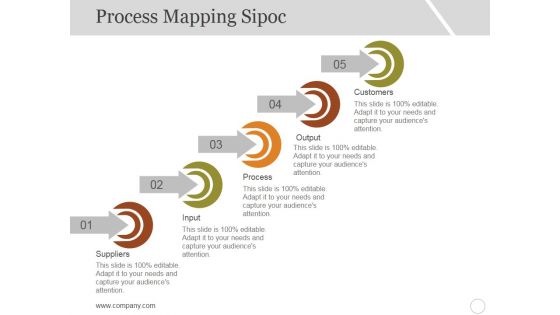
Process Mapping Sipoc Template 1 Ppt PowerPoint Presentation Layouts Example Topics
This is a process mapping sipoc template 1 ppt powerpoint presentation layouts example topics. This is a five stage process. The stages in this process are customers, output, process, input, suppliers.
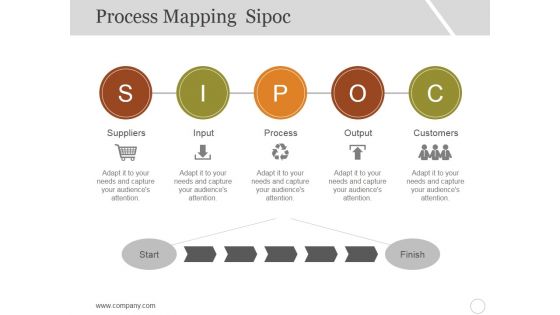
Process Mapping Sipoc Template 2 Ppt PowerPoint Presentation Show Outfit
This is a process mapping sipoc template 2 ppt powerpoint presentation show outfit. This is a five stage process. The stages in this process are suppliers, input, process, output, customers.
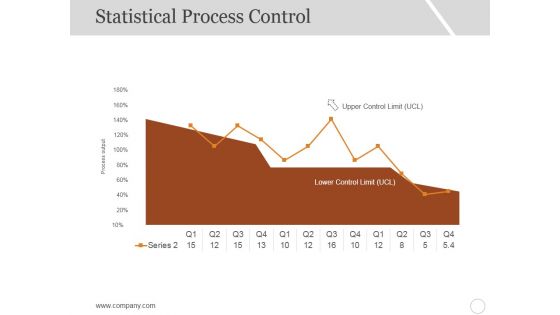
Statistical Process Control Ppt PowerPoint Presentation Portfolio Design Ideas
This is a statistical process control ppt powerpoint presentation portfolio design ideas. This is a one stage process. The stages in this process are process output, upper control limit, series, business, marketing.
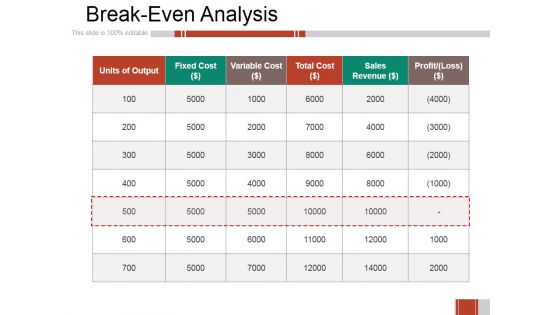
Breakeven Analysis Ppt PowerPoint Presentation Professional Design Templates
This is a breakeven analysis ppt powerpoint presentation professional design templates. This is a six stage process. The stages in this process are units of output, fixed cost, variable cost, total cost, sales revenue.

 Home
Home