Metrics

Metrics To Measure Recruitment Process By HR Department Graphics PDF
This slide shows the metrics to measure recruitment process by human resource department which covers total applications, shortlisted candidates, time to recruit, cost to hire, etc.Deliver an awe inspiring pitch with this creative Metrics To Measure Recruitment Process By HR Department Graphics PDF bundle. Topics like Applications Received, Applicant Information, Rejected Candidates can be discussed with this completely editable template. It is available for immediate download depending on the needs and requirements of the user.

Metrics To Measure Recruitment Process By HR Department Guidelines PDF
This slide shows the metrics to measure recruitment process by human resource department which covers total applications, shortlisted candidates, time to recruit, cost to hire, etc.Deliver and pitch your topic in the best possible manner with this Metrics To Measure Recruitment Process By HR Department Guidelines PDF. Use them to share invaluable insights on Applications Received, Positions Department, Applications Received and impress your audience. This template can be altered and modified as per your expectations. So, grab it now.
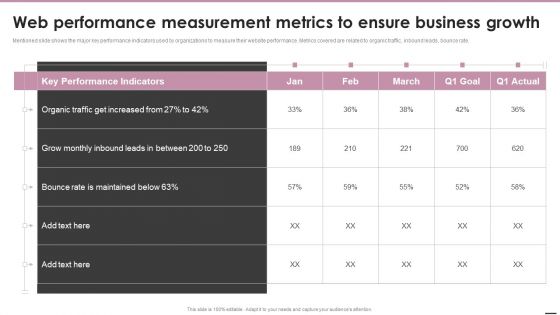
Web Performance Measurement Metrics To Ensure Business Growth Microsoft PDF
Mentioned slide shows the major key performance indicators used by organizations to measure their website performance. Metrics covered are related to organic traffic, inbound leads, bounce rate.Deliver an awe inspiring pitch with this creative Web Performance Measurement Metrics To Ensure Business Growth Microsoft PDF bundle. Topics like Performance Indicators, Organic Traffic, Rate Is Maintained can be discussed with this completely editable template. It is available for immediate download depending on the needs and requirements of the user.
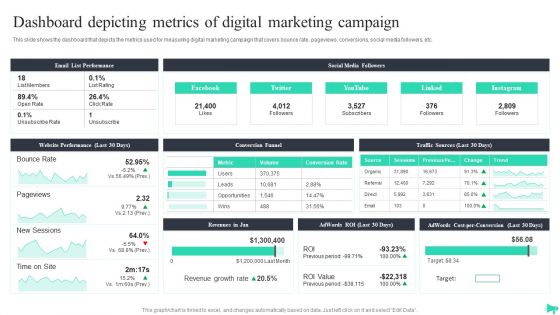
Dashboard Depicting Metrics Of Digital Marketing Campaign Topics PDF
This slide shows the dashboard that depicts the metrics used for measuring digital marketing campaign that covers bounce rate, pageviews, conversions, social media followers, etc. Presenting this PowerPoint presentation, titled Dashboard Depicting Metrics Of Digital Marketing Campaign Topics PDF, with topics curated by our researchers after extensive research. This editable presentation is available for immediate download and provides attractive features when used. Download now and captivate your audience. Presenting this Dashboard Depicting Metrics Of Digital Marketing Campaign Topics PDF. Our researchers have carefully researched and created these slides with all aspects taken into consideration. This is a completely customizable Dashboard Depicting Metrics Of Digital Marketing Campaign Topics PDF that is available for immediate downloading. Download now and make an impact on your audience. Highlight the attractive features available with our PPTs.

Dashboard Depicting Metrics Of Digital Marketing Campaign Guidelines PDF
This slide shows the dashboard that depicts the metrics used for measuring digital marketing campaign that covers bounce rate, pageviews, conversions, social media followers, etc. Presenting this PowerPoint presentation, titled Dashboard Depicting Metrics Of Digital Marketing Campaign Guidelines PDF, with topics curated by our researchers after extensive research. This editable presentation is available for immediate download and provides attractive features when used. Download now and captivate your audience. Presenting this Dashboard Depicting Metrics Of Digital Marketing Campaign Guidelines PDF. Our researchers have carefully researched and created these slides with all aspects taken into consideration. This is a completely customizable Dashboard Depicting Metrics Of Digital Marketing Campaign Guidelines PDF that is available for immediate downloading. Download now and make an impact on your audience. Highlight the attractive features available with our PPTs.
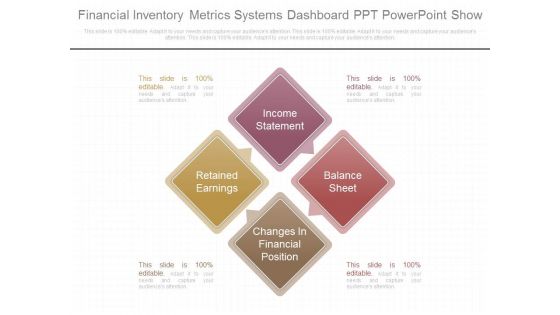
Financial Inventory Metrics Systems Dashboard Ppt Powerpoint Show
This is a financial inventory metrics systems dashboard ppt powerpoint show. This is a four stage process. The stages in this process are income statement, retained earnings, balance sheet, changes in financial position.

Advanced Email Metrics And Analysis Services Diagram Slide
This is a advanced email metrics and analysis services diagram slide. This is a four stage process. The stages in this process are analytics data warehouse, data mining, financial modeling.

Search Engine Optimization Metrics Sample Diagram Ppt Slides
This is a search engine optimization metrics sample diagram ppt slides. This is a three stage process. The stages in this process are cost, product, line chart, bar chart, pie chart.
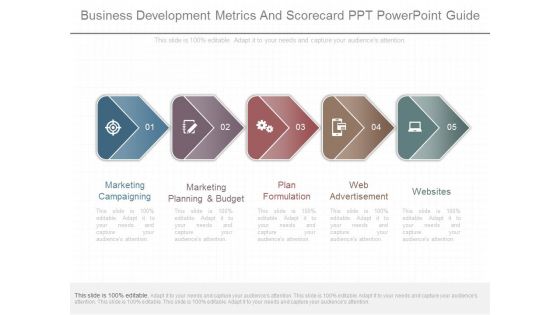
Business Development Metrics And Scorecard Ppt Powerpoint Guide
This is a business development metrics and scorecard ppt powerpoint guide. This is a five stage process. The stages in this process are marketing campaigning, marketing planning and budget, plan formulation, web advertisement, websites.
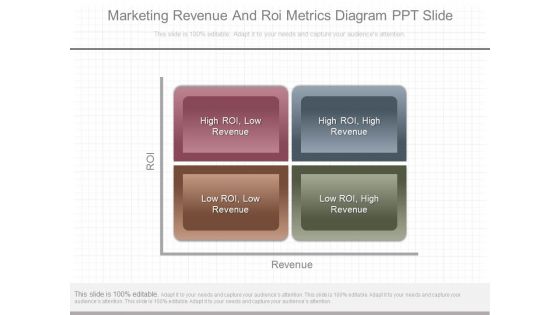
Marketing Revenue And Roi Metrics Diagram Ppt Slide
This is a marketing revenue and roi metrics diagram ppt slide. This is a four stage process. The stages in this process are high roi, low revenue, high roi, high revenue, low roi, low revenue, low roi, high revenue.
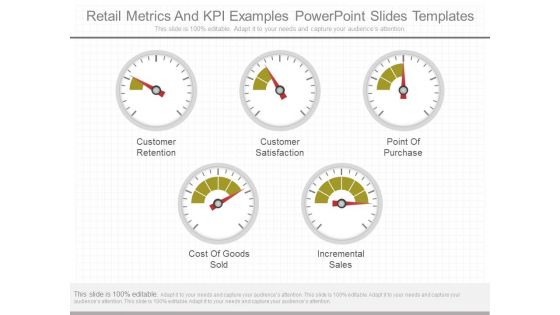
Retail Metrics And Kpi Examples Powerpoint Slides Templates
This is a retail metrics and kpi examples powerpoint slides templates. This is a five stage process. The stages in this process are customer retention, customer satisfaction, point of purchase, cost of goods sold, incremental sales.
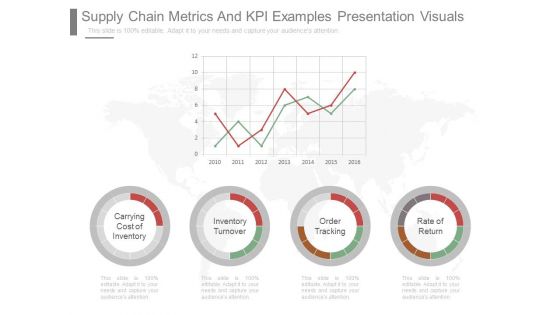
Supply Chain Metrics And Kpi Examples Presentation Visuals
This is a supply chain metrics and kpi examples presentation visuals. This is a four stage process. The stages in this process are carrying cost of inventory, inventory turnover, order tracking, rate of return.
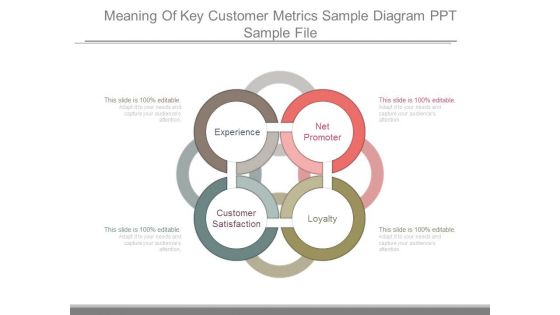
Meaning Of Key Customer Metrics Sample Diagram Ppt Sample File
This is a meaning of key customer metrics sample diagram ppt sample file. This is a four stage process. The stages in this process are net promoter, loyalty, customer satisfaction, experience.
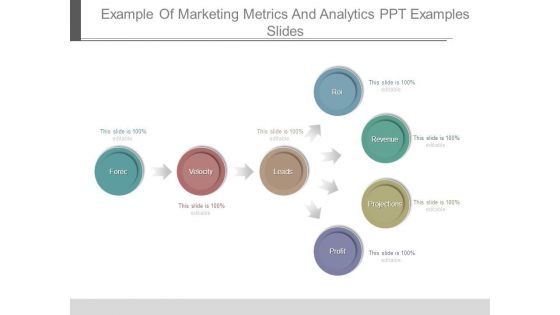
Example Of Marketing Metrics And Analytics Ppt Examples Slides
This is a example of marketing metrics and analytics ppt examples slides. This is a seven stage process. The stages in this process are forec, velocity, leads, roi, revenue, projections, profit.
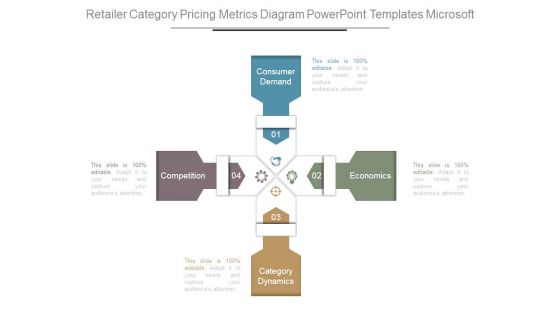
Retailer Category Pricing Metrics Diagram Powerpoint Templates Microsoft
This is a retailer category pricing metrics diagram powerpoint templates microsoft. This is a four stage process. The stages in this process are competition, consumer demand, economics, category dynamics.
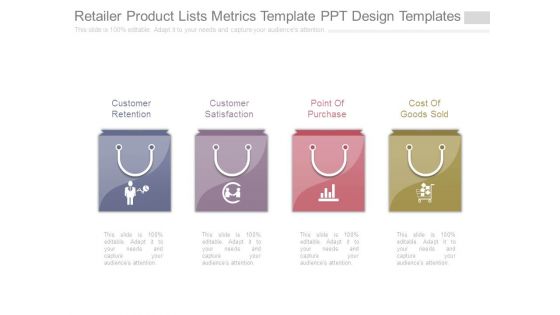
Retailer Product Lists Metrics Template Ppt Design Templates
This is a retailer product lists metrics template ppt design templates. This is a four stage process. The stages in this process are customer retention, customer satisfaction, point of purchase, cost of goods sold.

Our Key Metrics For Money Flow Ppt Slide
This is a our key metrics for money flow ppt slide. This is a five stage process. The stages in this process are cash flow, productivity, customer satisfaction, turnover, net income.

Customer Support And Services Metrics Powerpoint Slide Show
This is a customer support and services metrics powerpoint slide show. This is a four stage process. The stages in this process are rep activity, team efficiency, churn prevention, product development.
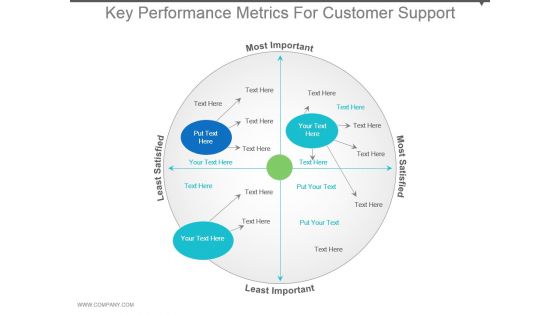
Key Performance Metrics For Customer Support Powerpoint Templates
This is a key performance metrics for customer support powerpoint templates. This is a one stage process. The stages in this process are most important, least satisfied, least important, most satisfied.

Setting Campaign Metrics Ppt PowerPoint Presentation Slide Download
This is a setting campaign metrics ppt powerpoint presentation slide download. This is a five stage process. The stages in this process are icons, process, strategy, business, marketing, management.

Key Sales Performance Metrics Ppt PowerPoint Presentation Samples
This is a key sales performance metrics ppt powerpoint presentation samples. This is a four stage process. The stages in this process are campaigns to drive traffic, visitors, trials, closed deals.
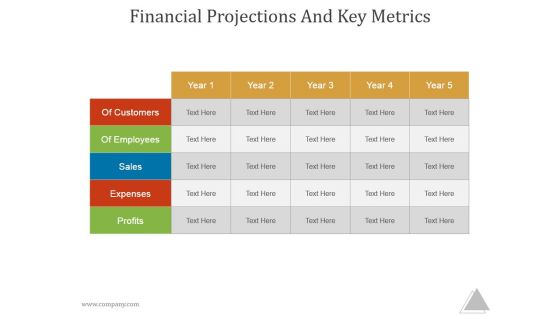
Financial Projections And Key Metrics Ppt PowerPoint Presentation Samples
This is a financial projections and key metrics ppt powerpoint presentation samples. This is a five stage process. The stages in this process are of customers, year, of employees, sales, expenses.

Financial Projection And Key Metrics Ppt PowerPoint Presentation Images
This is a financial projection and key metrics ppt powerpoint presentation images. This is a five stage process. The stages in this process are business, strategy, marketing, success, analysis, table.

Financial Projections And Key Metrics Ppt PowerPoint Presentation Designs
This is a financial projections and key metrics ppt powerpoint presentation designs. This is a five stage process. The stages in this process are profits, expenses, sales, of employees, of customers.
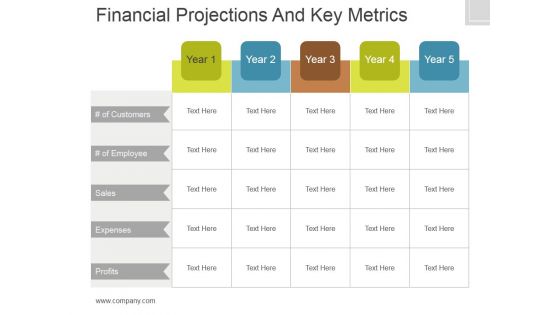
Financial Projections And Key Metrics Ppt PowerPoint Presentation Show
This is a financial projections and key metrics ppt powerpoint presentation show. This is a five stage process. The stages in this process are of customers, sales, expenses, profits.

Financial Projections And Key Metrics Ppt PowerPoint Presentation Professional
This is a financial projections and key metrics ppt powerpoint presentation professional. This is a five stage process. The stages in this process are customers, employees, sales, expenses, profits.
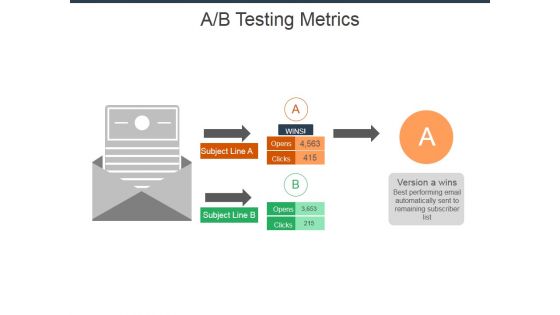
A B Testing Metrics Ppt Powerpoint Presentation Professional Format
This is a a b testing metrics ppt powerpoint presentation professional format. This is a four stage process. The stages in this process are subject line, opens, clicks, version a wins.

Financial Projections And Key Metrics Ppt PowerPoint Presentation Styles Skills
This is a financial projections and key metrics ppt powerpoint presentation styles skills. This is a five stage process. The stages in this process are expenses, profits, sales, employees, years.

Social Media Metrics Ppt PowerPoint Presentation Professional Graphic Images
This is a social media metrics ppt powerpoint presentation professional graphic images. This is a eight stage process. The stages in this process are fans count, google, followers, you tube subscribe, engagement rate.

Setting Campaign Metrics Ppt PowerPoint Presentation Slides File Formats
This is a setting campaign metrics ppt powerpoint presentation slides file formats. This is a five stage process. The stages in this process are business, marketing, management, icons, strategy.
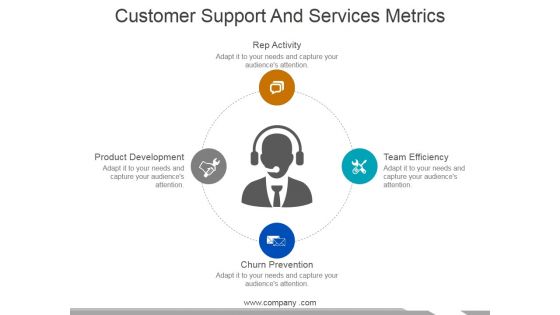
Customer Support And Services Metrics Ppt PowerPoint Presentation Infographics Ideas
This is a customer support and services metrics ppt powerpoint presentation infographics ideas. This is a four stage process. The stages in this process are rep activity, team efficiency, churn prevention, product development.
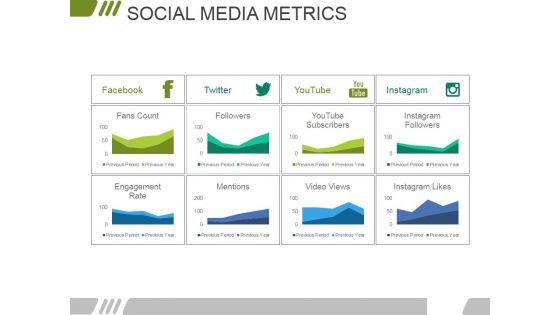
Social Media Metrics Ppt PowerPoint Presentation Infographics Gallery
This is a social media metrics ppt powerpoint presentation infographics gallery. This is a four stage process. The stages in this process are facebook, twitter, youtube, instagram, fans count.
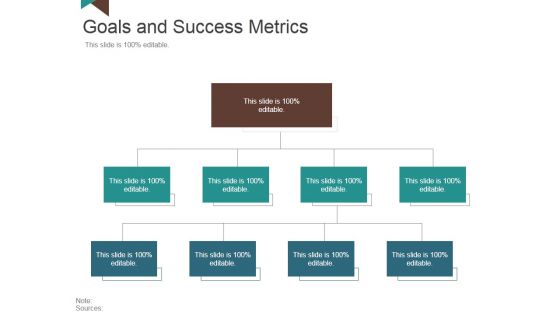
Goals And Success Metrics Ppt PowerPoint Presentation Professional Ideas
This is a goals and success metrics ppt powerpoint presentation professional ideas. This is a three stage process. The stages in this process are business, strategy, marketing, management, planning.

Key Evaluation Metrics Ppt PowerPoint Presentation File Design Ideas
This is a key evaluation metrics ppt powerpoint presentation file design ideas. This is a five stage process. The stages in this process are business, icons, strategy, marketing, finance.
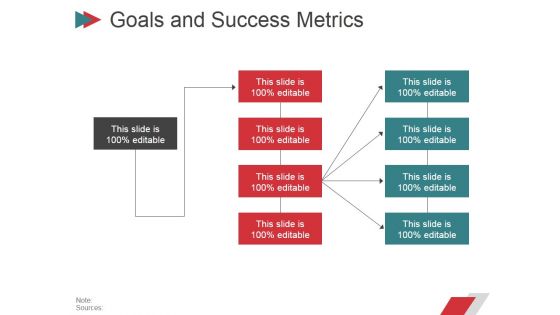
Goals And Success Metrics Ppt PowerPoint Presentation Ideas Guide
This is a goals and success metrics ppt powerpoint presentation ideas guide. This is a eight stage process. The stages in this process are business, strategy, marketing, planning, arrow.

Social Media Metrics Ppt PowerPoint Presentation Styles Topics
This is a social media metrics ppt powerpoint presentation styles topics. This is a eight stage process. The stages in this process are fans count, followers, subscribers, engagement rate, mentions, video views, likes.
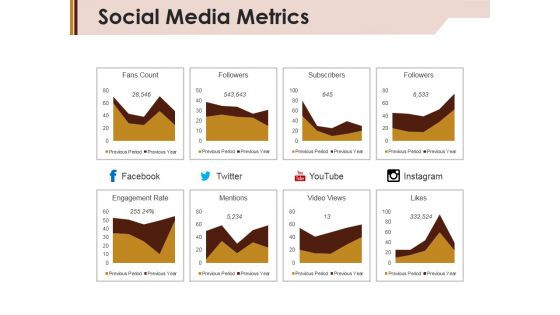
Social Media Metrics Ppt PowerPoint Presentation Ideas Graphics Example
This is a social media metrics ppt powerpoint presentation ideas graphics example. This is a eight stage process. The stages in this process are fans count, followers, subscribers, engagement rate.
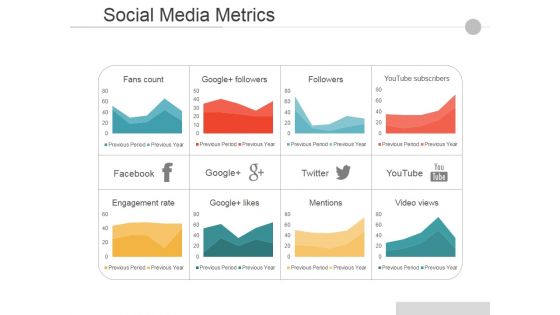
Social Media Metrics Ppt PowerPoint Presentation Gallery Background Images
This is a Social Media Metrics Ppt PowerPoint Presentation Gallery Background Images. This is a eight stage process. The stages in this process are Facebook, Google, Twitter, Youtube, Engagement Rate.

Our Global Performance Metrics Ppt PowerPoint Presentation Infographics Format
This is a our global performance metrics ppt powerpoint presentation infographics format. This is a five stage process. The stages in this process are north, south, africa, australia, america.

Our Global Performance Metrics Ppt PowerPoint Presentation Gallery Example File
This is a our global performance metrics ppt powerpoint presentation gallery example file. This is a four stage process. The stages in this process are china, usa, brazil, australia.

Key Sales Performance Metrics Ppt PowerPoint Presentation Slides Designs
This is a key sales performance metrics ppt powerpoint presentation slides designs. This is a four stage process. The stages in this process are campaigns to drive traffic, visitors, trials, closed deals.

Social Media Metrics Ppt PowerPoint Presentation Infographic Template Graphics Example
This is a social media metrics ppt powerpoint presentation infographic template graphics example. This is a eight stage process. The stages in this process are facebook, twitter, youtube, fans count, instagram.
Our Key Metrics Ppt PowerPoint Presentation Icon Slide
This is a our key metrics ppt powerpoint presentation icon slide. This is a five stage process. The stages in this process are cash flow, turnover, productivity, net income, customer satisfaction .
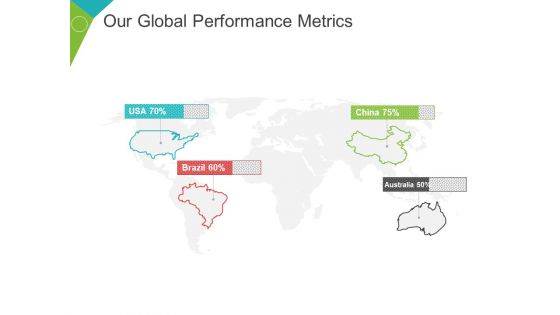
Our Global Performance Metrics Ppt PowerPoint Presentation Summary Grid
This is a our global performance metrics ppt powerpoint presentation summary grid. This is a four stage process. The stages in this process are usa, brazil, china, australia, percentage.
Key Evaluation Metrics Ppt PowerPoint Presentation Layouts Icons
This is a key evaluation metrics ppt powerpoint presentation layouts icons. This is a five stage process. The stages in this process are business, icons, marketing, strategy, finance, analysis.

Social Media Metrics Ppt PowerPoint Presentation Portfolio Tips
This is a social media metrics ppt powerpoint presentation portfolio tips. This is a eight stage process. The stages in this process are business, finance, growth, strategy, analysis, investment.

Key Sales Performance Metrics Ppt PowerPoint Presentation Styles Influencers
This is a key sales performance metrics ppt powerpoint presentation styles influencers. This is a four stage process. The stages in this process are campaigns to drive traffic, visitors, trials, closed deals.
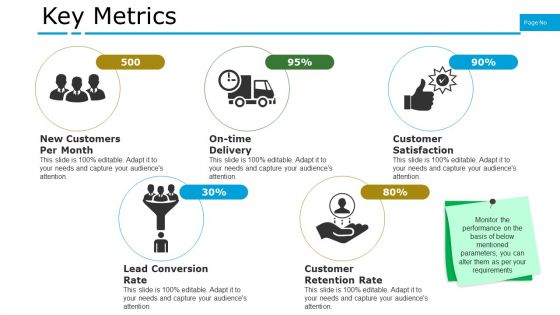
Key Metrics Ppt PowerPoint Presentation Infographics Example Topics
This is a key metrics ppt powerpoint presentation infographics example topics. This is a five stage process. The stages in this process are new customers per month, on time delivery, customer satisfaction, lead conversion rate, customer retention rate.
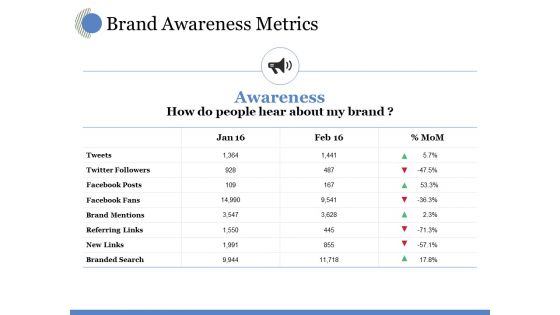
Brand Awareness Metrics Ppt PowerPoint Presentation File Formats
This is a brand awareness metrics ppt powerpoint presentation file formats. This is a four stage process. The stages in this process are twitter followers, facebook posts, facebook fans, brand mentions, new links.

Brand Awareness Metrics Ppt PowerPoint Presentation Layouts Portfolio
This is a brand awareness metrics ppt powerpoint presentation layouts portfolio. This is a four stage process. The stages in this process are twitter followers, facebook posts, facebook fans, brand mentions, referring links.

Key Sales Performance Metrics Ppt PowerPoint Presentation Layouts Graphics Template
This is a key sales performance metrics ppt powerpoint presentation layouts graphics template. This is a four stage process. The stages in this process are campaigns to drive traffic, trials, visitors, closed deals, icons.
Key Sales Performance Metrics Ppt PowerPoint Presentation Icon Design Templates
This is a key sales performance metrics ppt powerpoint presentation icon design templates. This is a four stage process. The stages in this process are campaigns to drive traffic, visitors, trials, closed deals, business.
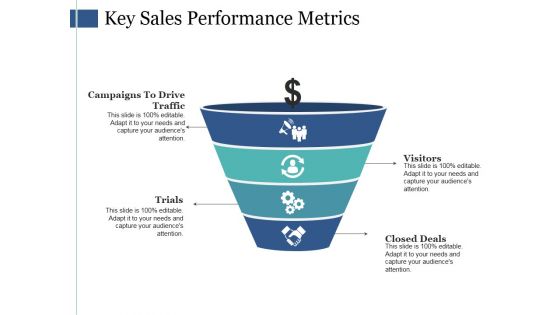
Key Sales Performance Metrics Ppt PowerPoint Presentation Show Demonstration
This is a key sales performance metrics ppt powerpoint presentation show demonstration. This is a four stage process. The stages in this process are campaigns to drive traffic, trials, visitors, closed deals.
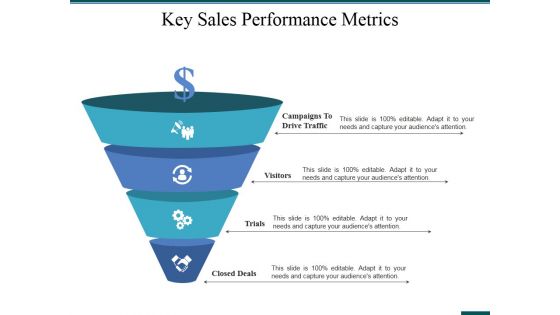
Key Sales Performance Metrics Ppt PowerPoint Presentation Infographic Template Samples
This is a key sales performance metrics ppt powerpoint presentation infographic template samples. This is a four stage process. The stages in this process are campaigns to drive traffic, visitors, trials, closed deals.

Key Sales Performance Metrics Ppt PowerPoint Presentation Professional Styles
This is a key sales performance metrics ppt powerpoint presentation professional styles. This is a four stage process. The stages in this process are visitors, trials, closed deals, campaigns to drive traffic, icons.
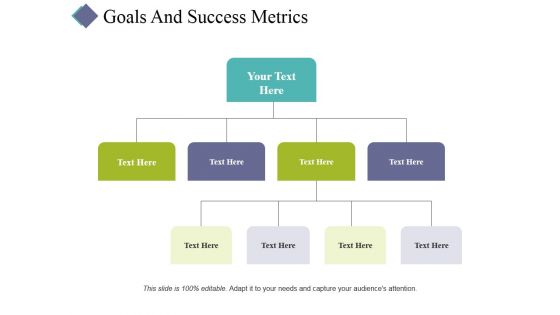
Goals And Success Metrics Ppt PowerPoint Presentation Pictures Shapes
This is a goals and success metrics ppt powerpoint presentation pictures shapes. This is a four stage process. The stages in this process are business, process, management, strategy, analysis.
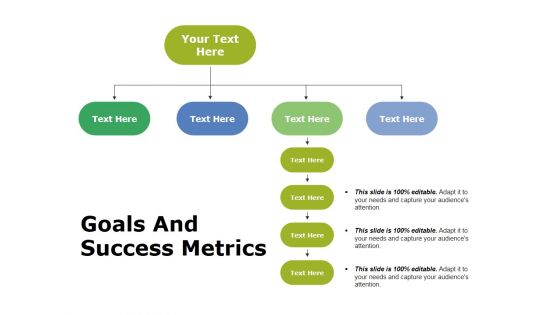
Goals And Success Metrics Ppt PowerPoint Presentation Layouts Design Templates
This is a goals and success metrics ppt powerpoint presentation layouts design templates. This is a four stage process. The stages in this process are goals, marketing, success, planning, strategy.
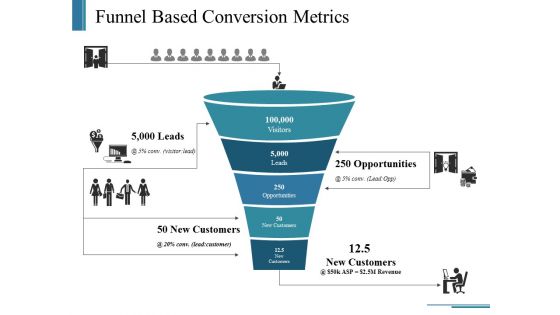
Funnel Based Conversion Metrics Ppt PowerPoint Presentation Outline Layouts
This is a funnel based conversion metrics ppt powerpoint presentation outline layouts. This is a five stage process. The stages in this process are visitors, leads, opportunities, new customers, business.
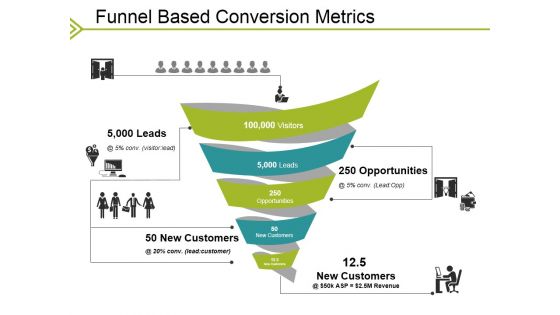
Funnel Based Conversion Metrics Ppt PowerPoint Presentation Infographics Slideshow
This is a funnel based conversion metrics ppt powerpoint presentation infographics slideshow. This is a five stage process. The stages in this process are business, visitors, leads, opportunities, new customers.

Funnel Based Conversion Metrics Ppt PowerPoint Presentation Layouts Graphics Example
This is a funnel based conversion metrics ppt powerpoint presentation layouts graphics example. This is a five stage process. The stages in this process are leads, opportunities, new customers, visitors.

 Home
Home