Metrics
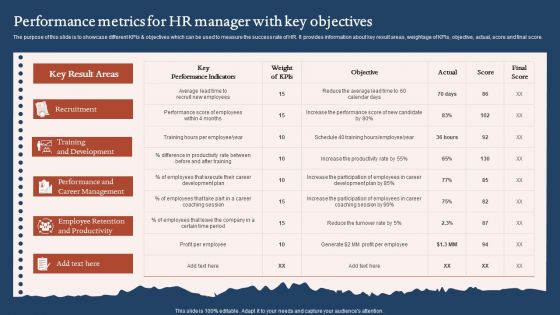
Performance Metrics For HR Manager With Key Objectives Demonstration PDF
The purpose of this slide is to showcase different KPIs and objectives which can be used to measure the success rate of HR. It provides information about key result areas, weightage of KPIs, objective, actual, score and final score. Showcasing this set of slides titled Performance Metrics For HR Manager With Key Objectives Demonstration PDF. The topics addressed in these templates are Training And Development, Recruitment, Performance Career Management. All the content presented in this PPT design is completely editable. Download it and make adjustments in color, background, font etc. as per your unique business setting.
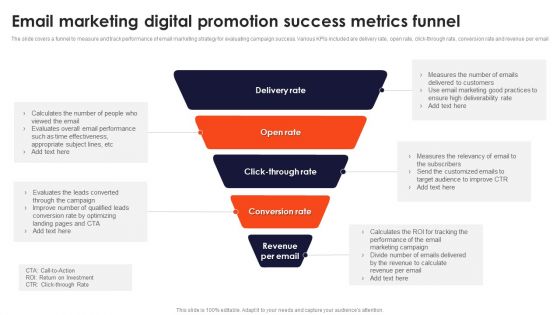
Email Marketing Digital Promotion Success Metrics Funnel Infographics PDF
The slide covers a funnel to measure and track performance of email marketing strategy for evaluating campaign success. Various KPIs included are delivery rate, open rate, click-through rate, conversion rate and revenue per email. Presenting Email Marketing Digital Promotion Success Metrics Funnel Infographics PDF to dispense important information. This template comprises Four stages. It also presents valuable insights into the topics including Delivery Rate, Open Rate, Conversion Rate. This is a completely customizable PowerPoint theme that can be put to use immediately. So, download it and address the topic impactfully.
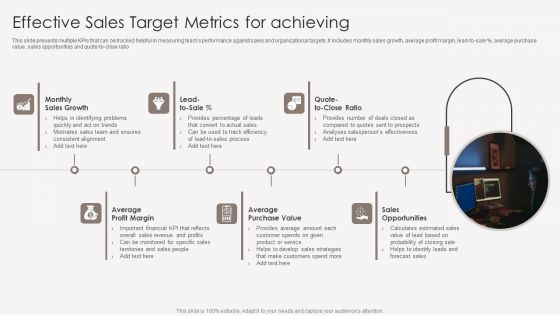
Effective Sales Target Metrics For Achieving Elements PDF
This slide presents multiple KPIs that can be tracked helpful in measuring teams performance against sales and organizational targets. It includes monthly sales growth, average profit margin, lead to sale, average purchase value, sales opportunities and quote to close ratio. Presenting Effective Sales Target Metrics For Achieving Elements PDF to dispense important information. This template comprises six stages. It also presents valuable insights into the topics including Monthly Sales Growth, Average Purchase Value, Sales Opportunities. This is a completely customizable PowerPoint theme that can be put to use immediately. So, download it and address the topic impactfully.
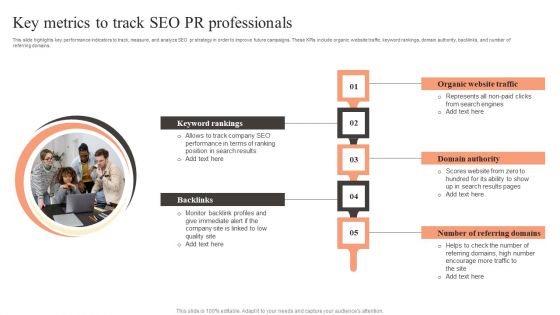
Key Metrics To Track SEO PR Professionals Guidelines PDF
This slide highlights key performance indicators to track, measure, and analyze SEO pr strategy in order to improve future campaigns. These KPIs include organic website traffic, keyword rankings, domain authority, backlinks, and number of referring domains. Introducing Key Metrics To Track SEO PR Professionals Guidelines PDF. to increase your presentation threshold. Encompassed with five stages, this template is a great option to educate and entice your audience. Dispence information on Keyword Rankings, Backlinks, Domain Authority, using this template. Grab it now to reap its full benefits.

Metrics To Improve Venture Capital Investment Performance Information PDF
This slide showcases various KPIs to measure performance of venture capital funds for analyzing business operations improvement areas. It includes key components such as key performance indicators, actual performance, benchmarked performance and strategies to improve. Pitch your topic with ease and precision using this Metrics To Improve Venture Capital Investment Performance Information PDF. This layout presents information on Actual, Strategies Improve, Benchmark. It is also available for immediate download and adjustment. So, changes can be made in the color, design, graphics or any other component to create a unique layout.
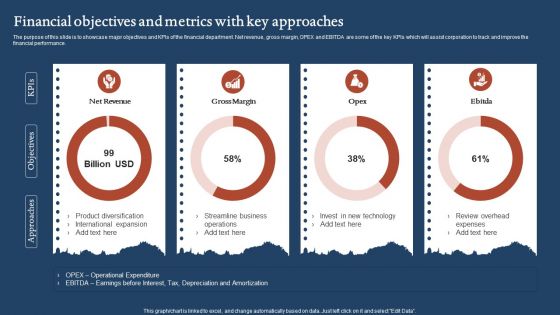
Financial Objectives And Metrics With Key Approaches Portrait PDF
The purpose of this slide is to showcase major objectives and KPIs of the financial department. Net revenue, gross margin, OPEX and EBITDA are some of the key KPIs which will assist corporation to track and improve the financial performance. Showcasing this set of slides titled Financial Objectives And Metrics With Key Approaches Portrait PDF. The topics addressed in these templates are Net Revenue, Gross Margin, Streamline Business. All the content presented in this PPT design is completely editable. Download it and make adjustments in color, background, font etc. as per your unique business setting.

Manufacturing Metrics And Objectives To Track Operational Success Formats PDF
The purpose of this slide is to showcase different objectives and KPIs which can be used to track the manufacturing performance. The slide covers information about objectives, issues discovered after factory diagnosis, KPIs, current and target value. Showcasing this set of slides titled Manufacturing Metrics And Objectives To Track Operational Success Formats PDF. The topics addressed in these templates are Manufacturing Objectives, Key Performance Indicator, Target Value. All the content presented in this PPT design is completely editable. Download it and make adjustments in color, background, font etc. as per your unique business setting.

Marketing Objectives And Metrics With Key Strategies Formats PDF
The purpose of this slide is to showcase different objectives and KPIs of the marketing team. The KPI could be customer lifetime value digital marketing ROI landing page conversion rate and lead to customer ratio. Pitch your topic with ease and precision using this Marketing Objectives And Metrics With Key Strategies Formats PDF. This layout presents information on Key Strategies, Conversion Rate, Customer Lifetime Value. It is also available for immediate download and adjustment. So, changes can be made in the color, design, graphics or any other component to create a unique layout.
Metrics Scorecard With Internal Objectives And Customer Satisfaction Icons PDF
The purpose of this slide is to showcase different KPIs for company business. Information covered in this slide is related to financial status, business growth, internal objectives and customer satisfaction. Showcasing this set of slides titled Metrics Scorecard With Internal Objectives And Customer Satisfaction Icons PDF. The topics addressed in these templates are Financial Status, Customer Satisfaction, Internal Objectives. All the content presented in this PPT design is completely editable. Download it and make adjustments in color, background, font etc. as per your unique business setting.

Performance Metrics Dashboard Highlighting Retail Objectives Sample PDF
The purpose of this slide is to showcase an effective KPI dashboard which can assist store manager to evaluate retail business objectives. The KPIs are sales per square foot, average transaction value, sales per employee, and inventory shrinkage. Pitch your topic with ease and precision using this Performance Metrics Dashboard Highlighting Retail Objectives Sample PDF. This layout presents information on Average Transaction Value, Sales Per Employee. It is also available for immediate download and adjustment. So, changes can be made in the color, design, graphics or any other component to create a unique layout.

Performance Metrics With Key Business Objectives Guidelines PDF
The purpose of this slide is to showcase various objectives and KPIs which can be used to evaluate the business performance. The key objectives are awareness, engagement, lead generation, demand generation, customer support and advocacy. Pitch your topic with ease and precision using this Performance Metrics With Key Business Objectives Guidelines PDF. This layout presents information on Social Community Growth, Cost Per Acquisition, Customer Support. It is also available for immediate download and adjustment. So, changes can be made in the color, design, graphics or any other component to create a unique layout.
Customer Service Metrics Dashboard With Customer Retention Rate Icons PDF
This slide showcases KPIs dashboard for customer service that can help organization to track the consumer satisfaction score and improve product or service by improving customer loyalty. Its key components are net promoter score, customer retention and support costs. Showcasing this set of slides titled Customer Service Metrics Dashboard With Customer Retention Rate Icons PDF. The topics addressed in these templates are Customer Retention, Net Promoter Score, Service Level. All the content presented in this PPT design is completely editable. Download it and make adjustments in color, background, font etc. as per your unique business setting.

Critical Violations Security Dashboard With KPI Metrics Graphics PDF
This slide shows dashboard of security to mitigate violation by prioritizing KPIs. It includes application control, operating systems, restrict admin privileges, multi factor authentication and backup of important data. Showcasing this set of slides titled Critical Violations Security Dashboard With KPI Metrics Graphics PDF. The topics addressed in these templates are Risk Model, Application Components, Technologies Overview. All the content presented in this PPT design is completely editable. Download it and make adjustments in color, background, font etc. as per your unique business setting.
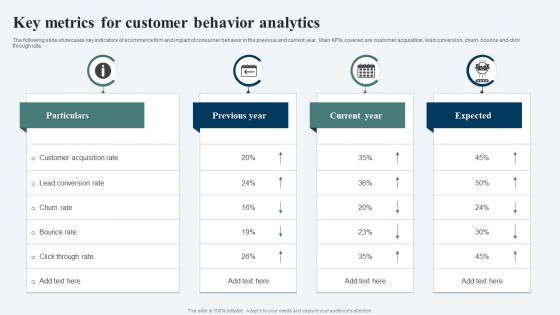
Key Metrics For Customer Behavior Analytics Ppt Model Introduction PDF
The following slide showcases key indicators of ecommerce firm and impact of consumer behavior in the previous and current year. Main KPIs covered are customer acquisition, lead conversion, churn, bounce and click through rate. Showcasing this set of slides titled Key Metrics For Customer Behavior Analytics Ppt Model Introduction PDF. The topics addressed in these templates are Particulars, Previous Year, Current Year. All the content presented in this PPT design is completely editable. Download it and make adjustments in color, background, font etc. as per your unique business setting.

Organizations Performance Management Pyramid With Key Metrics Professional PDF
This slide represents the pyramid showcasing the overall performance of the organization. It includes details related to the vision, strategy, objectives, csfs, kpis and actions taken by the organization to increase its performance. Presenting Organizations Performance Management Pyramid With Key Metrics Professional PDF to dispense important information. This template comprises six stages. It also presents valuable insights into the topics including Strategy, Vision, Objectives. This is a completely customizable PowerPoint theme that can be put to use immediately. So, download it and address the topic impactfully.
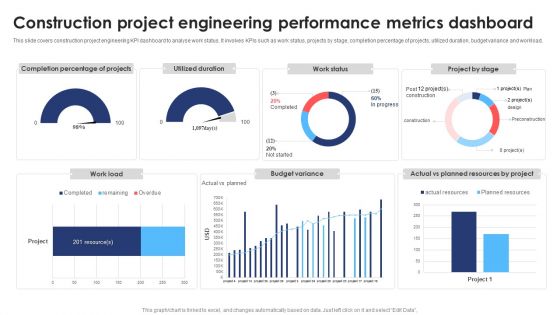
Construction Project Engineering Performance Metrics Dashboard Ideas PDF
This slide covers construction project engineering KPI dashboard to analyse work status. It involves KPIs such as work status, projects by stage, completion percentage of projects, utilized duration, budget variance and workload. Showcasing this set of slides titled Construction Project Engineering Performance Metrics Dashboard Ideas PDF. The topics addressed in these templates are Budget Variance, Resource, Project. All the content presented in this PPT design is completely editable. Download it and make adjustments in color, background, font etc. as per your unique business setting.
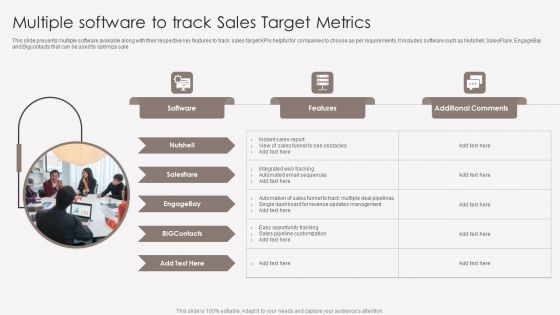
Multiple Software To Track Sales Target Metrics Infographics PDF
This slide presents multiple software available along with their respective key features to track sales target KPIs helpful for companies to choose as per requirements. It includes software such as Nutshell, SalesFlare, EngageBay and Bigcontacts that can be used to optimize sale. Presenting Multiple Software To Track Sales Target Metrics Infographics PDF to dispense important information. This template comprises four stages. It also presents valuable insights into the topics including Software, Features, Additional Comments. This is a completely customizable PowerPoint theme that can be put to use immediately. So, download it and address the topic impactfully.

Target Sales Target Metrics For Sales Representatives Performance Ideas PDF
This slide presents multiple KPIs that can be used to evaluate performance of sales representatives performance in achieving targets. It includes monthly sales growth, sales targets, sales per rep, sales by contact method, sales closing ratio and sales by region or location. Persuade your audience using this Target Sales Target Metrics For Sales Representatives Performance Ideas PDF. This PPT design covers six stages, thus making it a great tool to use. It also caters to a variety of topics including Monthly Sales Growth, Sales Closing Ratio, Region Or Location. Download this PPT design now to present a convincing pitch that not only emphasizes the topic but also showcases your presentation skills.

Fleet Management Operations Metrics For Logistics Organization Graphics PDF
This slide exhibits logistics operations KPIs dashboard for fleet management. It includes vehicle status, maintenance cost, fuel cost, cost breakdown, and insurance by vehicle type. Pitch your topic with ease and precision using this Fleet Management Operations Metrics For Logistics Organization Graphics PDF. This layout presents information on Cost Breakdown, Vehicle Status, Vehicle By Life Span. It is also available for immediate download and adjustment. So, changes can be made in the color, design, graphics or any other component to create a unique layout.
Shipping Delivery Tracking Metrics Analysis Dashboard Structure PDF
This template illustrates the KPI dashboard for tracking shipment orders. It also includes shipment analysis based on different KPIs such as ongoing delivery, completed delivery, on-time delivery, actual delivery duration, and variance between expected and actual delivery time. Pitch your topic with ease and precision using this Shipping Delivery Tracking Metrics Analysis Dashboard Structure PDF. This layout presents information on Recipient Country, Completed Deliveries, Delivery Duration. It is also available for immediate download and adjustment. So, changes can be made in the color, design, graphics or any other component to create a unique layout.
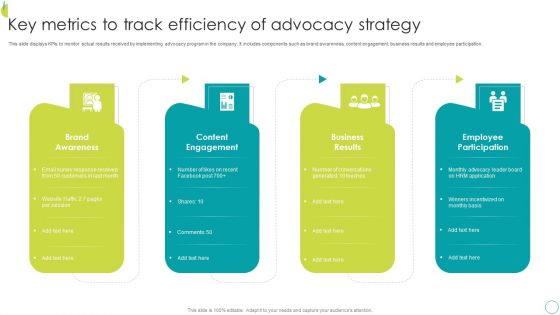
Key Metrics To Track Efficiency Of Advocacy Strategy Brochure PDF
This slide displays KPIs to monitor actual results received by implementing advocacy program in the company. It includes components such as brand awareness, content engagement, business results and employee participation. Presenting Key Metrics To Track Efficiency Of Advocacy Strategy Brochure PDF to dispense important information. This template comprises four stages. It also presents valuable insights into the topics including Strategy, Efficiency, Advocacy. This is a completely customizable PowerPoint theme that can be put to use immediately. So, download it and address the topic impactfully.
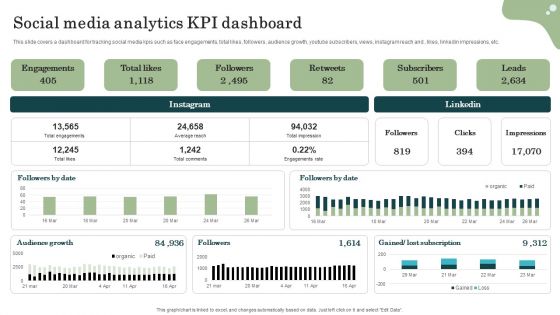
Marketing Success Metrics Social Media Analytics KPI Dashboard Elements PDF
This slide covers a dashboard for tracking social media kpis such as face engagements, total likes, followers, audience growth, youtube subscribers, views, instagram reach and , likes, linkedin impressions, etc. Find a pre-designed and impeccable Marketing Success Metrics Social Media Analytics KPI Dashboard Elements PDF. The templates can ace your presentation without additional effort. You can download these easy-to-edit presentation templates to make your presentation stand out from others. So, what are you waiting for Download the template from Slidegeeks today and give a unique touch to your presentation.

Digital Marketing Toolkit Marketing Campaigns Transformation Success Metrics Rules PDF
This slide covers the campaign success KPIs such as user acquisition, new users and sessions, user behaviour such as bounce rate, page sessions, average session duration, conversion rate, completion and value for organic, social, direct and referral traffic. Make sure to capture your audiences attention in your business displays with our gratis customizable Digital Marketing Toolkit Marketing Campaigns Transformation Success Metrics Rules PDF. These are great for business strategies, office conferences, capital raising or task suggestions. If you desire to acquire more customers for your tech business and ensure they stay satisfied, create your own sales presentation with these plain slides.
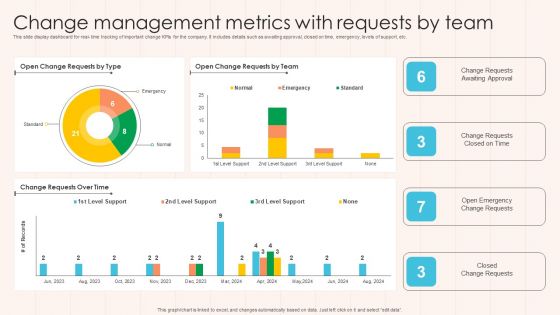
Change Management Metrics With Requests By Team Designs PDF
This slide display dashboard for real- time tracking of important change KPIs for the company. It includes details such as awaiting approval, closed on time, emergency, levels of support, etc. Pitch your topic with ease and precision using this Change Management Metrics With Requests By Team Designs PDF This layout presents information on Change Requests, Approval, Team. It is also available for immediate download and adjustment. So, changes can be made in the color, design, graphics or any other component to create a unique layout.
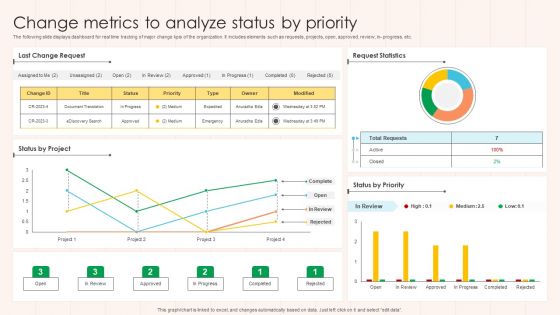
Change Metrics To Analyze Status By Priority Formats PDF
The following slide displays dashboard for real time tracking of major change kpis of the organization. It includes elements such as requests, projects, open, approved, review, in- progress, etc. Pitch your topic with ease and precision using this Change Metrics To Analyze Status By Priority Formats PDF This layout presents information on Project, Request Statistics, Priority. It is also available for immediate download and adjustment. So, changes can be made in the color, design, graphics or any other component to create a unique layout.
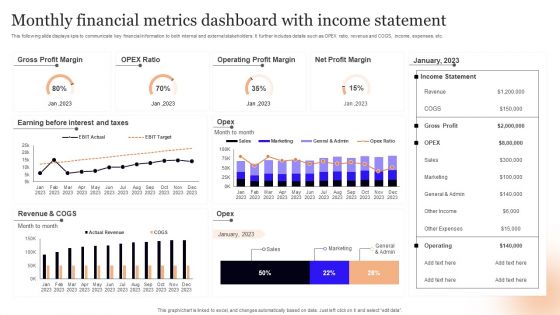
Monthly Financial Metrics Dashboard With Income Statement Infographics PDF
This following slide displays kpis to communicate key financial information to both internal and external stakeholders. It further includes details such as OPEX ratio, revenue and COGS, income, expenses, etc. Showcasing this set of slides titled Monthly Financial Metrics Dashboard With Income Statement Infographics PDF. The topics addressed in these templates are Gross Profit Margin, Taxes, Revenue. All the content presented in this PPT design is completely editable. Download it and make adjustments in color, background, font etc. as per your unique business setting.

HR Metrics With Benchmark And Actual Progress Background PDF
This slide showcases HR KPIs that are average employee tenure, absenteeism rate, average cost of hire, training cost per employee and retention rate. It also showcases comparison of benchmark and actual values plus improvement strategies to achieve the desired results. Presenting HR Metrics With Benchmark And Actual Progress Background PDF to dispense important information. This template comprises one stages. It also presents valuable insights into the topics including Average Employee Tenure, Absenteeism Rate, Average Cost Hire. This is a completely customizable PowerPoint theme that can be put to use immediately. So, download it and address the topic impactfully.

Human Resource Metrics Dashboard With Cost Per Hire Portrait PDF
This slide showcases dashboard for human resource KPIs that can help HR manager to keep track of key performance indicators and hiring expenses. Its key elements are employee count, hiring process satisfaction rate, average time to hire, offer acceptance rate, average time to hire and cost per hire. Showcasing this set of slides titled Human Resource Metrics Dashboard With Cost Per Hire Portrait PDF. The topics addressed in these templates are Employee Count, Offer Acceptance Rate, Cost Per Hire. All the content presented in this PPT design is completely editable. Download it and make adjustments in color, background, font etc. as per your unique business setting.

Human Resource Metrics Dashboard With Engagement Index Guidelines PDF
This slide showcases dashboard of human resource that can help HR manager to track change in KPIs as compared to previous month. Its key components are training effectiveness, 90 days quit rate and acceptance ratio. Pitch your topic with ease and precision using this Human Resource Metrics Dashboard With Engagement Index Guidelines PDF. This layout presents information on Absence Rate, Absence Cost, Benefits Satisfaction. It is also available for immediate download and adjustment. So, changes can be made in the color, design, graphics or any other component to create a unique layout.
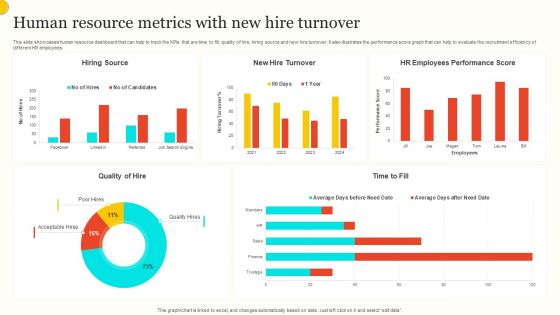
Human Resource Metrics With New Hire Turnover Professional PDF
This slide showcases human resource dashboard that can help to track the KPIs that are time to fill, quality of hire, hiring source and new hire turnover. It also illustrates the performance score graph that can help to evaluate the recruitment efficiency of different HR employees. Pitch your topic with ease and precision using this Human Resource Metrics With New Hire Turnover Professional PDF. This layout presents information on Hiring Source, New Hire Turnover, Hr Employees Performance Score. It is also available for immediate download and adjustment. So, changes can be made in the color, design, graphics or any other component to create a unique layout.
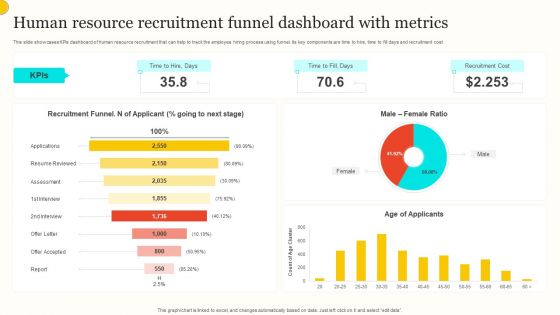
Human Resource Recruitment Funnel Dashboard With Metrics Summary PDF
This slide showcases KPIs dashboard of human resource recruitment that can help to track the employee hiring process using funnel. Its key components are time to hire, time to fill days and recruitment cost. Showcasing this set of slides titled Human Resource Recruitment Funnel Dashboard With Metrics Summary PDF. The topics addressed in these templates are Recruitment Funnel, Male Female Ratio, Age Applicants. All the content presented in this PPT design is completely editable. Download it and make adjustments in color, background, font etc. as per your unique business setting.

Business Intelligence Dashboard Showcasing Fleet Management Metrics Elements PDF
This slide showcases BI dashboard to ensure smooth working of shipping and logistics operations. It includes KPIs such as vehicle cost trend, price per unit, fuel consumption, distance, accident, etc. Showcasing this set of slides titled Business Intelligence Dashboard Showcasing Fleet Management Metrics Elements PDF. The topics addressed in these templates are Cost Trend, Price Per Unit Trend, Vehicle Cost Trend. All the content presented in this PPT design is completely editable. Download it and make adjustments in color, background, font etc. as per your unique business setting.

Quarterly Cost Variance Analysis With Maintenance Metrics Dashboard Information PDF
The following slide depicts a maintenance KPI dashboard to have useful insights for effective decision making. It includes key performance areas such as quarterly cost variance, scrap, quarterly run time variance analysis etc. Pitch your topic with ease and precision using this Quarterly Cost Variance Analysis With Maintenance Metrics Dashboard Information PDF. This layout presents information on Production, Budgeted Cost, Planned Run Time, Actual Run Time. It is also available for immediate download and adjustment. So, changes can be made in the color, design, graphics or any other component to create a unique layout.

Client Success Health Metrics For Organization Structure Designs PDF
This slide displays measurement parameters to track effectiveness of customer success operations on the organization. It includes elements such as health score, NPS, qualitative feedback, MRR, renewal rate, etc. Persuade your audience using this Client Success Health Metrics For Organization Structure Designs PDF. This PPT design covers six stages, thus making it a great tool to use. It also caters to a variety of topics including Customer Satisfaction, Score Customer Health, Score Renewal Rate. Download this PPT design now to present a convincing pitch that not only emphasizes the topic but also showcases your presentation skills.
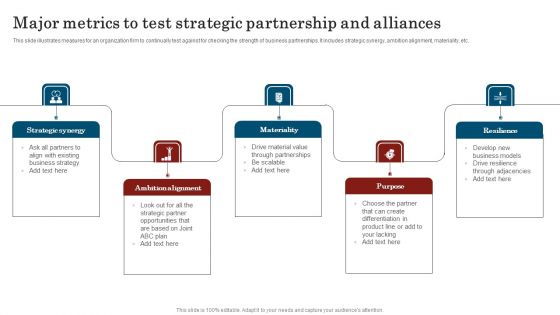
Major Metrics To Test Strategic Partnership And Alliances Graphics PDF
This slide illustrates measures for an organization firm to continually test against for checking the strength of business partnerships. It includes strategic synergy, ambition alignment, materiality, etc. Persuade your audience using this Major Metrics To Test Strategic Partnership And Alliances Graphics PDF. This PPT design covers five stages, thus making it a great tool to use. It also caters to a variety of topics including Strategic Synergy, Ambition Alignment, Materiality. Download this PPT design now to present a convincing pitch that not only emphasizes the topic but also showcases your presentation skills.
Efficient Analytics Metrics For Tracking Website Performance Professional PDF
This slide exhibits measures to maintain site position in market. The purpose of this slide is to improve ratio of revenue to marketing costs while promoting business successfully. It includes information related to number of visitors, bounce rates, etc. Showcasing this set of slides titled Efficient Analytics Metrics For Tracking Website Performance Professional PDF. The topics addressed in these templates are Number Of Visitors, Bounce Rates, Average Pageviews Per Session. All the content presented in this PPT design is completely editable. Download it and make adjustments in color, background, font etc. as per your unique business setting.

Evaluation Criteria And Metrics For Potential Business Association Diagrams PDF
Following slide represents evaluation criteria of potential partnership companies. Purpose of this slide is to measure efficiency and strategic growth based on various parameters and indicators. It include various indicators such as business size, management quality, growth strategy and integration. Showcasing this set of slides titled Evaluation Criteria And Metrics For Potential Business Association Diagrams PDF. The topics addressed in these templates are Growth Strategy, Management And Shareholders, Business Size. All the content presented in this PPT design is completely editable. Download it and make adjustments in color, background, font etc. as per your unique business setting.
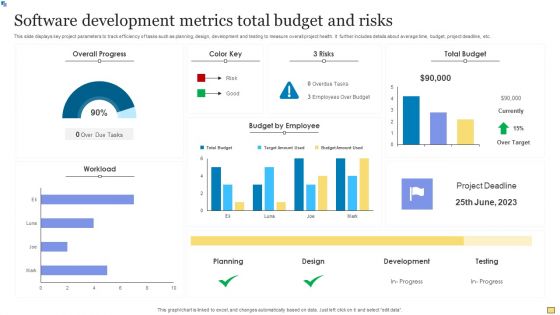
Software Development Metrics Total Budget And Risks Summary PDF
This slide displays key project parameters to track efficiency of tasks such as planning, design, development and testing to measure overall project health. It further includes details about average time, budget, project deadline, etc. Showcasing this set of slides titled Software Development Metrics Total Budget And Risks Summary PDF. The topics addressed in these templates are Overall Progress, Workload Employee, Total Budget. All the content presented in this PPT design is completely editable. Download it and make adjustments in color, background, font etc. as per your unique business setting.

MPM Metrics Ppt PowerPoint Presentation Complete Deck With Slides
Pitch yourself both in house and outside by utilizing this complete deck. This mpm metrics ppt powerpoint presentation complete deck with slides focuses on key fundamentals of the topic, displayed using different slides. With a total of twenty three slides, this template is the best tool you can use to persuade your audience. It will not only help you create great presentations but also induce strategic thinking because of its well researched content and graphics. You can easily personalize any of the elements to suit your unique business setting. Additionally, it can be saved in PNG, JPG, and PDF formats to save your time and resources.
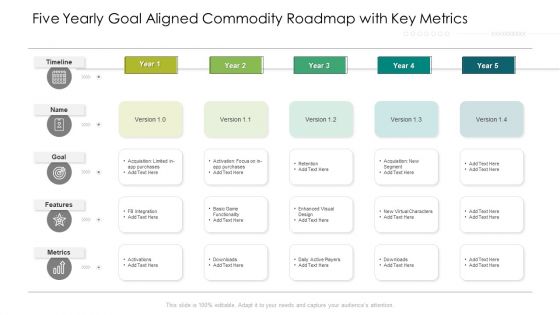
Five Yearly Goal Aligned Commodity Roadmap With Key Metrics Graphics
Presenting the five yearly goal aligned commodity roadmap with key metrics graphics. The template includes a roadmap that can be used to initiate a strategic plan. Not only this, the PowerPoint slideshow is completely editable and you can effortlessly modify the font size, font type, and shapes according to your needs. This PPT slide can be easily reached in standard screen and widescreen aspect ratios. The set is also available in various formats like PDF, PNG, and JPG. So download and use it multiple times as per your knowledge.
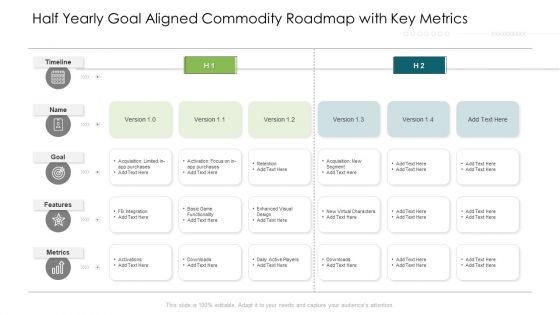
Half Yearly Goal Aligned Commodity Roadmap With Key Metrics Slides
Presenting the half yearly goal aligned commodity roadmap with key metrics slides. The template includes a roadmap that can be used to initiate a strategic plan. Not only this, the PowerPoint slideshow is completely editable and you can effortlessly modify the font size, font type, and shapes according to your needs. This PPT slide can be easily reached in standard screen and widescreen aspect ratios. The set is also available in various formats like PDF, PNG, and JPG. So download and use it multiple times as per your knowledge.

Quarterly Goal Aligned Commodity Roadmap With Key Metrics Professional
Presenting the quarterly goal aligned commodity roadmap with key metrics professional. The template includes a roadmap that can be used to initiate a strategic plan. Not only this, the PowerPoint slideshow is completely editable and you can effortlessly modify the font size, font type, and shapes according to your needs. This PPT slide can be easily reached in standard screen and widescreen aspect ratios. The set is also available in various formats like PDF, PNG, and JPG. So download and use it multiple times as per your knowledge.
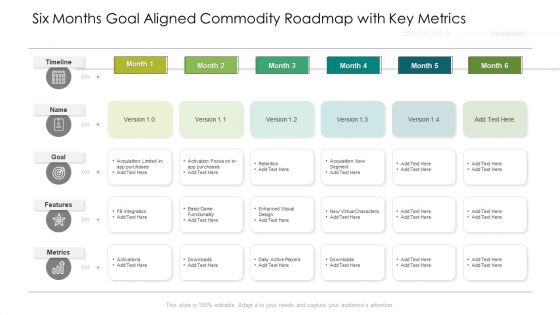
Six Months Goal Aligned Commodity Roadmap With Key Metrics Professional
Presenting the six months goal aligned commodity roadmap with key metrics professional. The template includes a roadmap that can be used to initiate a strategic plan. Not only this, the PowerPoint slideshow is completely editable and you can effortlessly modify the font size, font type, and shapes according to your needs. This PPT slide can be easily reached in standard screen and widescreen aspect ratios. The set is also available in various formats like PDF, PNG, and JPG. So download and use it multiple times as per your knowledge.
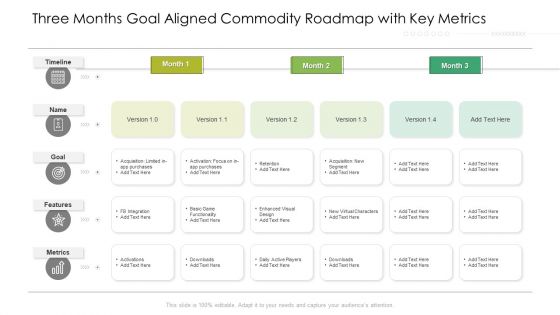
Three Months Goal Aligned Commodity Roadmap With Key Metrics Mockup
Presenting the three months goal aligned commodity roadmap with key metrics mockup. The template includes a roadmap that can be used to initiate a strategic plan. Not only this, the PowerPoint slideshow is completely editable and you can effortlessly modify the font size, font type, and shapes according to your needs. This PPT slide can be easily reached in standard screen and widescreen aspect ratios. The set is also available in various formats like PDF, PNG, and JPG. So download and use it multiple times as per your knowledge.

Visual Metrics For Variance Analysis Techniques And Models Mockup PDF
This slide covers the visual dashboard for Gap analysis model and method. It also contains action plan results, total problems and solution comparison function useful in analysing the gaps and loopholes in the value stream. Showcasing this set of slides titled visual metrics for variance analysis techniques and models mockup pdf. The topics addressed in these templates are total problems vs solutions, action plan results, problems vs solutions comparison. All the content presented in this PPT design is completely editable. Download it and make adjustments in color, background, font etc. as per your unique business setting.
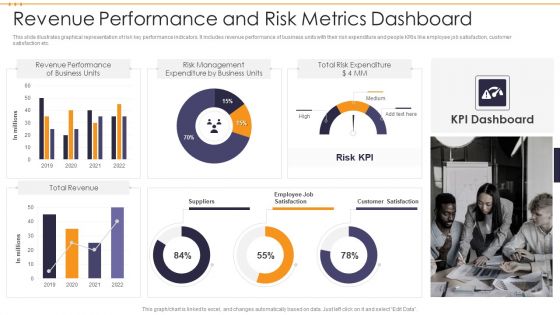
Revenue Performance And Risk Metrics Dashboard Demonstration PDF
This slide illustrates graphical representation of risk key performance indicators. It includes revenue performance of business units with their risk expenditure and people KRIs like employee job satisfaction, customer satisfaction etc. Showcasing this set of slides titled Revenue Performance And Risk Metrics Dashboard Demonstration PDF. The topics addressed in these templates are Total Risk Expenditure, Risk Management, Revenue Performance . All the content presented in this PPT design is completely editable. Download it and make adjustments in color, background, font etc. as per your unique business setting.
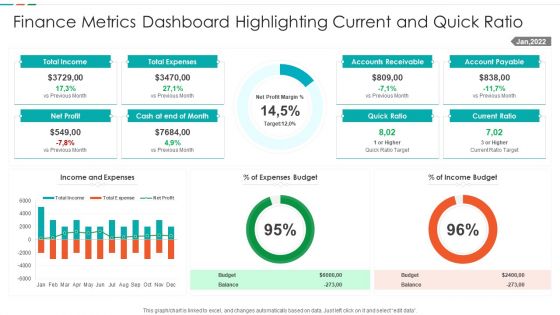
Finance Metrics Dashboard Highlighting Current And Quick Ratio Template PDF
This graph or chart is linked to excel, and changes automatically based on data. Just left click on it and select edit data. Showcasing this set of slides titled Finance Metrics Dashboard Highlighting Current And Quick Ratio Template PDF. The topics addressed in these templates are Total Income Budget, Total Expenses Balance, Net Profit Quick, Ratio Current Ratio. All the content presented in this PPT design is completely editable. Download it and make adjustments in color, background, font etc. as per your unique business setting.
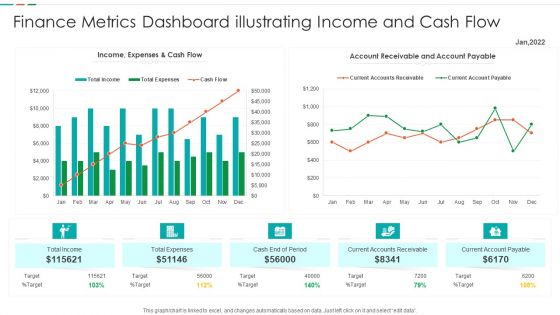
Finance Metrics Dashboard Illustrating Income And Cash Flow Template PDF
This graph or chart is linked to excel, and changes automatically based on data. Just left click on it and select edit data. Pitch your topic with ease and precision using this Finance Metrics Dashboard Illustrating Income And Cash Flow Template PDF. This layout presents information on Current Accounts Receivable, Current Account Payable, Cash End Period, Account Receivable Account. It is also available for immediate download and adjustment. So, changes can be made in the color, design, graphics or any other component to create a unique layout.

Startup Business Financial Dashboard With Key Metrics Sample PDF
This slide represents the financial dashboard for startup company with key performance indicators. It includes details related to current working capital, cash conversion cycle in days and vendor payment error rate. Pitch your topic with ease and precision using this Startup Business Financial Dashboard With Key Metrics Sample PDF. This layout presents information on Cash Conversion Cycle, Current Working Capital, Current Liabilities Debt. It is also available for immediate download and adjustment. So, changes can be made in the color, design, graphics or any other component to create a unique layout.
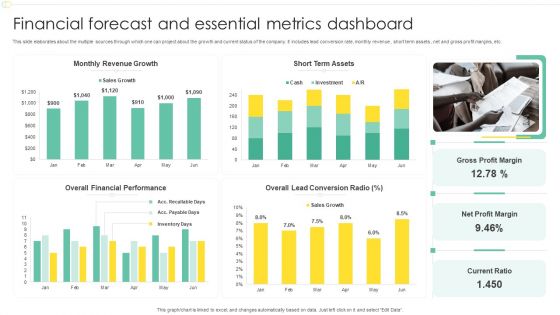
Financial Forecast And Essential Metrics Dashboard Ppt File Show PDF
This slide elaborates about the multiple sources through which one can project about the growth and current status of the company. It includes lead conversion rate, monthly revenue , short term assets , net and gross profit margins, etc. Pitch your topic with ease and precision using this Financial Forecast And Essential Metrics Dashboard Ppt File Show PDF. This layout presents information on Monthly Revenue Growth, Short Term Assets, Overall Financial Performance, Net Profit Margin. It is also available for immediate download and adjustment. So, changes can be made in the color, design, graphics or any other component to create a unique layout.
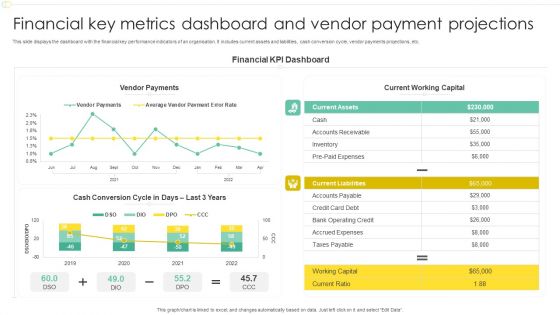
Financial Key Metrics Dashboard And Vendor Payment Projections Professional PDF
This slide displays the dashboard with the financial key performance indicators of an organisation. It includes current assets and liabilities, cash conversion cycle, vendor payments projections, etc. Pitch your topic with ease and precision using this Financial Key Metrics Dashboard And Vendor Payment Projections Professional PDF. This layout presents information on Financial KPI Dashboard, Current Working Capital, Vendor Payments. It is also available for immediate download and adjustment. So, changes can be made in the color, design, graphics or any other component to create a unique layout.
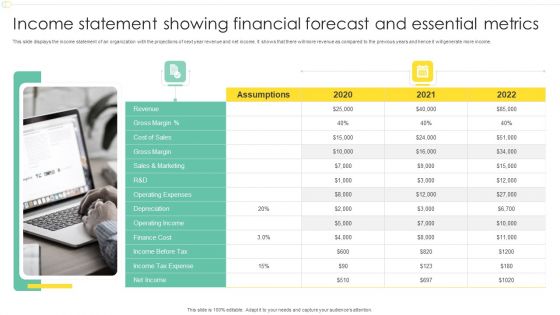
Income Statement Showing Financial Forecast And Essential Metrics Structure PDF
This slide displays the income statement of an organization with the projections of next year revenue and net income. It shows that there will more revenue as compared to the previous years and hence it will generate more income. Presenting Income Statement Showing Financial Forecast And Essential Metrics Structure PDF to dispense important information. This template comprises two stages. It also presents valuable insights into the topics including Revenue, Operating Expenses, Operating Income. This is a completely customizable PowerPoint theme that can be put to use immediately. So, download it and address the topic impactfully.

Enterprise Sustainability Performance Metrics Customer Service Dashboard Professional PDF
Following slide illustrates customer service dashboard covering details such as request answered, total requests, total revenue and support cost revenue. It also includes customer satisfaction score, customer retention in a 12 months format.Deliver and pitch your topic in the best possible manner with this Enterprise Sustainability Performance Metrics Customer Service Dashboard Professional PDF. Use them to share invaluable insights on Customer Satisfaction, Customer Retention, Support Revenue and impress your audience. This template can be altered and modified as per your expectations. So, grab it now.

Enterprise Sustainability Performance Metrics Employee Billable Hours Dashboard Information PDF
Following slide shows employee billable hours dashboard covering total hours capacity, allocated hours billable, total hours worked, and total billable hours worked for the assignment. It also includes details of each team member indulged for same assignment.Deliver an awe inspiring pitch with this creative Enterprise Sustainability Performance Metrics Employee Billable Hours Dashboard Information PDF bundle. Topics like Billable Worked, Allocated Billable, Total Capacity can be discussed with this completely editable template. It is available for immediate download depending on the needs and requirements of the user.
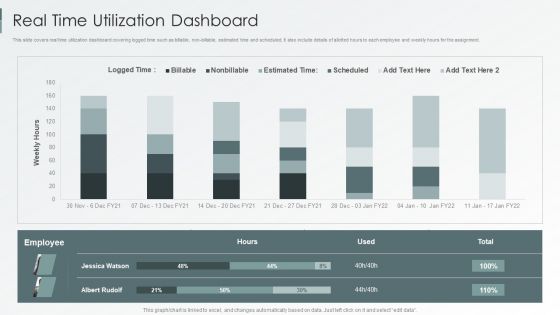
Enterprise Sustainability Performance Metrics Real Time Utilization Dashboard Portrait PDF
This slide covers real time utilization dashboard covering logged time such as billable, non-billable, estimated time and scheduled. It also include details of allotted hours to each employee and weekly hours for the assignment.Deliver and pitch your topic in the best possible manner with this Enterprise Sustainability Performance Metrics Real Time Utilization Dashboard Portrait PDF. Use them to share invaluable insights on Real Time, Utilization Dashboard and impress your audience. This template can be altered and modified as per your expectations. So, grab it now.

Enterprise Sustainability Performance Metrics Short Term Goals Summary PDF
This slide covers the short term goals set by the firm for FY22. Goals covered are to capture competitors market share, reduce churn rate, increase sales revenue and to invest in CSR activities.This is a Enterprise Sustainability Performance Metrics Short Term Goals Summary PDF template with various stages. Focus and dispense information on five stages using this creative set, that comes with editable features. It contains large content boxes to add your information on topics like Leading Competitors, Sales Revenue, Reduce Customer. You can also showcase facts, figures, and other relevant content using this PPT layout. Grab it now.
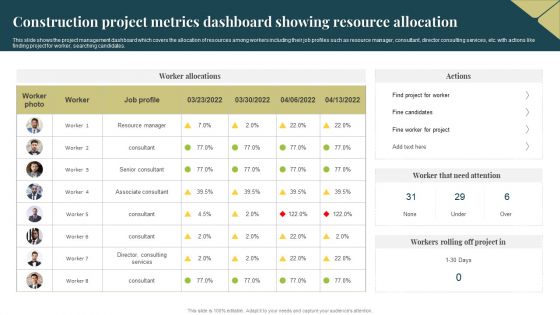
Construction Project Metrics Dashboard Showing Resource Allocation Professional PDF
This slide shows the project management dashboard which covers the allocation of resources among workers including their job profiles such as resource manager, consultant, director consulting services, etc. with actions like finding project for worker, searching candidates. Showcasing this set of slides titled Construction Project Metrics Dashboard Showing Resource Allocation Professional PDF. The topics addressed in these templates are Resource Manager, Services, Project. All the content presented in this PPT design is completely editable. Download it and make adjustments in color, background, font etc. as per your unique business setting.
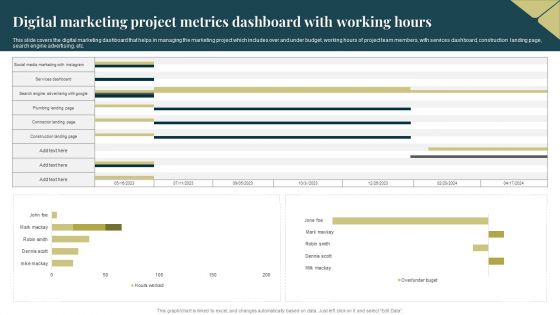
Digital Marketing Project Metrics Dashboard With Working Hours Download PDF
This slide covers the digital marketing dashboard that helps in managing the marketing project which includes over and under budget, working hours of project team members, with services dashboard, construction landing page, search engine advertising, etc. Showcasing this set of slides titled Digital Marketing Project Metrics Dashboard With Working Hours Download PDF. The topics addressed in these templates are Advertising, Social Media Marketing. All the content presented in this PPT design is completely editable. Download it and make adjustments in color, background, font etc. as per your unique business setting.

IT Operations Dashboard For Project Metrics Portrait PDF
This slide focuses on dashboard that provides information about the information technology operations for managing IT project which covers the investments, billed amount, time taken to complete the project, customer satisfaction, monthly expenses, service level agreement status, etc. Pitch your topic with ease and precision using this IT Operations Dashboard For Project Metrics Portrait PDF. This layout presents information on Revenues, Investments, Monthly Expenses. It is also available for immediate download and adjustment. So, changes can be made in the color, design, graphics or any other component to create a unique layout.

Marketing Project Metrics Dashboard With Campaign Performance Topics PDF
This slide focuses on marketing project management dashboard which includes total spending, clicks, number of conversions, devices break down, top performing campaigns by cost per conversion such as online data analyzer, gaining insights, best features, etc. Showcasing this set of slides titled Marketing Project Metrics Dashboard With Campaign Performance Topics PDF. The topics addressed in these templates are Average, Cost, Analyzing Data. All the content presented in this PPT design is completely editable. Download it and make adjustments in color, background, font etc. as per your unique business setting.

 Home
Home