Metrics

Proactive Consumer Solution And How To Perform It Kpis For Human Resource Service Delivery Clipart PDF
This slide depicts the KPIs for human resource service delivery with the help of AI and how some of these KPIs will be analyzed automatically through AI.Deliver and pitch your topic in the best possible manner with this Proactive Consumer Solution And How To Perform It Kpis For Human Resource Service Delivery Clipart PDF. Use them to share invaluable insights on Executive Dashboard, Performance Dashboard, Development Dashboard and impress your audience. This template can be altered and modified as per your expectations. So, grab it now.

CRM Team Dashboard Highlighting Major Web Based Platform Kpis Template PDF
This slide showcases customer relationship management CRM team dashboard indicating web portal KPIs. It provides information about cost per acquisition CPA, signups, channel, spend, etc. Pitch your topic with ease and precision using this CRM Team Dashboard Highlighting Major Web Based Platform Kpis Template PDF. This layout presents information on CRM Team Dashboard Highlighting, Web Based Platform Kpis. It is also available for immediate download and adjustment. So, changes can be made in the color, design, graphics or any other component to create a unique layout.
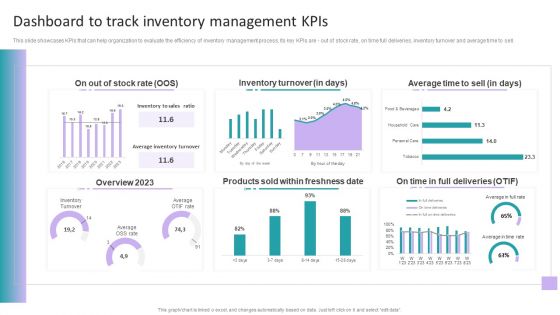
Stock Inventory Acquisition Dashboard To Track Inventory Management Kpis Themes PDF
This slide showcases KPIs that can help organization to evaluate the efficiency of inventory management process. Its key KPIs are - out of stock rate, on time full deliveries, inventory turnover and average time to sell. The best PPT templates are a great way to save time, energy, and resources. Slidegeeks have 100 percent editable powerpoint slides making them incredibly versatile. With these quality presentation templates, you can create a captivating and memorable presentation by combining visually appealing slides and effectively communicating your message. Download Stock Inventory Acquisition Dashboard To Track Inventory Management Kpis Themes PDF from Slidegeeks and deliver a wonderful presentation.

Mobile Search Engine Optimization Plan Kpis To Effectively Track Mobile SEO Performance Diagrams PDF
The purpose of this slide is to outline various KPIs through which organization can evaluate the mobile search engine optimization SEO performance. The key KPIs are organic clicks, pages per session, bounce rate, page speed, crawl errors and backlinks. There are so many reasons you need a Mobile Search Engine Optimization Plan Kpis To Effectively Track Mobile SEO Performance Diagrams PDF. The first reason is you can not spend time making everything from scratch, Thus, Slidegeeks has made presentation templates for you too. You can easily download these templates from our website easily.
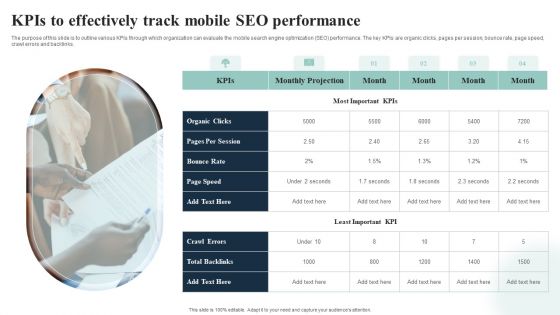
Introduction To Mobile SEM Kpis To Effectively Track Mobile SEO Performance Information PDF
The purpose of this slide is to outline various KPIs through which organization can evaluate the mobile search engine optimization SEO performance. The key KPIs are organic clicks, pages per session, bounce rate, page speed, crawl errors and backlinks. From laying roadmaps to briefing everything in detail, our templates are perfect for you. You can set the stage with your presentation slides. All you have to do is download these easy to edit and customizable templates. Introduction To Mobile SEM Kpis To Effectively Track Mobile SEO Performance Information PDF will help you deliver an outstanding performance that everyone would remember and praise you for. Do download this presentation today.

Comparing Lean Operational Excellence Strategy Manufacturing Kpis With Competitors Mockup PDF
This slide showcases manufacturing KPIs comparison of company with competitors from the industry. Key KPIs included here are total cycle time, time for changeovers, capacity utilization, suppliers quality, reportable incidents, equipment efficiency etc. Pitch your topic with ease and precision using this Comparing Lean Operational Excellence Strategy Manufacturing Kpis With Competitors Mockup PDF. This layout presents information on Parameters, Rejection Rate, Quality. It is also available for immediate download and adjustment. So, changes can be made in the color, design, graphics or any other component to create a unique layout.
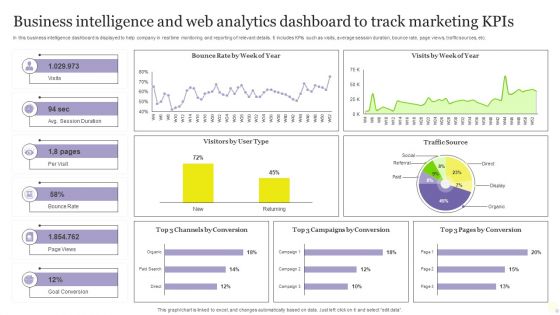
Business Intelligence And Web Analytics Dashboard To Track Marketing Kpis Inspiration PDF
In this business intelligence dashboard is displayed to help company in real time monitoring and reporting of relevant details. It includes KPIs such as visits, average session duration, bounce rate, page views, traffic sources, etc. Showcasing this set of slides titled Business Intelligence And Web Analytics Dashboard To Track Marketing Kpis Inspiration PDF. The topics addressed in these templates are Goal Conversion, Track Marketing Kpis, Web Analytics Dashboard. All the content presented in this PPT design is completely editable. Download it and make adjustments in color, background, font etc. as per your unique business setting.
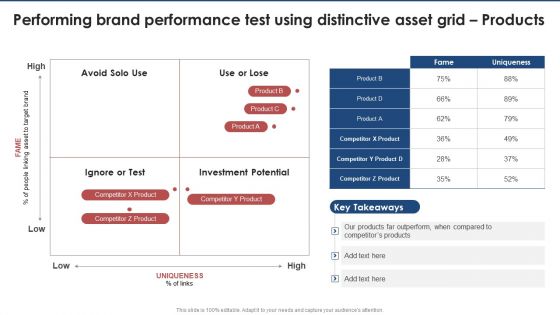
Performing Brand Performance Test Using Distinctive Asset Grid Products Brand Value Estimation Guide Portrait PDF
Here you can discover an assortment of the finest PowerPoint and Google Slides templates. With these templates, you can create presentations for a variety of purposes while simultaneously providing your audience with an eye-catching visual experience. Download Performing Brand Performance Test Using Distinctive Asset Grid Products Brand Value Estimation Guide Portrait PDF to deliver an impeccable presentation. These templates will make your job of preparing presentations much quicker, yet still, maintain a high level of quality. Slidegeeks has experienced researchers who prepare these templates and write high-quality content for you. Later on, you can personalize the content by editing the Performing Brand Performance Test Using Distinctive Asset Grid Products Brand Value Estimation Guide Portrait PDF.

Performing Brand Performance Test Using Distinctive Asset Grid Products Slides PDF
Slidegeeks is one of the best resources for PowerPoint templates. You can download easily and regulate Performing Brand Performance Test Using Distinctive Asset Grid Products Slides PDF for your personal presentations from our wonderful collection. A few clicks is all it takes to discover and get the most relevant and appropriate templates. Use our Templates to add a unique zing and appeal to your presentation and meetings. All the slides are easy to edit and you can use them even for advertisement purposes.

Funnel For Evaluating Media Kpis Performance Ppt PowerPoint Presentation Design Templates
This is a funnel for evaluating media kpis performance ppt powerpoint presentation design templates. This is a three stage process. The stages in this process are business, marketing, funnel, purchase, management.
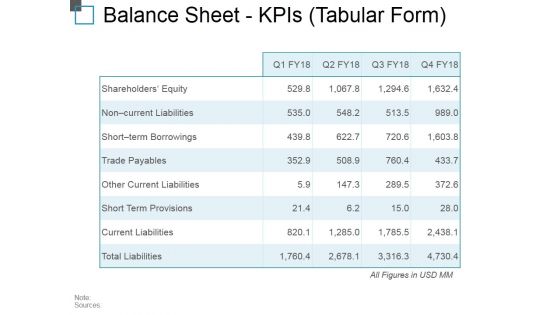
Balance Sheet Kpis Tabular Form Ppt PowerPoint Presentation Outline Background Image
This is a balance sheet kpis tabular form ppt powerpoint presentation outline background image. This is a four stage process. The stages in this process are current assets, current liabilities, total assets, total liabilities.

Cash Flow Statement Kpis Tabular Form Ppt PowerPoint Presentation Gallery Good
This is a cash flow statement kpis tabular form ppt powerpoint presentation gallery good. This is a four stage process. The stages in this process are operations, financing activities, investing activities, net increase in cash.
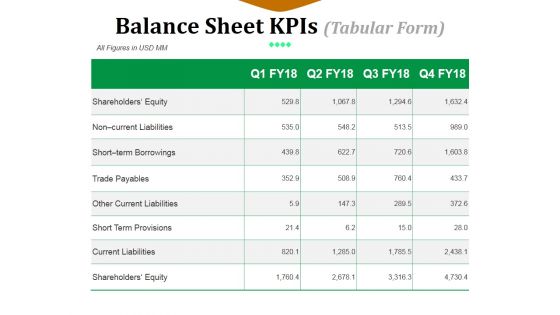
Balance Sheet Kpis Template 1 Ppt PowerPoint Presentation Ideas Master Slide
This is a balance sheet kpis template 1 ppt powerpoint presentation ideas master slide. This is a four stage process. The stages in this process are shareholders equity, non current liabilities, short term borrowings, trade payables, other current liabilities.
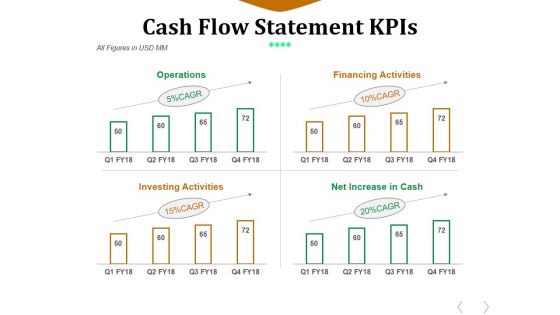
Cash Flow Statement Kpis Template 1 Ppt PowerPoint Presentation Outline Deck
This is a cash flow statement kpis template 1 ppt powerpoint presentation outline deck. This is a four stage process. The stages in this process are operations, financing activities, investing activities, net increase in cash.

P And L Kpis Template 1 Ppt PowerPoint Presentation Design Ideas
This is a p and l kpis template 1 ppt powerpoint presentation design ideas. This is a four stage process. The stages in this process are revenue, cogs, operating profit, net profit.

P And L Kpis Template 1 Ppt PowerPoint Presentation Slides Model
This is a p and l kpis template 1 ppt powerpoint presentation slides model. This is a four stage process. The stages in this process are revenue, operating profit, net profit, cogs.

P And L Kpis Template 2 Ppt PowerPoint Presentation Outline Clipart
This is a p and l kpis template 2 ppt powerpoint presentation outline clipart. This is a four stage process. The stages in this process are net sales, total income, expenses, profit before tax, profit after tax.
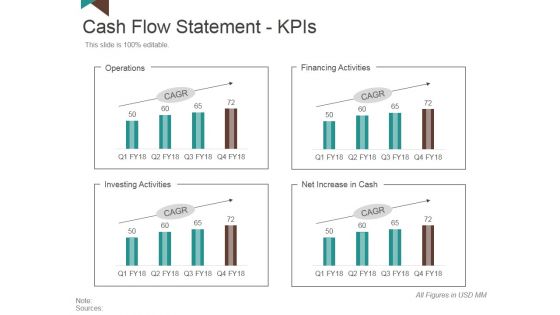
Cash Flow Statement Kpis Template 2 Ppt PowerPoint Presentation Layouts Skills
This is a cash flow statement kpis template 2 ppt powerpoint presentation layouts skills. This is a four stage process. The stages in this process are operations, financing activities, net increase in cash, investing activities.

Cash Flow Statement Kpis Tabular Form Ppt PowerPoint Presentation Infographics File Formats
This is a cash flow statement kpis tabular form ppt powerpoint presentation infographics file formats. This is a four stage process. The stages in this process are operations, investing activities, financing activities, net increase in cash.
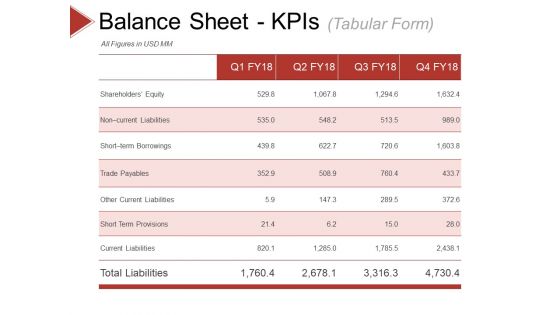
Balance Sheet Kpis Template 2 Ppt PowerPoint Presentation Visual Aids Ideas
This is a balance sheet kpis template 2 ppt powerpoint presentation visual aids ideas. This is a four stage process. The stages in this process are shareholders equity, trade payables, other current liabilities, short term provisions, current liabilities.

Balance Sheet Kpis Template 3 Ppt PowerPoint Presentation Professional Graphics Design
This is a balance sheet kpis template 3 ppt powerpoint presentation professional graphics design. This is a four stage process. The stages in this process are current assets, current liabilities, total assets, total liabilities.

Cash Flow Statement Kpis Template 1 Ppt PowerPoint Presentation Pictures Microsoft
This is a cash flow statement kpis template 1 ppt powerpoint presentation pictures microsoft. This is a four stage process. The stages in this process are operations, financing activities, investing activities, net increase in cash.

P And L Kpis Template 1 Ppt PowerPoint Presentation Slides Show
This is a p and l kpis template 1 ppt powerpoint presentation slides show. This is a four stage process. The stages in this process are other income, total income, expenses, other expenses, depreciation expense.
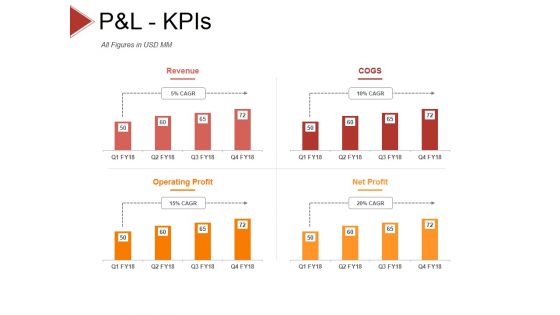
P And L Kpis Template 2 Ppt PowerPoint Presentation Styles Objects
This is a p and l kpis template 2 ppt powerpoint presentation styles objects. This is a four stage process. The stages in this process are revenue, cogs, operating profit, net profit.

Balance Sheet Kpis Template 1 Ppt PowerPoint Presentation Styles Layout Ideas
This is a balance sheet kpis template 1 ppt powerpoint presentation styles layout ideas. This is a four stage process. The stages in this process are current assets, current liabilities, total assets, total liabilities.
Cash Flow Statement Kpis Template 1 Ppt PowerPoint Presentation Icon Elements
This is a cash flow statement kpis template 1 ppt powerpoint presentation icon elements. This is a four stage process. The stages in this process are operations, financing activities, investing activities, net increase in cash.
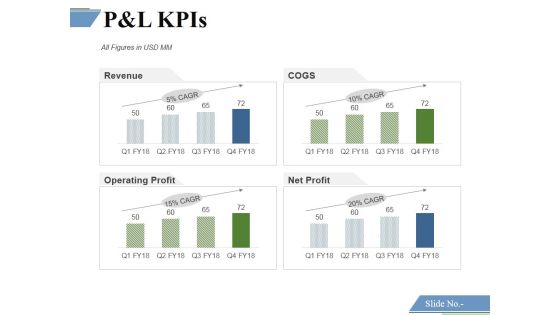
P And L Kpis Template 1 Ppt PowerPoint Presentation Model Inspiration
This is a p and l kpis template 1 ppt powerpoint presentation model inspiration. This is a four stage process. The stages in this process are revenue, cogs, operating profit, net profit.

Balance Sheet Kpis Template 1 Ppt PowerPoint Presentation Layouts Design Ideas
This is a balance sheet kpis template 1 ppt powerpoint presentation layouts design ideas. This is a four stage process. The stages in this process are current assets, current liabilities, total assets, total liabilities.

Cash Flow Statement Kpis Template 1 Ppt PowerPoint Presentation Gallery Diagrams
This is a cash flow statement kpis template 1 ppt powerpoint presentation gallery diagrams. This is a four stage process. The stages in this process are operations, financing activities, investing activities, net increase in cash.
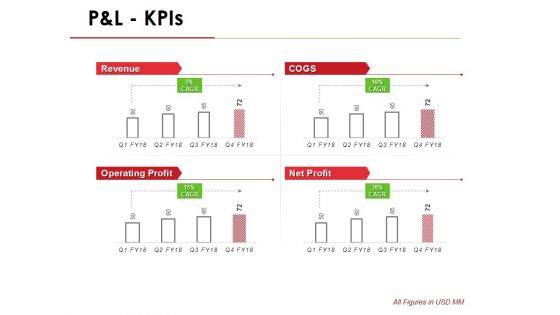
P And L Kpis Template 1 Ppt PowerPoint Presentation Infographic Template Outline
This is a p and l kpis template 1 ppt powerpoint presentation infographic template outline. This is a four stage process. The stages in this process are revenue, operating profit, cogs, net profit.

P And L Kpis Template 2 Ppt PowerPoint Presentation Professional Graphics
This is a p and l kpis template 2 ppt powerpoint presentation professional graphics. This is a four stage process. The stages in this process are net sales, other income, total income, expenses, total material consumed.

Cash Flow Statement Kpis Tabular Form Ppt PowerPoint Presentation Layouts Grid
This is a cash flow statement kpis tabular form ppt powerpoint presentation layouts grid. This is a four stage process. The stages in this process are operations, financing activities, investing activities, net increase in cash.
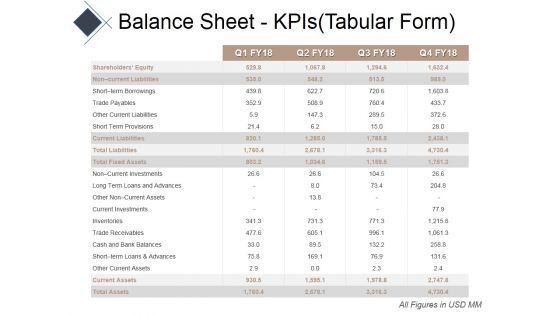
Balance Sheet Kpis Tabular Form Ppt PowerPoint Presentation Show Example Introduction
This is a balance sheet kpis tabular form ppt powerpoint presentation show example introduction. This is a four stage process. The stages in this process are current assets, current liabilities, total assets, total liabilities.
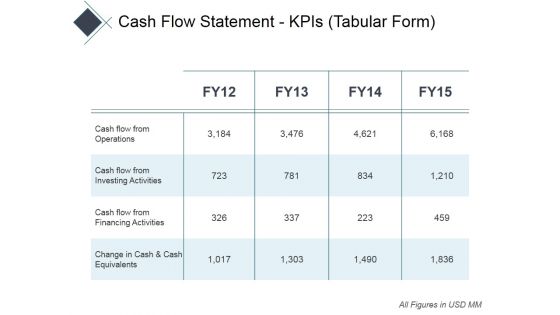
Cash Flow Statement Kpis Tabular Form Ppt PowerPoint Presentation Infographics Professional
This is a cash flow statement kpis tabular form ppt powerpoint presentation infographics professional. This is a four stage process. The stages in this process are operations, financing activities, investing activities, net increase in cash.

Cash Flow Statement Kpis Tabular Form Ppt PowerPoint Presentation Model Graphic Tips
This is a cash flow statement kpis tabular form ppt powerpoint presentation model graphic tips. This is a four stage process. The stages in this process are operations, investing activities, net increase in cash, financing activities.

P And L Kpis Tabular Form Ppt PowerPoint Presentation Model Ideas
This is a p and l kpis tabular form ppt powerpoint presentation model ideas. This is a four stage process. The stages in this process are revenue, operating profit, cogs, net profit.

Balance Sheet Kpis Tabular Form Template 2 Ppt PowerPoint Presentation Inspiration Portfolio
This is a balance sheet kpis tabular form template 2 ppt powerpoint presentation inspiration portfolio. This is a four stage process. The stages in this process are business, management, compere, strategy, table.
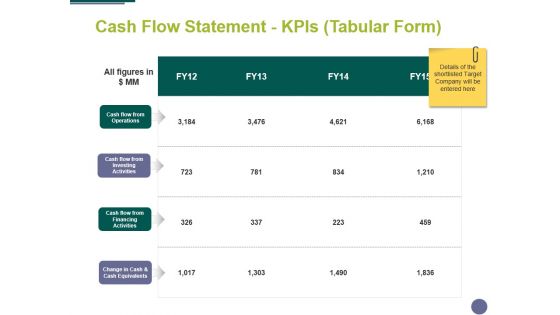
Cash Flow Statement Kpis Tabular Form Ppt PowerPoint Presentation Styles Design Inspiration
This is a cash flow statement kpis tabular form ppt powerpoint presentation styles design inspiration. This is a four stage process. The stages in this process are finance, analysis, management, business, marketing.
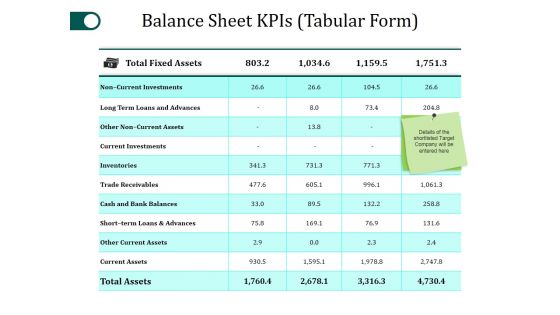
Balance Sheet Kpis Template 1 Ppt PowerPoint Presentation Pictures Example Introduction
This is a balance sheet kpis template 1 ppt powerpoint presentation pictures example introduction. This is a four stage process. The stages in this process are total fixed assets, non current investments, inventories, trade receivables.

Balance Sheet Kpis Template 2 Ppt PowerPoint Presentation Portfolio Graphics Template
This is a balance sheet kpis template 2 ppt powerpoint presentation portfolio graphics template. This is a four stage process. The stages in this process are shareholders equity, trade payables, other current liabilities, current liabilities, total liabilities.

Cash Flow Statement Kpis Template 2 Ppt PowerPoint Presentation Summary Guidelines
This is a cash flow statement kpis template 2 ppt powerpoint presentation summary guidelines. This is a four stage process. The stages in this process are operations, investing activities, net increase in cash, financing activities.
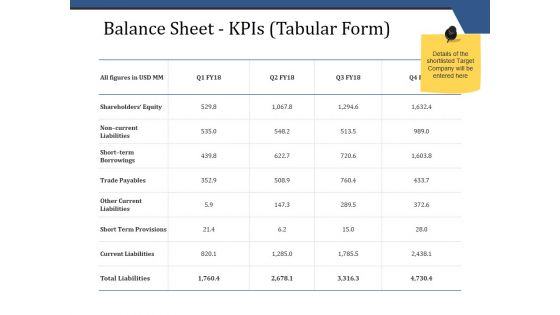
Balance Sheet Kpis Tabular Form Template 1 Ppt PowerPoint Presentation Infographics Picture
This is a balance sheet kpis tabular form template 1 ppt powerpoint presentation infographics picture. This is a four stage process. The stages in this process are business, finance, analysis, investment, strategy.
Balance Sheet Kpis Tabular Form Template 2 Ppt PowerPoint Presentation Icon Clipart
This is a balance sheet kpis tabular form template 2 ppt powerpoint presentation icon clipart. This is a four stage process. The stages in this process are business, finance, analysis, investment, strategy.
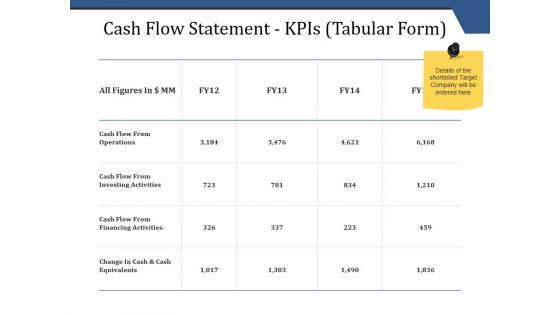
Cash Flow Statement Kpis Tabular Form Ppt PowerPoint Presentation Inspiration Master Slide
This is a cash flow statement kpis tabular form ppt powerpoint presentation inspiration master slide. This is a four stage process. The stages in this process are operations, financing activities, investing activities, net increase in cash.
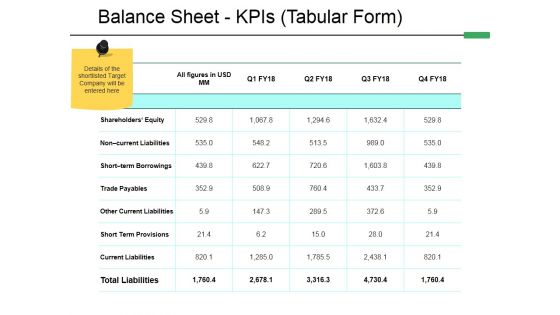
Balance Sheet Kpis Tabular Form Template 1 Ppt PowerPoint Presentation Outline Pictures
This is a balance sheet kpis tabular form template 1 ppt powerpoint presentation outline pictures. This is a five stage process. The stages in this process are compere, business, marketing, table, strategy.

Balance Sheet Kpis Tabular Form Template 2 Ppt PowerPoint Presentation Styles Model
This is a balance sheet kpis tabular form template 2 ppt powerpoint presentation styles model. This is a four stage process. The stages in this process are advances, inventories, trade receivables, current investments, current assets, other current assets.

P And L Kpis Tabular Form Ppt PowerPoint Presentation Ideas Infographics
This is a p and l kpis tabular form ppt powerpoint presentation ideas infographics. This is a four stage process. The stages in this process are other income, expenses, other expenses, depreciation expense, financing cost.

Cash Flow Statement Kpis Template 1 Ppt PowerPoint Presentation Infographic Template Master Slide
This is a cash flow statement kpis template 1 ppt powerpoint presentation infographic template master slide. This is a four stage process. The stages in this process are business, table, management, analysis, success.

Cash Flow Statement Kpis Template 2 Ppt PowerPoint Presentation Layouts Visuals
This is a cash flow statement kpis template 2 ppt powerpoint presentation layouts visuals. This is a four stage process. The stages in this process are operations, financial activities, investing activities, net increase in cash.
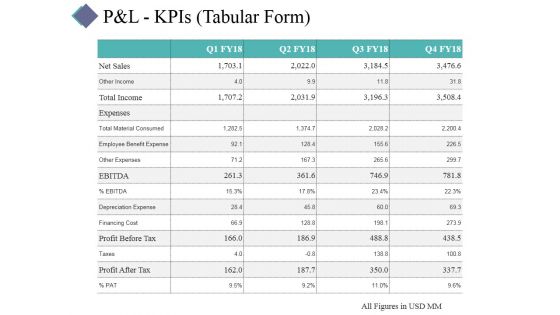
P And L Kpis Template 1 Ppt PowerPoint Presentation Portfolio Visual Aids
This is a p and l kpis template 1 ppt powerpoint presentation portfolio visual aids. This is a four stage process. The stages in this process are business, table, management, analysis, strategy.
P And L Kpis Template 2 Ppt PowerPoint Presentation Summary Icon
This is a p and l kpis template 2 ppt powerpoint presentation summary icon. This is a four stage process. The stages in this process are revenue, cogs, operating profit, net profit.

Cash Flow Statement Kpis Tabular Form Ppt PowerPoint Presentation Summary Elements
This is a cash flow statement kpis tabular form ppt powerpoint presentation summary elements. This is a four stage process. The stages in this process are net increase cash, financial activities, operations, investing activities.

Cash Flow Statement Kpis Template Ppt PowerPoint Presentation Ideas Visual Aids
This is a cash flow statement kpis template ppt powerpoint presentation ideas visual aids. This is a four stage process. The stages in this process are operations, financing activities, investing activities, net increase in cash.
P And L Kpis Template 1 Ppt PowerPoint Presentation Icon Graphics Download
This is a p and l kpis template 1 ppt powerpoint presentation icon graphics download. This is a four stage process. The stages in this process are net sales, total income, expenses, financing cost, profit after tax.

P And L Kpis Template 2 Ppt PowerPoint Presentation Inspiration Grid
This is a p and l kpis template 2 ppt powerpoint presentation inspiration grid. This is a four stage process. The stages in this process are revenue, cogs, operating profit, net profit.

Balance Sheet Kpis Template 1 Ppt PowerPoint Presentation Professional Background Images
This is a balance sheet kpis template 1 ppt powerpoint presentation professional background images. This is a four stage process. The stages in this process are shareholders equity, trade payable, short term provisions, current liabilities, total liabilities.
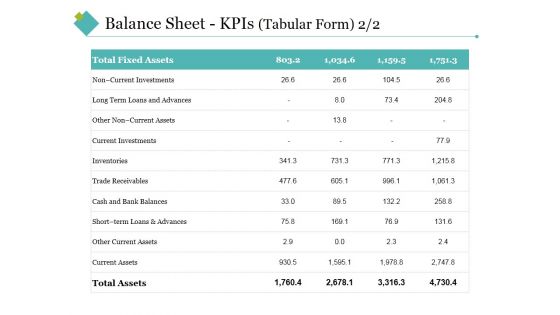
Balance Sheet Kpis Template 2 Ppt PowerPoint Presentation Infographic Template Background Images
This is a balance sheet kpis template 2 ppt powerpoint presentation infographic template background images. This is a four stage process. The stages in this process are total fixed assets, current assets, total assets, inventories, current investments.

Cash Flow Statement Kpis Template 2 Ppt PowerPoint Presentation Portfolio Template
This is a cash flow statement kpis template 2 ppt powerpoint presentation portfolio template. This is a four stage process. The stages in this process are operations, financing activities, investing activities, net increase in cash.
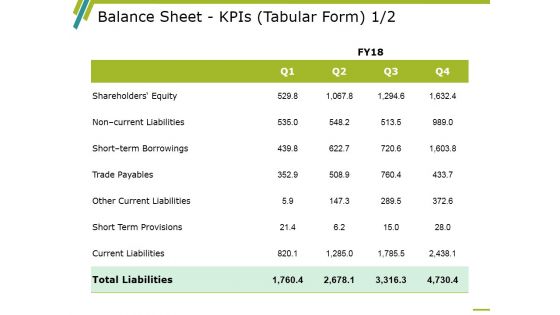
Balance Sheet Kpis Template 1 Ppt PowerPoint Presentation Infographic Template Example 2015
This is a balance sheet kpis template 1 ppt powerpoint presentation infographic template example 2015. This is a four stage process. The stages in this process are balance sheet, finance, marketing, strategy, analysis.

Balance Sheet Kpis Template 2 Ppt PowerPoint Presentation Outline Graphics Pictures
This is a balance sheet kpis template 2 ppt powerpoint presentation outline graphics pictures. This is a four stage process. The stages in this process are balance sheet, finance, marketing, strategy, analysis.

 Home
Home