Metrics

Post Implementation Other Operation And Financial Kpis Summary PDF
The slide provides five years graphs 2022F to 2026F forecasted number of major KPIs key performance indicators, that might help to track the performance of ABC Railway. Covered KPIs include Revenue, Total Passengers, operating income, customer satisfaction rate etc.Deliver and pitch your topic in the best possible manner with this post implementation other operation and financial KPIs summary pdf. Use them to share invaluable insights on total passengers, operating income, revenue, 2022 to 2026 and impress your audience. This template can be altered and modified as per your expectations. So, grab it now.
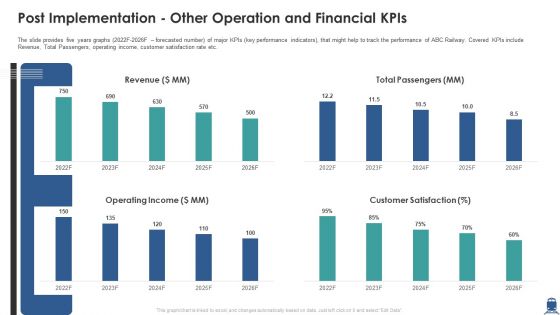
Post Implementation Other Operation And Financial Kpis Inspiration PDF
The slide provides five years graphs 2022F-2026F forecasted number of major KPIs key performance indicators, that might help to track the performance of ABC Railway. Covered KPIs include Revenue, Total Passengers, operating income, customer satisfaction rate etc. Deliver and pitch your topic in the best possible manner with this post implementation other operation and financial kpis inspiration pdf. Use them to share invaluable insights on revenue, operating income, customer satisfaction and impress your audience. This template can be altered and modified as per your expectations. So, grab it now.
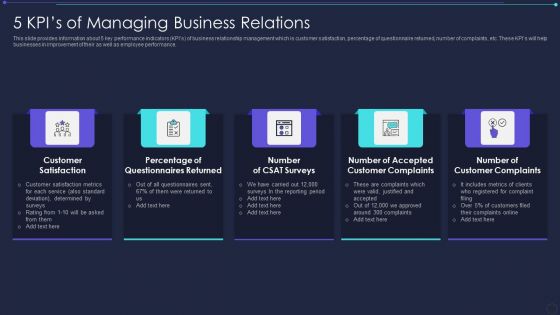
5 Kpis Of Managing Business Relations Elements PDF
This slide provides information about 5 key performance indicators KPIs of business relationship management which is customer satisfaction, percentage of questionnaire returned, number of complaints, etc. These KPIs will help businesses in improvement of their as well as employee performance. Presenting 5 kpis of managing business relations elements pdf to dispense important information. This template comprises five stages. It also presents valuable insights into the topics including customer satisfaction, determined surveys. This is a completely customizable PowerPoint theme that can be put to use immediately. So, download it and address the topic impactfully.

Kpis For E Commerce Project Management Ppt Styles Outline PDF
Mentioned slide showcase various KPIs which can be used by a firm for e-Commerce project management. Total sales, number of orders, total customers, number of items, shopping cart abandonment rate and conversion rate are the KPIs highlighted in the slide. Showcasing this set of slides titled Kpis For E Commerce Project Management Ppt Styles Outline PDF. The topics addressed in these templates are Total Number Order, Number Customer, Total Number Items. All the content presented in this PPT design is completely editable. Download it and make adjustments in color, background, font etc. as per your unique business setting.

Major Kpis For Stock Performance Management Guidelines PDF
This slide shows important KPIs for inventory performance management for presenting all aspects related to inventory in defined manner. It include KPIs like perfect order management, inventory turnover and carrying cost etc. Presenting Major Kpis For Stock Performance Management Guidelines PDF to dispense important information. This template comprises Four stages. It also presents valuable insights into the topics including Perfect Order Performance, Inventory Turnover, Carrying Cost. This is a completely customizable PowerPoint theme that can be put to use immediately. So, download it and address the topic impactfully.
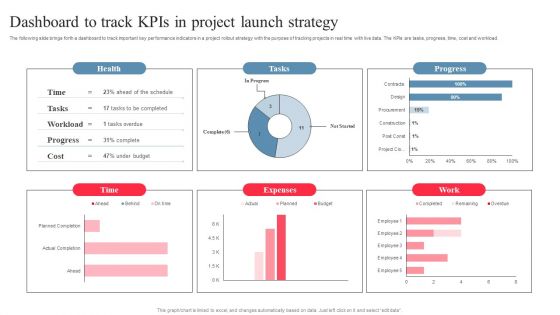
Dashboard To Track Kpis In Project Launch Strategy Pictures PDF
The following slide brings forth a dashboard to track important key performance indicators in a project rollout strategy with the purpose of tracking projects in real time with live data. The KPIs are tasks, progress, time, cost and workload. Showcasing this set of slides titled Dashboard To Track Kpis In Project Launch Strategy Pictures PDF. The topics addressed in these templates are Expenses, Project Launch Strategy, Dashboard To Track Kpis. All the content presented in this PPT design is completely editable. Download it and make adjustments in color, background, font etc. as per your unique business setting.
Growth Stage In Product Lifecycle With Tracking Kpis Diagrams PDF
This slide covers summary of growth stage in PLC to provide insights on KPIs essential for tracking product. It includes tracking KPIs. Want to ace your presentation in front of a live audience Our Growth Stage In Product Lifecycle With Tracking Kpis Diagrams PDF can help you do that by engaging all the users towards you. Slidegeeks experts have put their efforts and expertise into creating these impeccable powerpoint presentations so that you can communicate your ideas clearly. Moreover, all the templates are customizable, and easy to edit and downloadable. Use these for both personal and commercial use.

Operational Marketing Tactical Plan Kpis To Track Performance Background PDF
This slide provides KPIs to determine the overall effectiveness of the companys marketing plan. These include KPIs such as cost per lead, cost per customer acquisition, marketing rate of investment, sales qualified leads, and sales revenue. Presenting Operational Marketing Tactical Plan Kpis To Track Performance Background PDF to dispense important information. This template comprises five stages. It also presents valuable insights into the topics including Cost Per Lead, Cost Per Customer Acquisition, Sales Qualified Leads. This is a completely customizable PowerPoint theme that can be put to use immediately. So, download it and address the topic impactfully.
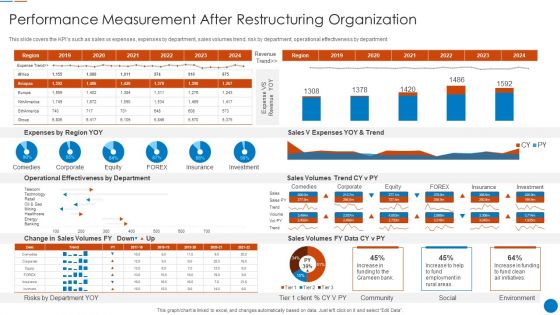
Organizational Restructuring Process Performance Measurement After Restructuring Organization Download PDF
This slide covers the KPIs such as sales vs expenses, expenses by department, sales volumes trend, risk by department, operational effectiveness by department Deliver an awe inspiring pitch with this creative Organizational Restructuring Process Performance Measurement After Restructuring Organization Download PDF bundle. Topics like Operational Effectiveness Department, Expenses By Region, Sales Volumes can be discussed with this completely editable template. It is available for immediate download depending on the needs and requirements of the user.

Business Restructuring Performance Measurement After Business Restructuring Themes PDF
This slide covers the KPIs such as sales vs expenses, expenses by department, sales volumes trend, risk by department, operational effectiveness by department. Deliver an awe inspiring pitch with this creative Business Restructuring Performance Measurement After Business Restructuring Themes PDF bundle. Topics like Sales V Expenses, YOY And Trend, Expenses Region YOY can be discussed with this completely editable template. It is available for immediate download depending on the needs and requirements of the user.
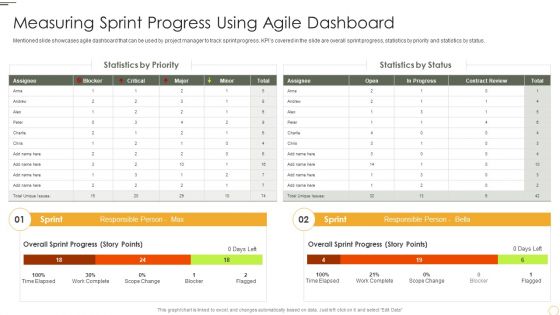
Measuring Sprint Progress Using Agile Dashboard Graphics PDF
Mentioned slide showcases agile dashboard that can be used by project manager to track sprint progress. KPIs covered in the slide are overall sprint progress, statistics by priority and statistics by status.Deliver an awe inspiring pitch with this creative Measuring Sprint Progress Using Agile Dashboard Graphics PDF bundle. Topics like Statistics By Priority, Statistics Status, Responsible Person can be discussed with this completely editable template. It is available for immediate download depending on the needs and requirements of the user.
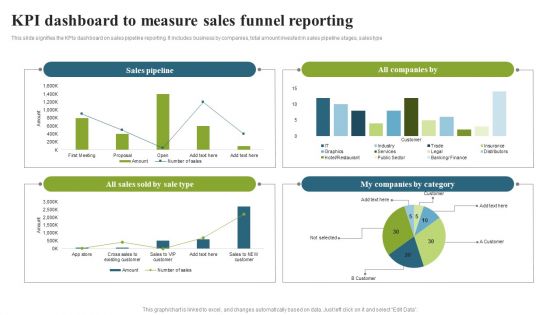
KPI Dashboard To Measure Sales Funnel Reporting Template PDF
This slide signifies the KPIs dashboard on sales pipeline reporting. It includes business by companies, total amount invested in sales pipeline stages, sales type. Showcasing this set of slides titled KPI Dashboard To Measure Sales Funnel Reporting Template PDF. The topics addressed in these templates are Sales Pipeline, Companies Category, Sales Sold. All the content presented in this PPT design is completely editable. Download it and make adjustments in color, background, font etc. as per your unique business setting.

Key Measures For Customer Satisfaction Powerpoint Templates
This is a key measures for customer satisfaction powerpoint templates. This is a one stage process. The stages in this process are excellent, very good, good, poor, bad.
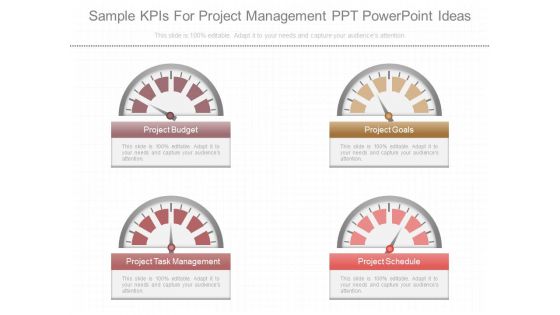
Sample Kpis For Project Management Ppt Powerpoint Ideas
This is a sample kpis for project management ppt powerpoint ideas. This is a four stage process. The stages in this process are project budget, project goals, project task management, project schedule.
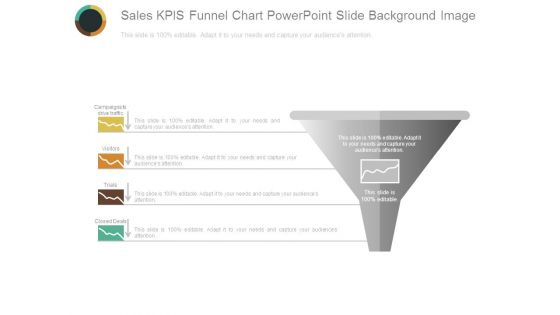
Sales Kpis Funnel Chart Powerpoint Slide Background Image
This is a sales kpis funnel chart powerpoint slide background image. This is a one stage process. The stages in this process are campaigns to drive traffic, visitors, trials, closed deals, sales.
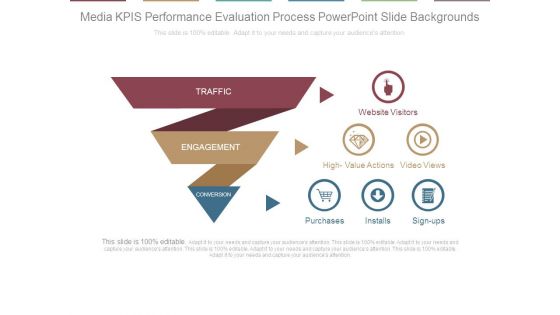
Media Kpis Performance Evaluation Process Powerpoint Slide Backgrounds
This is a media kpis performance evaluation process powerpoint slide backgrounds. This is a three stage process. The stages in this process are traffic, engagement, conversion, purchases, installs, sign ups, video views, high value actions, website visitors.
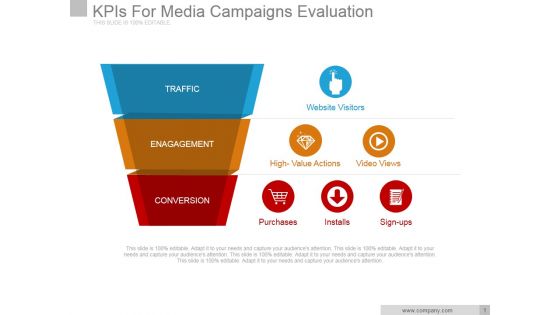
Kpis For Media Campaigns Evaluation Ppt PowerPoint Presentation Deck
This is a kpis for media campaigns evaluation ppt powerpoint presentation deck. This is a three stage process. The stages in this process are traffic, engagement, conversion, website visitors.
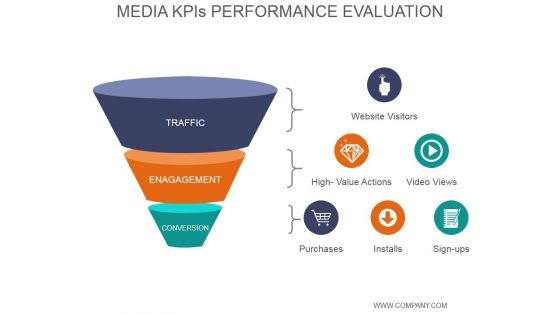
Media Kpis Performance Evaluation Ppt PowerPoint Presentation Tips
This is a media kpis performance evaluation ppt powerpoint presentation tips. This is a three stage process. The stages in this process are traffic, engagement, conversion, purchases, installs, sign ups, high value actions, video views, website visitors.

Media Kpis Performance Evaluation Ppt PowerPoint Presentation Topics
This is a media kpis performance evaluation ppt powerpoint presentation topics. This is a three stage process. The stages in this process are traffic, engagement, conversion, website, visitors, high value actions, video views, purchases, installs, sign ups.

Pandl Kpis Tabular Form Ppt PowerPoint Presentation Visual Aids
This is a pandl kpis tabular form ppt powerpoint presentation visual aids. This is a four stage process. The stages in this process are revenue, cogs, operating profit, net profit.
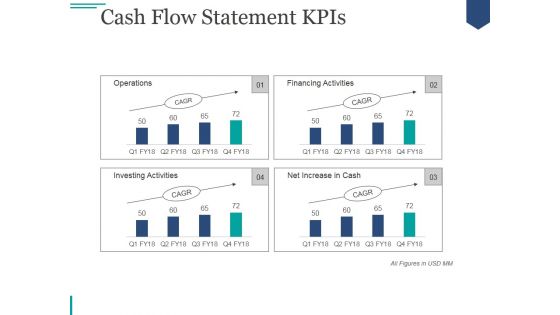
Cash Flow Statement Kpis Ppt PowerPoint Presentation Deck
This is a cash flow statement kpis ppt powerpoint presentation deck. This is a four stage process. The stages in this process are operations, financing activities, investing activities, net increase in cash.

Balance Sheet Kpis Ppt PowerPoint Presentation Model Example Topics
This is a balance sheet kpis ppt powerpoint presentation model example topics. This is a four stage process. The stages in this process are shareholders equity, trade payables, other current liabilities, short term provisions, current liabilities, total liabilities.
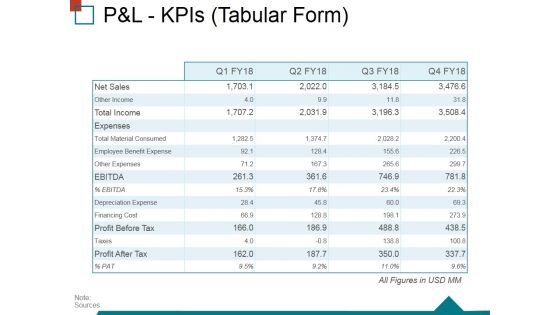
Pandl Kpis Tabular Form Ppt PowerPoint Presentation Ideas Structure
This is a pandl kpis tabular form ppt powerpoint presentation ideas structure. This is a four stage process. The stages in this process are operating profit, revenue, cogs, net profit.
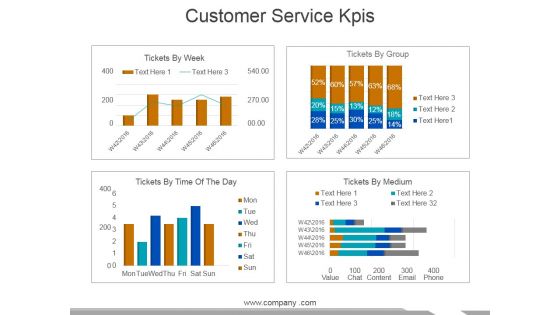
Customer Service Kpis Template 2 Ppt PowerPoint Presentation Show Structure
This is a customer service kpis template 2 ppt powerpoint presentation show structure. This is a four stage process. The stages in this process are tickets by week, tickets by group, tickets by time of the day, tickets by medium.
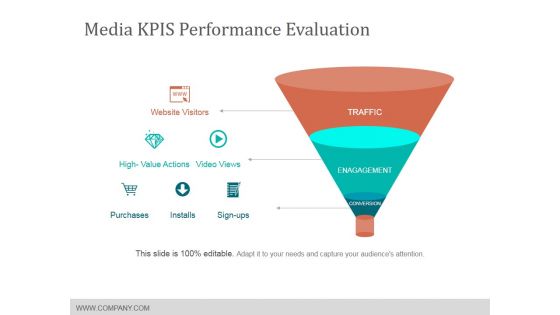
Media Kpis Performance Evaluation Ppt PowerPoint Presentation File Templates
This is a media kpis performance evaluation ppt powerpoint presentation file templates. This is a three stage process. The stages in this process are website visitors, purchases, installs, sign ups.

Balance Sheet Kpis Template 2 Ppt PowerPoint Presentation Ideas Graphics
This is a balance sheet kpis template 2 ppt powerpoint presentation ideas graphics. This is a four stage process. The stages in this process are current assets, current liabilities, total assets, total liabilities.
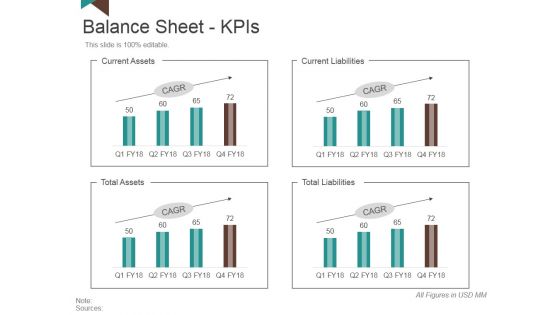
Balance Sheet Kpis Template 3 Ppt PowerPoint Presentation Slides Brochure
This is a balance sheet kpis template 3 ppt powerpoint presentation slides brochure. This is a four stage process. The stages in this process are current assets, current liabilities, total liabilities, total assets.

Balance Sheet Kpis Tabular Form Ppt PowerPoint Presentation Professional Display
This is a balance sheet kpis tabular form ppt powerpoint presentation professional display. This is a four stage process. The stages in this process are current assets, current liabilities, total assets, total liabilities.

Balance Sheet Kpis Template Ppt PowerPoint Presentation Slides Inspiration
This is a balance sheet kpis template ppt powerpoint presentation slides inspiration. This is a four stage process. The stages in this process are shareholders equity, short term borrowings, trade payables, other current liabilities.

Balance Sheet Kpis Ppt PowerPoint Presentation Infographics Example File
This is a balance sheet kpis ppt powerpoint presentation infographics example file. This is a four stage process. The stages in this process are current investments, inventories, trade receivables, cash and bank balances, current assets.

Pandl Kpis Tabular Form Ppt PowerPoint Presentation Summary Layout
This is a pandl kpis tabular form ppt powerpoint presentation summary layout. This is a four stage process. The stages in this process are revenue, cogs, operating profit, net profit.
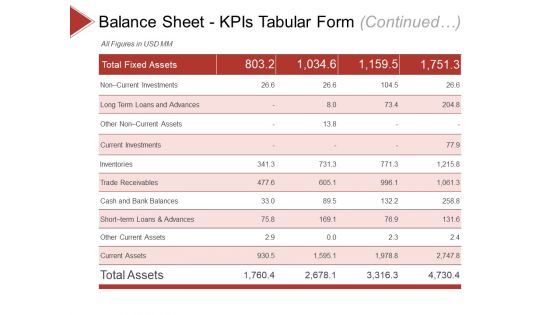
Balance Sheet Kpis Template 1 Ppt PowerPoint Presentation Diagram Ppt
This is a balance sheet kpis template 1 ppt powerpoint presentation diagram ppt. This is a four stage process. The stages in this process are non current investments, current investments, inventories, trade receivables, trade receivables.
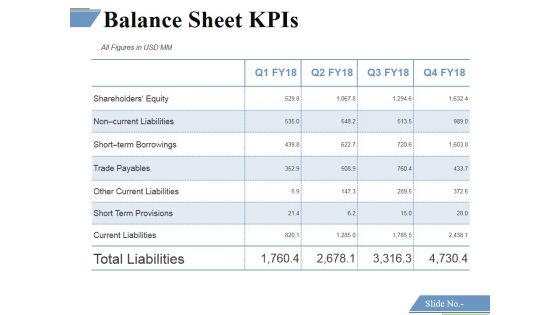
Balance Sheet Kpis Template 2 Ppt PowerPoint Presentation Portfolio Portrait
This is a balance sheet kpis template 2 ppt powerpoint presentation portfolio portrait. This is a four stage process. The stages in this process are shareholders equity, non current liabilities, short term borrowings, trade payables, other current liabilities.

Balance Sheet Kpis Template 2 Ppt PowerPoint Presentation Portfolio Example
This is a balance sheet kpis template 2 ppt powerpoint presentation portfolio example. This is a four stage process. The stages in this process are non current investments, long term loans and advances, other non current assets, current investments, inventories.
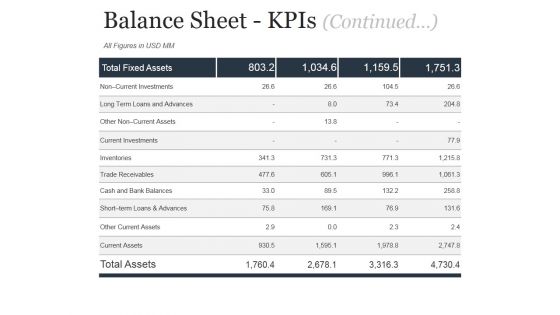
Balance Sheet Kpis Continued Ppt PowerPoint Presentation Templates
This is a balance sheet kpis continued ppt powerpoint presentation templates. This is a four stage process. The stages in this process are long term loans and advances, current investments, inventories, trade receivables, cash and bank balances.
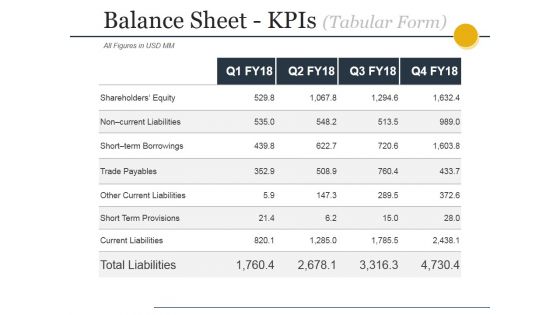
Balance Sheet Kpis Tabular Form Ppt PowerPoint Presentation Infographics Good
This is a balance sheet kpis tabular form ppt powerpoint presentation infographics good. This is a four stage process. The stages in this process are current assets, current liabilities, total assets, total liabilities.

Balance Sheet Kpis Ppt PowerPoint Presentation Portfolio Microsoft
This is a balance sheet kpis ppt powerpoint presentation portfolio microsoft. This is a four stage process. The stages in this process are shareholders equity, non current liabilities, short term borrowings, trade payables, other current liabilities.
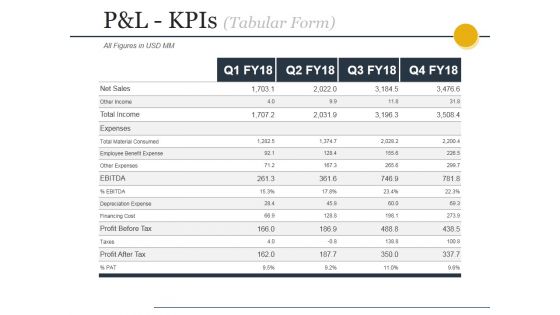
Pandl Kpis Tabular Form Ppt PowerPoint Presentation File Design Templates
This is a pandl kpis tabular form ppt powerpoint presentation file design templates. This is a four stage process. The stages in this process are revenue, cogs, operating profit, net profit.

Pandl Kpis Ppt PowerPoint Presentation Infographic Template Layout
This is a pandl kpis ppt powerpoint presentation infographic template layout. This is a four stage process. The stages in this process are net sales, other income, total income, expenses, total material consumed.

Balance Sheet Kpis Ppt PowerPoint Presentation Ideas Graphics Pictures
This is a balance sheet kpis ppt powerpoint presentation ideas graphics pictures. This is a four stage process. The stages in this process are trade payables, other current liabilities, short term provisions, current liabilities, total liabilities.
Pandl Kpis Tabular Form Ppt PowerPoint Presentation Gallery Icon
This is a pandl kpis tabular form ppt powerpoint presentation gallery icon. This is a four stage process. The stages in this process are revenue, cogs, operating profit, net profit.
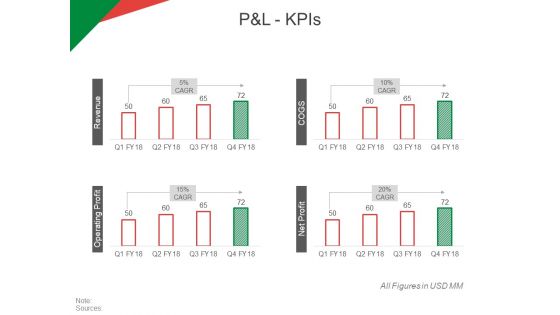
P And L Kpis Ppt PowerPoint Presentation Portfolio Slide
This is a p and l kpis ppt powerpoint presentation portfolio slide. This is a four stage process. The stages in this process are ebitda, profit before tax, profit after tax, expenses, net sales.
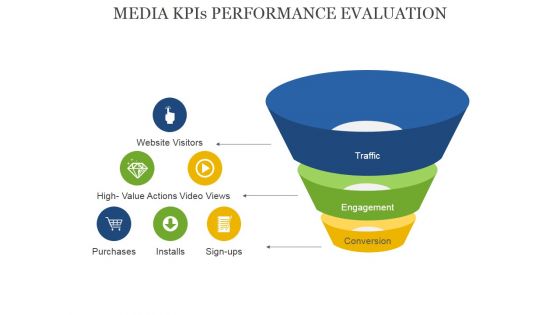
Media Kpis Performance Evaluation Ppt PowerPoint Presentation Professional Demonstration
This is a media kpis performance evaluation ppt powerpoint presentation professional demonstration. This is a three stage process. The stages in this process are website visitors, high value actions, purchases, installs, sign ups, conversion.
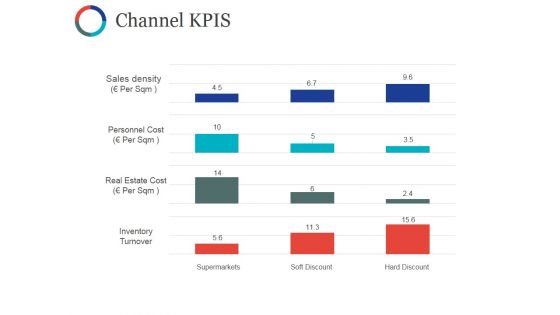
Channel Kpis Template Ppt PowerPoint Presentation Show Portfolio
This is a channel kpis template ppt powerpoint presentation show portfolio. This is a four stage process. The stages in this process are sales density, personnel cost, real estate cost, inventory turnover.
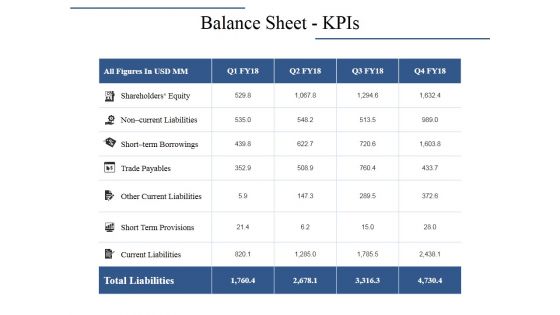
Balance Sheet Kpis Ppt PowerPoint Presentation Infographics Inspiration
This is a balance sheet kpis ppt powerpoint presentation infographics inspiration. This is a four stage process. The stages in this process are shareholders equity, trade payables, other current liabilities, current liabilities.
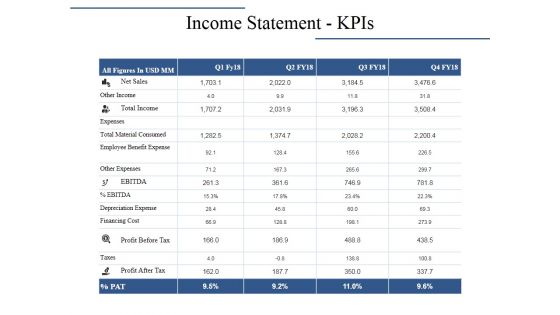
Income Statement Kpis Ppt PowerPoint Presentation Layouts Graphics Pictures
This is a income statement kpis ppt powerpoint presentation layouts graphics pictures. This is a four stage process. The stages in this process are net sales, total income, other income, profit before tax, expenses.

Balance Sheet Kpis Ppt PowerPoint Presentation Show Designs
This is a balance sheet kpis ppt powerpoint presentation show designs. This is a four stage process. The stages in this process are shareholders equity, non current liabilities, trade payables, total liabilities.
Income Statement Kpis Ppt PowerPoint Presentation Icon Background Images
This is a income statement kpis ppt powerpoint presentation icon background images. This is a four stage process. The stages in this process are net sales, other income, expenses, other expenses, total material consumed.
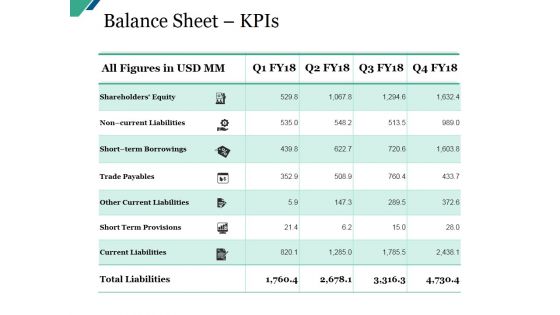
Balance Sheet Kpis Ppt PowerPoint Presentation Gallery Brochure
This is a balance sheet kpis ppt powerpoint presentation gallery brochure. This is a four stage process. The stages in this process are shareholders equity, non current liabilities, short term borrowings, trade payables, other current liabilities.

Income Statement Kpis Ppt PowerPoint Presentation Styles Clipart Images
This is a income statement kpis ppt powerpoint presentation styles clipart images. This is a four stage process. The stages in this process are net sales, other income, total income, expenses, total material consumed.

Cash Flow Statement Kpis Ppt PowerPoint Presentation File Styles
This is a cash flow statement kpis ppt powerpoint presentation file styles. This is a four stage process. The stages in this process are management, business, marketing, compere, strategy.

Cash Flow Statement Kpis Template 1 Ppt PowerPoint Presentation Templates
This is a cash flow statement kpis template 1 ppt powerpoint presentation templates. This is a four stage process. The stages in this process are cash flow from operations, cash flow from investing activities, cash flow from financing activities.

Cash Flow Statement Kpis Ppt PowerPoint Presentation Summary Graphics
This is a cash flow statement kpis ppt powerpoint presentation summary graphics. This is a four stage process. The stages in this process are business, compare sheet, management, analysis, strategy.

Balance Sheet Kpis Tabular Form Ppt PowerPoint Presentation Gallery Example
This is a balance sheet kpis tabular form ppt powerpoint presentation gallery example. This is a four stage process. The stages in this process are trade payables, other current liabilities, short term provisions, current liabilities, total liabilities.
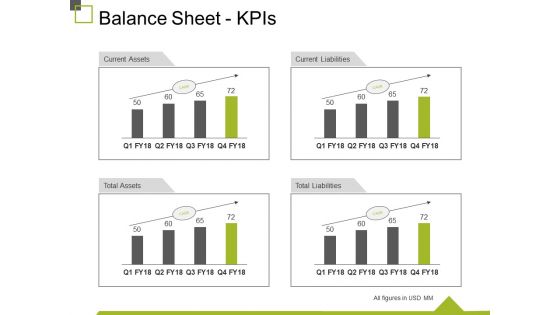
Balance Sheet Kpis Ppt PowerPoint Presentation Visual Aids Inspiration
This is a balance sheet kpis ppt powerpoint presentation visual aids inspiration. This is a four stage process. The stages in this process are current assets, current liabilities, total liabilities, total assets, business.
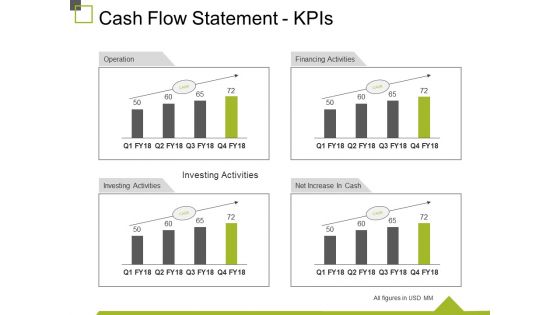
Cash Flow Statement Kpis Ppt PowerPoint Presentation Ideas Graphics
This is a cash flow statement kpis ppt powerpoint presentation ideas graphics. This is a four stage process. The stages in this process are operation, financing activities, net increase in cash, investing activities, business.

P And L Kpis Ppt PowerPoint Presentation Show Design Inspiration
This is a p and l kpis ppt powerpoint presentation show design inspiration. This is a four stage process. The stages in this process are revenue, operating profit, cogs, net increase in cash, business.
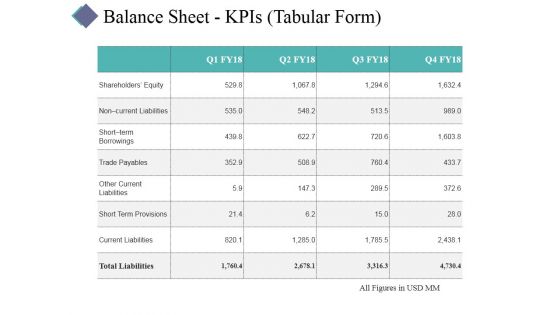
Balance Sheet Kpis Template 1 Ppt PowerPoint Presentation Gallery Visuals
This is a balance sheet kpis template 1 ppt powerpoint presentation gallery visuals. This is a four stage process. The stages in this process are business, table, management, analysis, success.
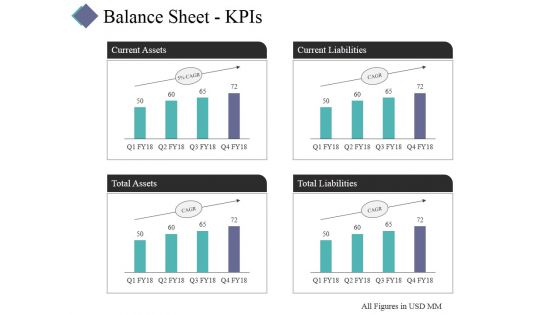
Balance Sheet Kpis Template 2 Ppt PowerPoint Presentation Ideas Show
This is a balance sheet kpis template 2 ppt powerpoint presentation ideas show. This is a four stage process. The stages in this process are current assets, total assets, total liabilities, current liabilities.
Balance Sheet Kpis Tabular Form Ppt PowerPoint Presentation Show Icons
This is a balance sheet kpis tabular form ppt powerpoint presentation show icons. This is a four stage process. The stages in this process are current assets, total assets, total liabilities, current liabilities.

 Home
Home