Metrics Dashboard

Implementation Of Digital Advancement Techniques Top Priority Insurance Operations Infographics PDF
The following slide outlines priority level of various operations performed through chatbots across insurance industry. This slide showcases functions for various phases such as product management, marketing , underwriting and policy acquisition, policy servicing and claims management. The Implementation Of Digital Advancement Techniques Top Priority Insurance Operations Infographics PDF is a compilation of the most recent design trends as a series of slides. It is suitable for any subject or industry presentation, containing attractive visuals and photo spots for businesses to clearly express their messages. This template contains a variety of slides for the user to input data, such as structures to contrast two elements, bullet points, and slides for written information. Slidegeeks is prepared to create an impression.

Nestle Performance Management Report Understanding Diversification Strategies To Assess Information PDF
This slide provides glimpse about multiple diversification strategies adopted by Nestle SA to boost its market presence with diversified product portfolio and global presence. It includes strategies such as product diversification, acquisitions and partnerships, etc. Do you have an important presentation coming up Are you looking for something that will make your presentation stand out from the rest Look no further than Nestle Performance Management Report Understanding Diversification Strategies To Assess Information PDF. With our professional designs, you can trust that your presentation will pop and make delivering it a smooth process. And with Slidegeeks, you can trust that your presentation will be unique and memorable. So why wait Grab Nestle Performance Management Report Understanding Diversification Strategies To Assess Information PDF today and make your presentation stand out from the rest.
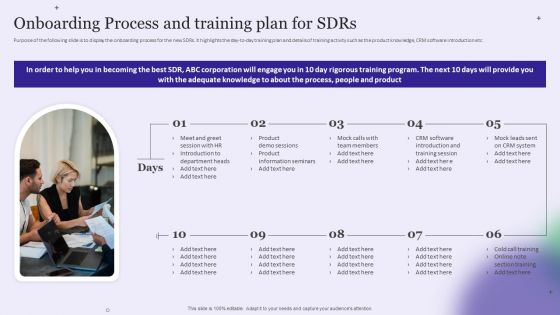
Strategy Playbook For Pharmaceutical Sales Representative Onboarding Process And Training Plan For Sdrs Diagrams PDF
The following slide displays the key KPIs that can be utilized by the sales development representative to measure their performance. It displays the various KPIs such as Meetings done, Calls made, mails sent, connection made etc. This is a Strategy Playbook For Pharmaceutical Sales Representative Onboarding Process And Training Plan For Sdrs Diagrams PDF template with various stages. Focus and dispense information on five stages using this creative set, that comes with editable features. It contains large content boxes to add your information on topics like Kpis For Business, Development Representative. You can also showcase facts, figures, and other relevant content using this PPT layout. Grab it now.
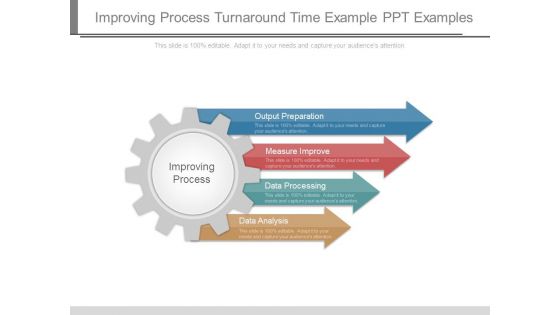
Improving Process Turnaround Time Example Ppt Examples
This is a improving process turnaround time example ppt examples. This is a four stage process. The stages in this process are output preparation, measure improve, data processing, data analysis, improving process.

Field Marketing Strategies To Boost Product Sales Sample Retail Audit Report To Analyze Pictures PDF
This slide showcases sample of audit report that can help organization to access product performance in market and implement solutions to rectify them. Its key elements are audit duration, target retail stores, promotion audit results, retailer audit results, merchandising audit results. The best PPT templates are a great way to save time, energy, and resources. Slidegeeks have 100 percent editable powerpoint slides making them incredibly versatile. With these quality presentation templates, you can create a captivating and memorable presentation by combining visually appealing slides and effectively communicating your message. Download Field Marketing Strategies To Boost Product Sales Sample Retail Audit Report To Analyze Pictures PDF from Slidegeeks and deliver a wonderful presentation.
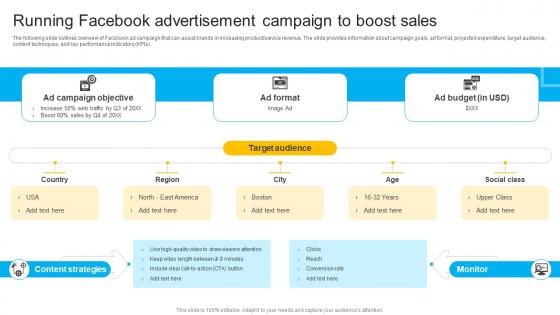
How To Create Cost Effective Running Facebook Advertisement Campaign Strategy SS V
The following slide outlines overview of Facebook ad campaign that can assist brands in increasing product or service revenue. The slide provides information about campaign goals, ad format, projected expenditure, target audience, content techniques, and key performance indicators KPIs. From laying roadmaps to briefing everything in detail, our templates are perfect for you. You can set the stage with your presentation slides. All you have to do is download these easy-to-edit and customizable templates. How To Create Cost Effective Running Facebook Advertisement Campaign Strategy SS V will help you deliver an outstanding performance that everyone would remember and praise you for. Do download this presentation today.

Facebook Marketing Techniques Running Facebook Advertisement Campaign Strategy SS V
The following slide outlines overview of Facebook ad campaign that can assist brands in increasing product service revenue. The slide provides information about campaign goals, ad format, projected expenditure, target audience, content techniques, and key performance indicators KPIs . From laying roadmaps to briefing everything in detail, our templates are perfect for you. You can set the stage with your presentation slides. All you have to do is download these easy-to-edit and customizable templates. Facebook Marketing Techniques Running Facebook Advertisement Campaign Strategy SS V will help you deliver an outstanding performance that everyone would remember and praise you for. Do download this presentation today.

Stock Market Research Report Balance Sheet FY19 Tabular Form Investments Designs PDF
The purpose of the following slide is to display a tabular representation of the key performance indicators of the balance sheet for four quarters of FY 2019. These KPIs can be Current assets, Current Liability , Total Assets and Total Liabilities. This is a stock market research report balance sheet fy19 tabular form investments designs pdf template with various stages. Focus and dispense information on one stages using this creative set, that comes with editable features. It contains large content boxes to add your information on topics like non current investments, long term loans and advances, current investments, inventories, trade receivables. You can also showcase facts, figures, and other relevant content using this PPT layout. Grab it now.
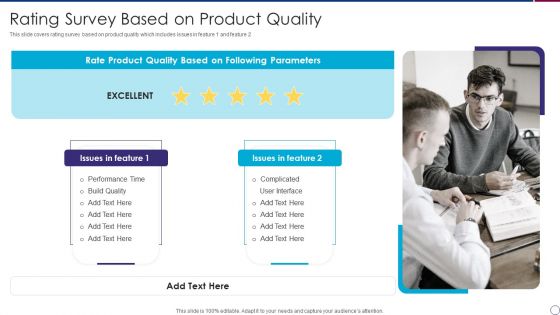
Rating Survey Based On Product Quality Infographics PDF
This slide covers rating survey based on product quality which includes issues in feature 1 and feature 2.Presenting Rating Survey Based On Product Quality Infographics PDF to dispense important information. This template comprises one stages. It also presents valuable insights into the topics including Product Quality, Performance Time, Issues Feature This is a completely customizable PowerPoint theme that can be put to use immediately. So, download it and address the topic impactfully.
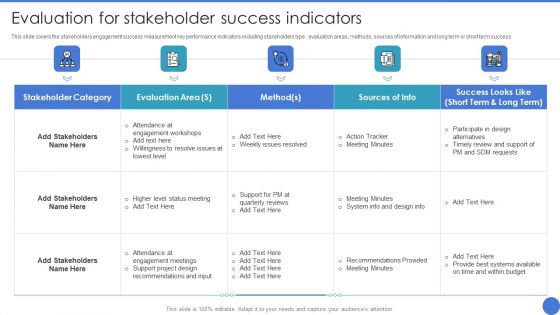
Managing Stakeholder Relationship Evaluation For Stakeholder Success Indicators Template PDF
This slide covers the stakeholders engagement success measurement key performance indicators including stakeholders type , evaluation areas, methods, sources of information and long term or short term success . Take your projects to the next level with our ultimate collection of Managing Stakeholder Relationship Evaluation For Stakeholder Success Indicators Template PDF. Slidegeeks has designed a range of layouts that are perfect for representing task or activity duration, keeping track of all your deadlines at a glance. Tailor these designs to your exact needs and give them a truly corporate look with your own brand colors theyll make your projects stand out from the rest.
KPI To Track Success Of Strategy Implementation Ppt Gallery Icon PDF
The slide shows the key Performance Indicator KPI s which will help the company to track the success rate of implemented strategies. Major KPIs include number of products sold, products manufactures, research and development expenses per year, customer satisfaction level, etc. Presenting kpi to track success of strategy implementation ppt gallery icon pdf to provide visual cues and insights. Share and navigate important information on one stage that need your due attention. This template can be used to pitch topics like products manufactured, development, target. In addtion, this PPT design contains high resolution images, graphics, etc, that are easily editable and available for immediate download.

Key Techniques To Enhance Cost Efficiency Results Indicating Cost Efficiency Improvement Sample PDF
The slide demonstrates the department wise results of implementing strategies to reduce the business expenses and improving the cost efficiency. Various departments included are production, marketing, operations, administration, etc. This Key Techniques To Enhance Cost Efficiency Results Indicating Cost Efficiency Improvement Sample PDF from Slidegeeks makes it easy to present information on your topic with precision. It provides customization options, so you can make changes to the colors, design, graphics, or any other component to create a unique layout. It is also available for immediate download, so you can begin using it right away. Slidegeeks has done good research to ensure that you have everything you need to make your presentation stand out. Make a name out there for a brilliant performance.

Retail Production Business Profile Company Products And Brand Overview With Net Earnings Infographics PDF
This slide highlights company products segment in detailed tabular format which also includes sub categories of beauty care, grooming, health care and home care product. From laying roadmaps to briefing everything in detail, our templates are perfect for you. You can set the stage with your presentation slides. All you have to do is download these easy to edit and customizable templates. Retail Production Business Profile Company Products And Brand Overview With Net Earnings Infographics PDF will help you deliver an outstanding performance that everyone would remember and praise you for. Do download this presentation today.
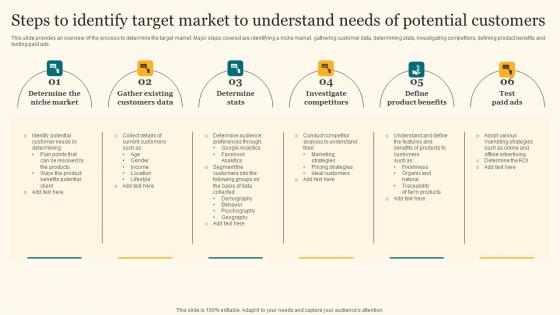
Steps To Identify Target Market To Understand Agricultural Product Promotion Infographics Pdf
This slide provides an overview of the process to determine the target market. Major steps covered are identifying a niche market, gathering customer data, determining stats, investigating competitors, defining product benefits and testing paid ads. From laying roadmaps to briefing everything in detail, our templates are perfect for you. You can set the stage with your presentation slides. All you have to do is download these easy-to-edit and customizable templates. Steps To Identify Target Market To Understand Agricultural Product Promotion Infographics Pdf will help you deliver an outstanding performance that everyone would remember and praise you for. Do download this presentation today.

Strategy Map Concept Ppt Portfolio Show PDF
Presenting strategy map concept ppt portfolio show pdf to provide visual cues and insights. Share and navigate important information on three stages that need your due attention. This template can be used to pitch topics like used to measure and provide feedback to organizations, data collection is crucial to providing quantitative results. In addition, this PPT design contains high-resolution images, graphics, etc, that are easily editable and available for immediate download.
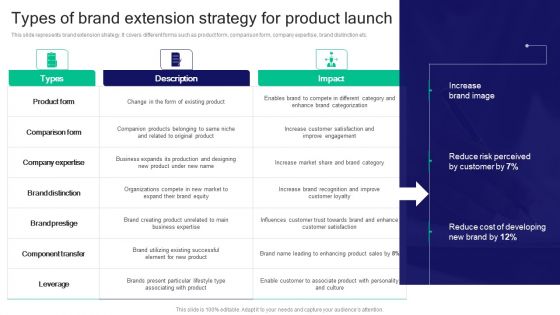
Strategies For Effective Product Types Of Brand Extension Strategy For Product Launch Infographics PDF
This slide represents brand extension strategy. It covers different forms such as product form, comparison form, company expertise, brand distinction etc. From laying roadmaps to briefing everything in detail, our templates are perfect for you. You can set the stage with your presentation slides. All you have to do is download these easy-to-edit and customizable templates. Strategies For Effective Product Types Of Brand Extension Strategy For Product Launch Infographics PDF will help you deliver an outstanding performance that everyone would remember and praise you for. Do download this presentation today.

Data Processing Services Delivery Why We Need Modern IT Solutions Ppt Show Background Image PDF
This slide defines the reasons that why there is need to implement modern IT solutions in the business along with the traditional KPIs and performance measures. This is a Data Processing Services Delivery Why We Need Modern IT Solutions Ppt Show Background Image PDF template with various stages. Focus and dispense information on three stages using this creative set, that comes with editable features. It contains large content boxes to add your information on topics like Customers, Businesses Dependent, Organizations. You can also showcase facts, figures, and other relevant content using this PPT layout. Grab it now.

Pie Chart Data Comparisons 5 Stages Business Plan Templates PowerPoint Slides
We present our pie chart data comparisons 5 stages business plan templates PowerPoint Slides.Present our Marketing PowerPoint Templates because Our PowerPoint Templates and Slides are Clear and concise. Use them and dispel any doubts your team may have. Present our Finance PowerPoint Templates because You can Create a matrix with our PowerPoint Templates and Slides. Feel the strength of your ideas click into place. Download our Business PowerPoint Templates because You can Inspire your team with our PowerPoint Templates and Slides. Let the force of your ideas flow into their minds. Present our Sales PowerPoint Templates because Our PowerPoint Templates and Slides are aesthetically designed to attract attention. We gaurantee that they will grab all the eyeballs you need. Present our Success PowerPoint Templates because Our PowerPoint Templates and Slides are specially created by a professional team with vast experience. They diligently strive to come up with the right vehicle for your brilliant Ideas. Use these PowerPoint slides for presentations relating to Analysis, Analyzing, Brands, Business, Chart, Colorful, Commerce, Compare, Comparison, Data, Economical, Finance, Financial, Grow, Growth, Market, Market Share, Marketing, Measure, Pen, Pie, Pie Chart, Presentation, Profit, Revenue, Sales, Sales Chat, Sales Increase, Share, Statistical, Success, Successful. The prominent colors used in the PowerPoint template are Blue, Gray, White.

Pie Chart Data Comparisons 5 Stages Examples Small Business Plans PowerPoint Slides
We present our pie chart data comparisons 5 stages examples small business plans PowerPoint Slides.Download our Marketing PowerPoint Templates because you can Set pulses racing with our PowerPoint Templates and Slides. They will raise the expectations of your team. Present our Finance PowerPoint Templates because Our PowerPoint Templates and Slides are the chords of your song. String them along and provide the lilt to your views. Download and present our Business PowerPoint Templates because It will Raise the bar of your Thoughts. They are programmed to take you to the next level. Download our Sales PowerPoint Templates because Our PowerPoint Templates and Slides will fulfill your every need. Use them and effectively satisfy the desires of your audience. Present our Success PowerPoint Templates because You can Be the puppeteer with our PowerPoint Templates and Slides as your strings. Lead your team through the steps of your script.Use these PowerPoint slides for presentations relating to Analysis, Analyzing, Brands, Business, Chart, Colorful, Commerce, Compare, Comparison, Data, Economical, Finance, Financial, Grow, Growth, Market, Market Share, Marketing, Measure, Pen, Pie, Pie Chart, Presentation, Profit, Revenue, Sales, Sales Chat, Sales Increase, Share, Statistical, Success, Successful. The prominent colors used in the PowerPoint template are Yellow, Gray, White.

Pie Chart Data Comparisons 5 Stages How To Develop Business Plan PowerPoint Templates
We present our pie chart data comparisons 5 stages how to develop business plan PowerPoint templates.Present our Marketing PowerPoint Templates because You can Be the star of the show with our PowerPoint Templates and Slides. Rock the stage with your ideas. Download and present our Finance PowerPoint Templates because Timeline crunches are a fact of life. Meet all deadlines using our PowerPoint Templates and Slides. Use our Business PowerPoint Templates because You can Be the puppeteer with our PowerPoint Templates and Slides as your strings. Lead your team through the steps of your script. Download and present our Sales PowerPoint Templates because Our PowerPoint Templates and Slides are a sure bet. Gauranteed to win against all odds. Download our Success PowerPoint Templates because Our PowerPoint Templates and Slides will provide weight to your words. They will bring out the depth of your thought process.Use these PowerPoint slides for presentations relating to Analysis, Analyzing, Brands, Business, Chart, Colorful, Commerce, Compare, Comparison, Data, Economical, Finance, Financial, Grow, Growth, Market, Market Share, Marketing, Measure, Pen, Pie, Pie Chart, Presentation, Profit, Revenue, Sales, Sales Chat, Sales Increase, Share, Statistical, Success, Successful. The prominent colors used in the PowerPoint template are Blue, Gray, White.
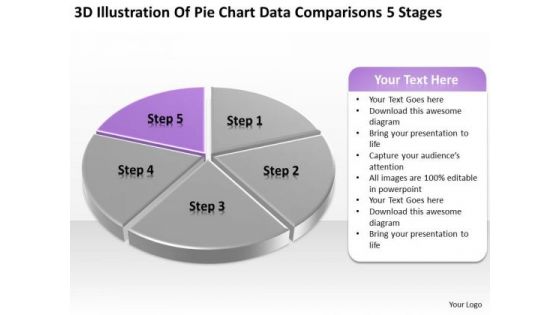
Pie Chart Data Comparisons 5 Stages Ppt Designing Business Plan PowerPoint Templates
We present our pie chart data comparisons 5 stages ppt designing business plan PowerPoint templates.Use our Marketing PowerPoint Templates because Our PowerPoint Templates and Slides are innately eco-friendly. Their high recall value negate the need for paper handouts. Download our Finance PowerPoint Templates because Our PowerPoint Templates and Slides are truly out of this world. Even the MIB duo has been keeping tabs on our team. Use our Business PowerPoint Templates because You should Bet on your luck with our PowerPoint Templates and Slides. Be assured that you will hit the jackpot. Present our Sales PowerPoint Templates because Our PowerPoint Templates and Slides are created with admirable insight. Use them and give your group a sense of your logical mind. Present our Success PowerPoint Templates because Our PowerPoint Templates and Slides are focused like a searchlight beam. They highlight your ideas for your target audience.Use these PowerPoint slides for presentations relating to Analysis, Analyzing, Brands, Business, Chart, Colorful, Commerce, Compare, Comparison, Data, Economical, Finance, Financial, Grow, Growth, Market, Market Share, Marketing, Measure, Pen, Pie, Pie Chart, Presentation, Profit, Revenue, Sales, Sales Chat, Sales Increase, Share, Statistical, Success, Successful. The prominent colors used in the PowerPoint template are Purple, Gray, White.
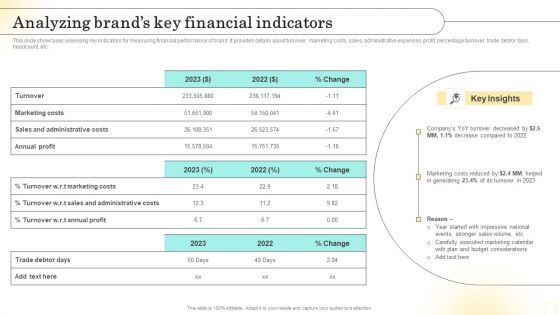
Emotional Marketing Strategy To Nurture Analyzing Brands Key Financial Indicators Demonstration PDF
This slide showcases assessing key indicators for measuring financial performance of brand. It provides details about turnover, marketing costs, sales, administrative expenses, profit, percentage turnover, trade debtor days, headcount, etc. Create an editable Emotional Marketing Strategy To Nurture Analyzing Brands Key Financial Indicators Demonstration PDF that communicates your idea and engages your audience. Whether youre presenting a business or an educational presentation, pre-designed presentation templates help save time. Emotional Marketing Strategy To Nurture Analyzing Brands Key Financial Indicators Demonstration PDF is highly customizable and very easy to edit, covering many different styles from creative to business presentations. Slidegeeks has creative team members who have crafted amazing templates. So, go and get them without any delay.

Apple Emotional Marketing Strategy Analyzing Brands Key Financial Indicators Rules PDF
This slide showcases assessing key indicators for measuring financial performance of brand. It provides details about turnover, marketing costs, sales, administrative expenses, profit, percentage turnover, trade debtor days, headcount, etc. Here you can discover an assortment of the finest PowerPoint and Google Slides templates. With these templates, you can create presentations for a variety of purposes while simultaneously providing your audience with an eye catching visual experience. Download Apple Emotional Marketing Strategy Analyzing Brands Key Financial Indicators Rules PDF to deliver an impeccable presentation. These templates will make your job of preparing presentations much quicker, yet still, maintain a high level of quality. Slidegeeks has experienced researchers who prepare these templates and write high quality content for you. Later on, you can personalize the content by editing the Apple Emotional Marketing Strategy Analyzing Brands Key Financial Indicators Rules PDF.

Marketing Commodities And Offerings Analyzing Brands Key Financial Indicators Demonstration PDF
This slide showcases assessing key indicators for measuring financial performance of brand. It provides details about turnover, marketing costs, sales, administrative expenses, profit, percentage turnover, trade debtor days, headcount, etc. Here you can discover an assortment of the finest PowerPoint and Google Slides templates. With these templates, you can create presentations for a variety of purposes while simultaneously providing your audience with an eye catching visual experience. Download Marketing Commodities And Offerings Analyzing Brands Key Financial Indicators Demonstration PDF to deliver an impeccable presentation. These templates will make your job of preparing presentations much quicker, yet still, maintain a high level of quality. Slidegeeks has experienced researchers who prepare these templates and write high quality content for you. Later on, you can personalize the content by editing the Marketing Commodities And Offerings Analyzing Brands Key Financial Indicators Demonstration PDF.
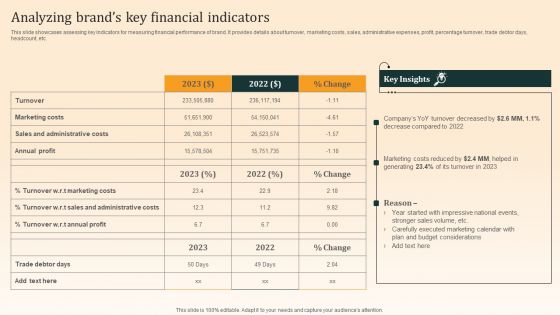
Nike Emotional Branding Strategy Analyzing Brands Key Financial Indicators Summary PDF
This slide showcases assessing key indicators for measuring financial performance of brand. It provides details about turnover, marketing costs, sales, administrative expenses, profit, percentage turnover, trade debtor days, headcount, etc. Create an editable Nike Emotional Branding Strategy Analyzing Brands Key Financial Indicators Summary PDF that communicates your idea and engages your audience. Whether youre presenting a business or an educational presentation, pre designed presentation templates help save time. Nike Emotional Branding Strategy Analyzing Brands Key Financial Indicators Summary PDF is highly customizable and very easy to edit, covering many different styles from creative to business presentations. Slidegeeks has creative team members who have crafted amazing templates. So, go and get them without any delay.

Construction Production Facilities Content Ppt Pictures Infographic Template PDF
Presenting this set of slides with name construction production facilities content ppt pictures infographic template pdf. This is a eleven stage process. The stages in this process are asset management process, deterioration modeling, capital budgeting, commissioning new facilities, performance and cost functions, interdependence, resiliency and security. This is a completely editable PowerPoint presentation and is available for immediate download. Download now and impress your audience.

Five Years Data Analytics Career Roadmap For Engineering Professional Introduction
Presenting our innovatively-structured five years data analytics career roadmap for engineering professional introduction Template. Showcase your roadmap process in different formats like PDF, PNG, and JPG by clicking the download button below. This PPT design is available in both Standard Screen and Widescreen aspect ratios. It can also be easily personalized and presented with modified font size, font type, color, and shapes to measure your progress in a clear way.
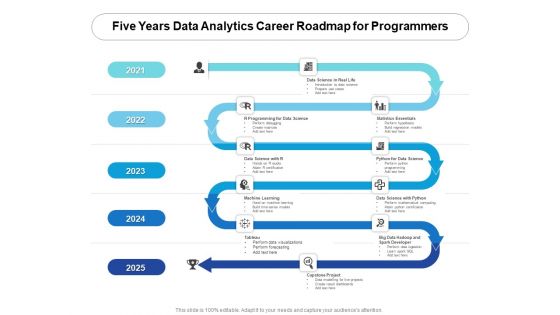
Five Years Data Analytics Career Roadmap For Programmers Pictures
Introducing our five years data analytics career roadmap for programmers pictures. This PPT presentation is Google Slides compatible, therefore, you can share it easily with the collaborators for measuring the progress. Also, the presentation is available in both standard screen and widescreen aspect ratios. So edit the template design by modifying the font size, font type, color, and shapes as per your requirements. As this PPT design is fully editable it can be presented in PDF, JPG and PNG formats.

Half Yearly Data Analytics Career Roadmap For Engineering Professional Themes
Presenting our innovatively-structured half yearly data analytics career roadmap for engineering professional themes Template. Showcase your roadmap process in different formats like PDF, PNG, and JPG by clicking the download button below. This PPT design is available in both Standard Screen and Widescreen aspect ratios. It can also be easily personalized and presented with modified font size, font type, color, and shapes to measure your progress in a clear way.
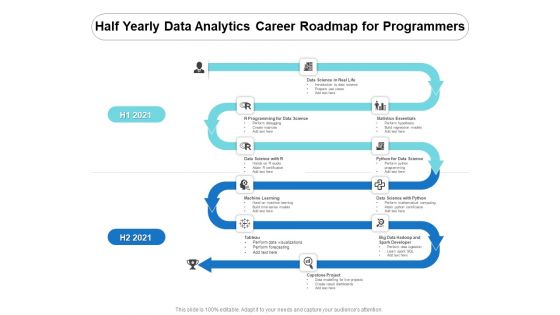
Half Yearly Data Analytics Career Roadmap For Programmers Demonstration
Introducing our half yearly data analytics career roadmap for programmers demonstration. This PPT presentation is Google Slides compatible, therefore, you can share it easily with the collaborators for measuring the progress. Also, the presentation is available in both standard screen and widescreen aspect ratios. So edit the template design by modifying the font size, font type, color, and shapes as per your requirements. As this PPT design is fully editable it can be presented in PDF, JPG and PNG formats.
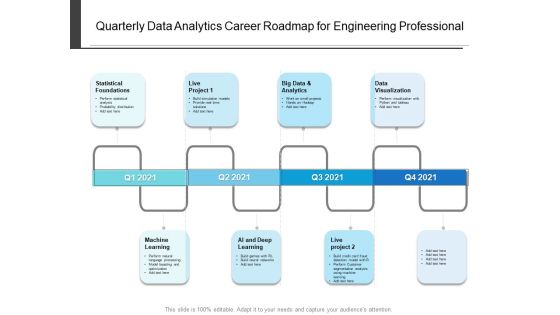
Quarterly Data Analytics Career Roadmap For Engineering Professional Diagrams
Presenting our innovatively-structured quarterly data analytics career roadmap for engineering professional diagrams Template. Showcase your roadmap process in different formats like PDF, PNG, and JPG by clicking the download button below. This PPT design is available in both Standard Screen and Widescreen aspect ratios. It can also be easily personalized and presented with modified font size, font type, color, and shapes to measure your progress in a clear way.
Quarterly Data Analytics Career Roadmap For Programmers Icons
Introducing our quarterly data analytics career roadmap for programmers icons. This PPT presentation is Google Slides compatible, therefore, you can share it easily with the collaborators for measuring the progress. Also, the presentation is available in both standard screen and widescreen aspect ratios. So edit the template design by modifying the font size, font type, color, and shapes as per your requirements. As this PPT design is fully editable it can be presented in PDF, JPG and PNG formats.
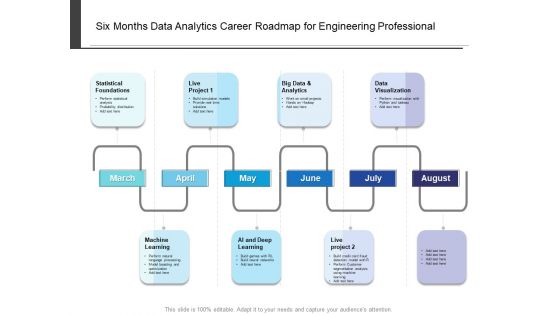
Six Months Data Analytics Career Roadmap For Engineering Professional Mockup
Presenting our innovatively-structured six months data analytics career roadmap for engineering professional mockup Template. Showcase your roadmap process in different formats like PDF, PNG, and JPG by clicking the download button below. This PPT design is available in both Standard Screen and Widescreen aspect ratios. It can also be easily personalized and presented with modified font size, font type, color, and shapes to measure your progress in a clear way.

Six Months Data Analytics Career Roadmap For Programmers Demonstration
Introducing our six months data analytics career roadmap for programmers demonstration. This PPT presentation is Google Slides compatible, therefore, you can share it easily with the collaborators for measuring the progress. Also, the presentation is available in both standard screen and widescreen aspect ratios. So edit the template design by modifying the font size, font type, color, and shapes as per your requirements. As this PPT design is fully editable it can be presented in PDF, JPG and PNG formats.
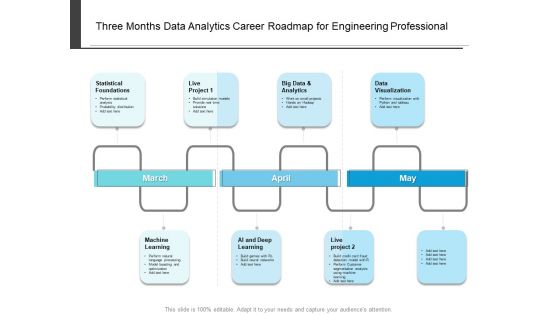
Three Months Data Analytics Career Roadmap For Engineering Professional Designs
Presenting our innovatively-structured three months data analytics career roadmap for engineering professional designs Template. Showcase your roadmap process in different formats like PDF, PNG, and JPG by clicking the download button below. This PPT design is available in both Standard Screen and Widescreen aspect ratios. It can also be easily personalized and presented with modified font size, font type, color, and shapes to measure your progress in a clear way.

Three Months Data Analytics Career Roadmap For Programmers Rules
Introducing our three months data analytics career roadmap for programmers rules. This PPT presentation is Google Slides compatible, therefore, you can share it easily with the collaborators for measuring the progress. Also, the presentation is available in both standard screen and widescreen aspect ratios. So edit the template design by modifying the font size, font type, color, and shapes as per your requirements. As this PPT design is fully editable it can be presented in PDF, JPG and PNG formats.
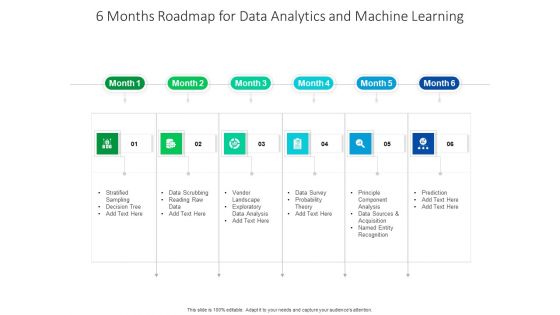
6 Months Roadmap For Data Analytics And Machine Learning Rules
Introducing our 6 months roadmap for data analytics and machine learning rules. This PPT presentation is Google Slides compatible, therefore, you can share it easily with the collaborators for measuring the progress. Also, the presentation is available in both standard screen and widescreen aspect ratios. So edit the template design by modifying the font size, font type, color, and shapes as per your requirements. As this PPT design is fully editable it can be presented in PDF, JPG and PNG formats.

Half Yearly Roadmap For Data Analytics And Machine Learning Diagrams
Introducing our half yearly roadmap for data analytics and machine learning diagrams. This PPT presentation is Google Slides compatible, therefore, you can share it easily with the collaborators for measuring the progress. Also, the presentation is available in both standard screen and widescreen aspect ratios. So edit the template design by modifying the font size, font type, color, and shapes as per your requirements. As this PPT design is fully editable it can be presented in PDF, JPG and PNG formats.
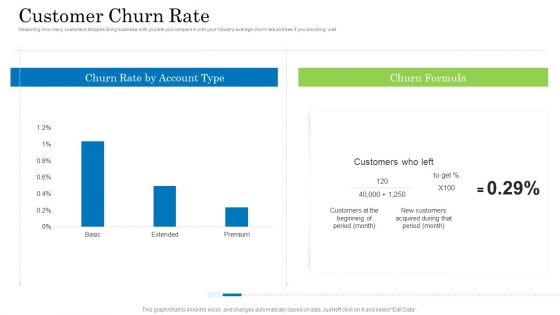
Customer Behavioral Data And Analytics Customer Churn Rate Guidelines PDF
Measuring how many customers stopped doing business with you lets you compare it with your industry average churn rate and see if you are doing well. Deliver and pitch your topic in the best possible manner with this customer behavioral data and analytics customer churn rate guidelines pdf. Use them to share invaluable insights on customer churn rate and impress your audience. This template can be altered and modified as per your expectations. So, grab it now.

Customer Behavioral Data And Analytics Customer Retention Rate Graphics PDF
Customer Retention Rate measures how many customers continue to be customers in the subsequent year. You get to know if your retention strategies are working or not. Deliver and pitch your topic in the best possible manner with this customer behavioral data and analytics customer retention rate graphics pdf. Use them to share invaluable insights on customer retention rate and impress your audience. This template can be altered and modified as per your expectations. So, grab it now.
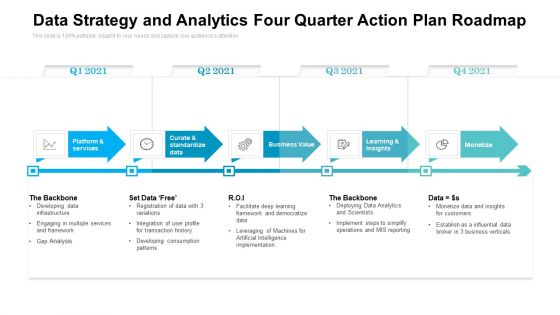
Data Strategy And Analytics Four Quarter Action Plan Roadmap Slides
Presenting our innovatively structured data strategy and analytics four quarter action plan roadmap slides Template. Showcase your roadmap process in different formats like PDF, PNG, and JPG by clicking the download button below. This PPT design is available in both Standard Screen and Widescreen aspect ratios. It can also be easily personalized and presented with modified font size, font type, color, and shapes to measure your progress in a clear way.

Data Strategy And Analytics Half Year Action Plan Roadmap Clipart
Introducing our data strategy and analytics half year action plan roadmap clipart. This PPT presentation is Google Slides compatible, therefore, you can share it easily with the collaborators for measuring the progress. Also, the presentation is available in both standard screen and widescreen aspect ratios. So edit the template design by modifying the font size, font type, color, and shapes as per your requirements. As this PPT design is fully editable it can be presented in PDF, JPG and PNG formats.

Data Strategy Governance And Analytics Four Quarter Roadmap Themes
Presenting our innovatively structured data strategy governance and analytics four quarter roadmap themes Template. Showcase your roadmap process in different formats like PDF, PNG, and JPG by clicking the download button below. This PPT design is available in both Standard Screen and Widescreen aspect ratios. It can also be easily personalized and presented with modified font size, font type, color, and shapes to measure your progress in a clear way.

Data Strategy Governance And Analytics Half Year Roadmap Portrait
Introducing our data strategy governance and analytics half year roadmap portrait. This PPT presentation is Google Slides compatible, therefore, you can share it easily with the collaborators for measuring the progress. Also, the presentation is available in both standard screen and widescreen aspect ratios. So edit the template design by modifying the font size, font type, color, and shapes as per your requirements. As this PPT design is fully editable it can be presented in PDF, JPG and PNG formats.

Multistep Strategy Data Analytics Four Quarter Roadmap Guidelines
Presenting our innovatively structured multistep strategy data analytics four quarter roadmap guidelines Template. Showcase your roadmap process in different formats like PDF, PNG, and JPG by clicking the download button below. This PPT design is available in both Standard Screen and Widescreen aspect ratios. It can also be easily personalized and presented with modified font size, font type, color, and shapes to measure your progress in a clear way.

Multistep Strategy Data Analytics Half Year Roadmap Summary
Introducing our multistep strategy data analytics half year roadmap summary. This PPT presentation is Google Slides compatible, therefore, you can share it easily with the collaborators for measuring the progress. Also, the presentation is available in both standard screen and widescreen aspect ratios. So edit the template design by modifying the font size, font type, color, and shapes as per your requirements. As this PPT design is fully editable it can be presented in PDF, JPG and PNG formats.
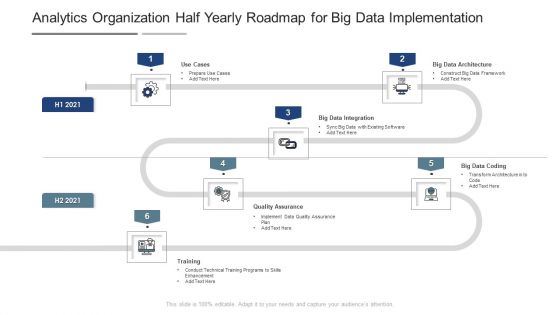
Analytics Organization Half Yearly Roadmap For Big Data Implementation Template
Presenting our innovatively structured analytics organization half yearly roadmap for big data implementation template Template. Showcase your roadmap process in different formats like PDF, PNG, and JPG by clicking the download button below. This PPT design is available in both Standard Screen and Widescreen aspect ratios. It can also be easily personalized and presented with modified font size, font type, color, and shapes to measure your progress in a clear way.
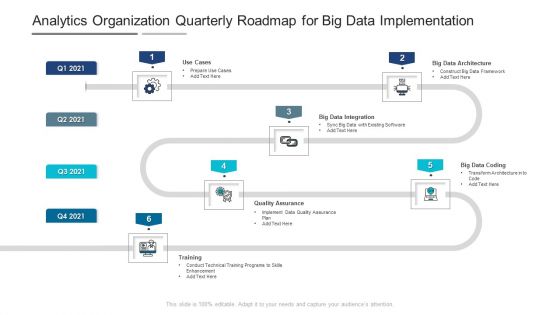
Analytics Organization Quarterly Roadmap For Big Data Implementation Portrait
Introducing our analytics organization quarterly roadmap for big data implementation portrait. This PPT presentation is Google Slides compatible, therefore, you can share it easily with the collaborators for measuring the progress. Also, the presentation is available in both standard screen and widescreen aspect ratios. So edit the template design by modifying the font size, font type, color, and shapes as per your requirements. As this PPT design is fully editable it can be presented in PDF, JPG and PNG formats.
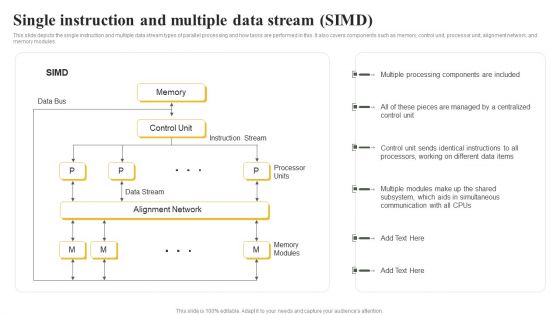
Parallel Computing System To Enhance Process Efficiency Single Instruction And Multiple Data Stream SIMD Inspiration PDF
This slide depicts the single instruction and multiple data stream types of parallel processing and how tasks are performed in this. It also covers components such as memory, control unit, processor unit, alignment network, and memory modules.This Parallel Computing System To Enhance Process Efficiency Single Instruction And Multiple Data Stream SIMD Inspiration PDF is perfect for any presentation, be it in front of clients or colleagues. It is a versatile and stylish solution for organizing your meetings. The Parallel Computing System To Enhance Process Efficiency Single Instruction And Multiple Data Stream SIMD Inspiration PDF features a modern design for your presentation meetings. The adjustable and customizable slides provide unlimited possibilities for acing up your presentation. Slidegeeks has done all the homework before launching the product for you. So, do not wait, grab the presentation templates today.
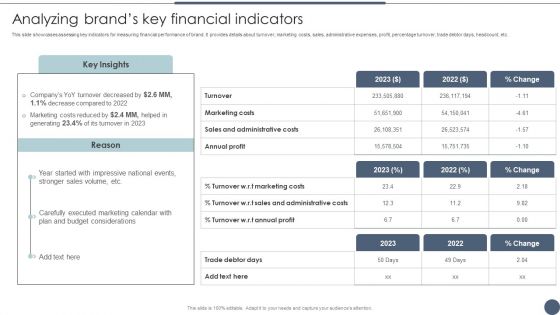
Analyzing Brands Key Financial Indicators Utilizing Emotional And Rational Branding For Improved Consumer Outreach Template PDF
This slide showcases assessing key indicators for measuring financial performance of brand. It provides details about turnover, marketing costs, sales, administrative expenses, profit, percentage turnover, trade debtor days, headcount, etc. Slidegeeks is one of the best resources for PowerPoint templates. You can download easily and regulate Analyzing Brands Key Financial Indicators Utilizing Emotional And Rational Branding For Improved Consumer Outreach Template PDF for your personal presentations from our wonderful collection. A few clicks is all it takes to discover and get the most relevant and appropriate templates. Use our Templates to add a unique zing and appeal to your presentation and meetings. All the slides are easy to edit and you can use them even for advertisement purposes.

Analyzing And Understanding The Performance Of Current Sales Cycle Download PDF
Purpose of the following slide is to show the key performance indicators of the current sales process, the provided displays KPIs such as customer acquired, CAC, volume per customer etc.Deliver an awe inspiring pitch with this creative Analyzing And Understanding The Performance Of Current Sales Cycle Download PDF bundle. Topics like Profit Generated, Target Achieved, Performance By Region can be discussed with this completely editable template. It is available for immediate download depending on the needs and requirements of the user.
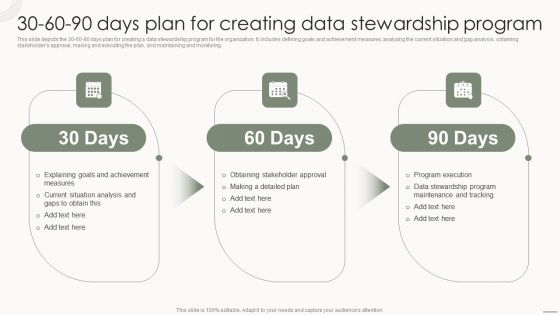
Data Governance IT 30 60 90 Days Plan For Creating Data Stewardship Program Rules PDF
This slide depicts the 30 60 90 days plan for creating a data stewardship program for the organization. It includes defining goals and achievement measures, analyzing the current situation and gap analysis, obtaining stakeholders approval, making and executing the plan, and maintaining and monitoring. Find a pre designed and impeccable Data Governance IT 30 60 90 Days Plan For Creating Data Stewardship Program Rules PDF. The templates can ace your presentation without additional effort. You can download these easy to edit presentation templates to make your presentation stand out from others. So, what are you waiting for Download the template from Slidegeeks today and give a unique touch to your presentation.

Essential Components To Improve Team Productivity Ppt Infographics Graphics Example PDF
Presenting essential components to improve team productivity ppt infographics graphics example pdf to dispense important information. This template comprises six stages. It also presents valuable insights into the topics including goals to improve performance, skills of high performing teams, members accountability. This is a completely customizable PowerPoint theme that can be put to use immediately. So, download it and address the topic impactfully.

Process Holding Of Six Sigma Activities Ppt PowerPoint Presentation File Samples PDF
This slide exhibits process owner of six sigma activities and reports. It includes major activities such as- analyze KPIs, review data conduct root cause analysis and identify customers Persuade your audience using this process holding of six sigma activities ppt powerpoint presentation file samples pdf. This PPT design covers seven stages, thus making it a great tool to use. It also caters to a variety of topics including process owners, benefits of six sigma activities, analyze, business process. Download this PPT design now to present a convincing pitch that not only emphasizes the topic but also showcases your presentation skills.

Overview And Benefits Of Performance Driven Paid Internet Marketing Strategy Inspiration Pdf
This slide showcases performance driven influencer marketing overview and key statistics that can help to evaluate the effectiveness of this format. It also include benefits that are - measurable campaigns and cost effectiveness. The Overview And Benefits Of Performance Driven Paid Internet Marketing Strategy Inspiration Pdf is a compilation of the most recent design trends as a series of slides. It is suitable for any subject or industry presentation, containing attractive visuals and photo spots for businesses to clearly express their messages. This template contains a variety of slides for the user to input data, such as structures to contrast two elements, bullet points, and slides for written information. Slidegeeks is prepared to create an impression.

Elevator Pitch Deck To Raise Funds Key Financial Projections For Upcoming Years Pictures PDF
This slide illustrates key performance indicators highlighting the financial projections for upcoming years. KPIs covered here are revenue breakdown, profitability and cash flow. Deliver an awe inspiring pitch with this creative elevator pitch deck to raise funds key financial projections for upcoming years pictures pdf bundle. Topics like key financial projections for upcoming years can be discussed with this completely editable template. It is available for immediate download depending on the needs and requirements of the user.

Capital Fundraising And Financial Forecast Pitch Deck Key Financial Projections For Upcoming Years Portrait PDF
This slide illustrates key performance indicators highlighting the financial projections for upcoming years. KPIs covered here are revenue breakdown, profitability and cash flow. Deliver an awe inspiring pitch with this creative capital fundraising and financial forecast pitch deck key financial projections for upcoming years portrait pdf bundle. Topics like key financial projections for upcoming years can be discussed with this completely editable template. It is available for immediate download depending on the needs and requirements of the user.
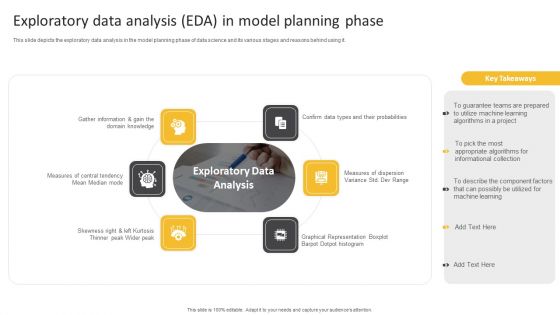
Information Science Exploratory Data Analysis EDA In Model Planning Phase Ppt PowerPoint Presentation Infographics Graphics Pictures PDF
This slide depicts the exploratory data analysis in the model planning phase of data science and its various stages and reasons behind using it.This is a Information Science Exploratory Data Analysis EDA In Model Planning Phase Ppt PowerPoint Presentation Infographics Graphics Pictures PDF template with various stages. Focus and dispense information on six stages using this creative set, that comes with editable features. It contains large content boxes to add your information on topics like Measures Dispersion, Graphical Representation, Skewness Right. You can also showcase facts, figures, and other relevant content using this PPT layout. Grab it now.

Accounting Pitch Deck Key Financial Projections For Upcoming Years Designs PDF
This slide illustrates key performance indicators highlighting the financial projections for upcoming years. KPIs covered here are revenue breakdown, profitability and cash flow.Deliver an awe inspiring pitch with this creative accounting pitch deck key financial projections for upcoming years designs pdf bundle. Topics like revenue breakdown, profitability, cumulative cash flow can be discussed with this completely editable template. It is available for immediate download depending on the needs and requirements of the user.
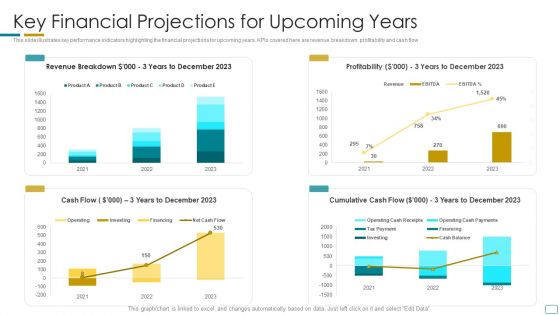
Fundraising Pitch Deck For Startup Company Key Financial Projections For Upcoming Years Brochure PDF
This slide illustrates key performance indicators highlighting the financial projections for upcoming years. KPIs covered here are revenue breakdown, profitability and cash flow Deliver an awe inspiring pitch with this creative fundraising pitch deck for startup company key financial projections for upcoming years brochure pdf bundle. Topics like profitability, revenue can be discussed with this completely editable template. It is available for immediate download depending on the needs and requirements of the user.

 Home
Home