Metrics Dashboard
Key Evaluation Metrics Ppt PowerPoint Presentation Portfolio
This is a key evaluation metrics ppt powerpoint presentation portfolio. This is a five stage process. The stages in this process are business, strategy, marketing, analysis, success, icons.

Key Metrics Ppt PowerPoint Presentation Introduction
This is a key metrics ppt powerpoint presentation introduction. This is a five stage process. The stages in this process are icons, marketing, business, strategy.
Key Evaluation Metrics Ppt PowerPoint Presentation Gallery
This is a key evaluation metrics ppt powerpoint presentation gallery. This is a five stage process. The stages in this process are business, icons, marketing, strategy, success.
Key Evaluation Metrics Ppt PowerPoint Presentation Deck
This is a key evaluation metrics ppt powerpoint presentation deck. This is a five stage process. The stages in this process are business, strategy, marketing, analysis, finance, compare.
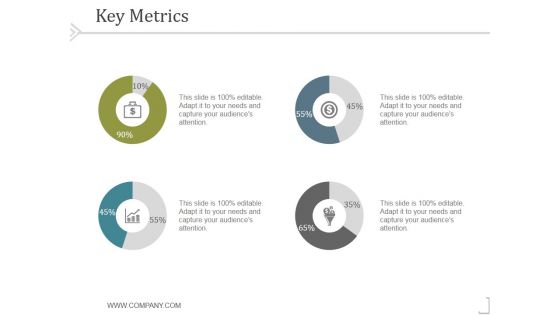
Key Metrics Ppt PowerPoint Presentation Rules
This is a key metrics ppt powerpoint presentation rules. This is a four stage process. The stages in this process are business, strategy, marketing, success, analysis, finance.

Key Evaluation Metrics Ppt PowerPoint Presentation Visuals
This is a key evaluation metrics ppt powerpoint presentation visuals. This is a five stage process. The stages in this process are layered, business, strategy, management, marketing.
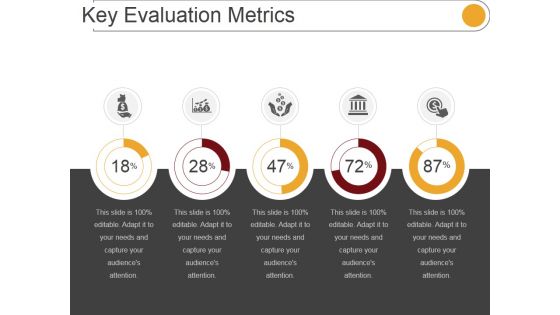
Key Evaluation Metrics Ppt PowerPoint Presentation Influencers
This is a key evaluation metrics ppt powerpoint presentation influencers. This is a five stage process. The stages in this process are icons, percentage, marketing, management.
Digital Sales Metrics Showing Enhancement Icons PDF
The following slide represents statistics of online sales key performance indicators KPIs which can assist marketing manager to review their performance and take necessary steps. It include different metrics such as add to cart rate, conversion rate, and revenue per session. Showcasing this set of slides titled Digital Sales Metrics Showing Enhancement Icons PDF. The topics addressed in these templates are Quarterly Online Sales Metrics, Targeted Right Customers, Offered Product Recommendations. All the content presented in this PPT design is completely editable. Download it and make adjustments in color, background, font etc. as per your unique business setting.
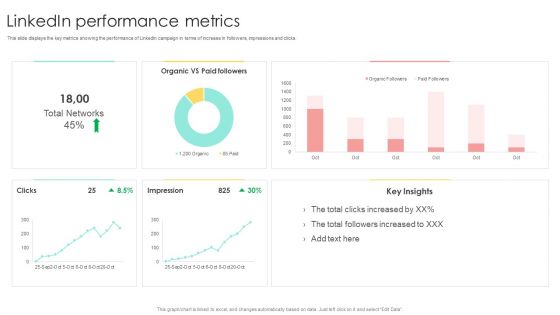
Media Advertising Linkedin Performance Metrics Mockup PDF
This slide displays the key metrics showing the performance of LinkedIn campaign in terms of increase in followers, impressions and clicks. Crafting an eye-catching presentation has never been more straightforward. Let your presentation shine with this tasteful yet straightforward Media Advertising Linkedin Performance Metrics Mockup PDF template. It offers a minimalistic and classy look that is great for making a statement. The colors have been employed intelligently to add a bit of playfulness while still remaining professional. Construct the ideal Media Advertising Linkedin Performance Metrics Mockup PDF that effortlessly grabs the attention of your audience Begin now and be certain to wow your customers
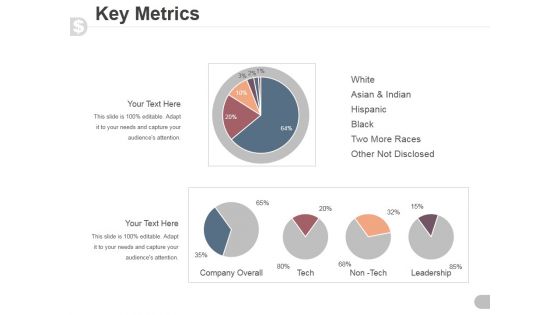
Key Metrics Ppt PowerPoint Presentation Visual Aids
This is a key metrics ppt powerpoint presentation visual aids. This is a five stage process. The stages in this process are white, asian and indian, hispanic, black, two more races, other not disclosed.
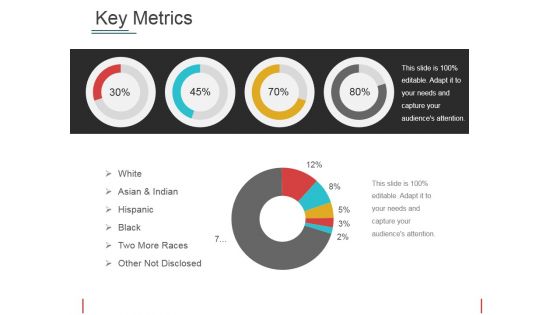
Key Metrics Ppt PowerPoint Presentation Model Professional
This is a key metrics ppt powerpoint presentation model professional. This is a four stage process. The stages in this process are white, asian and indian, hispanic, black, two more races, other not disclosed.
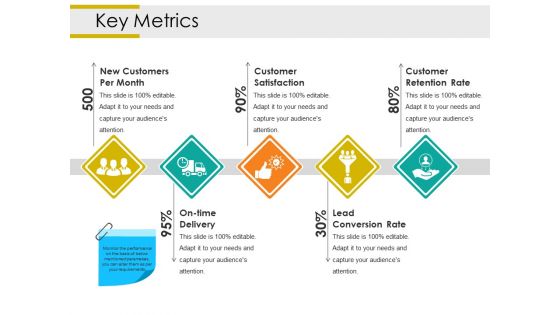
Key Metrics Ppt PowerPoint Presentation Layouts Good
This is a key metrics ppt powerpoint presentation layouts good. This is a five stage process. The stages in this process are new customers per month, customer satisfaction, customer retention rate, lead conversion rate, on time delivery.
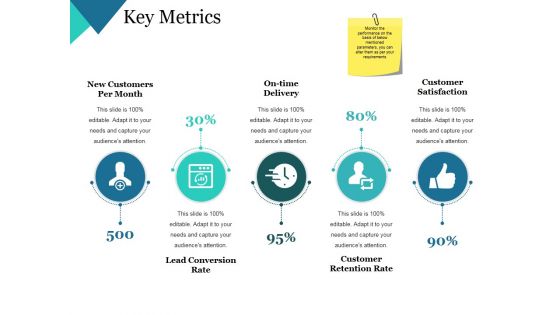
Key Metrics Ppt PowerPoint Presentation Themes
This is a key metrics ppt powerpoint presentation themes. This is a five stage process. The stages in this process are new customers per month, on time delivery, customer satisfaction, customer retention rate, lead conversion rate.
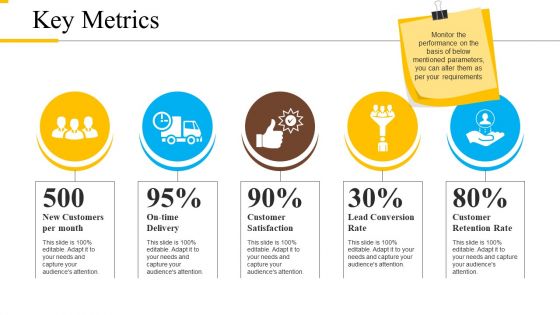
Key Metrics Ppt PowerPoint Presentation Professional Slideshow
This is a key metrics ppt powerpoint presentation professional slideshow. This is a five stage process. The stages in this process are new customers per month, on time delivery, customer satisfaction, lead conversion rate, customer retention rate.
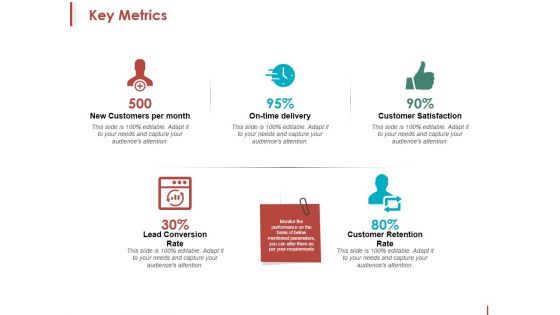
Key Metrics Ppt PowerPoint Presentation Inspiration Format
This is a key metrics ppt powerpoint presentation inspiration format. This is a five stage process. The stages in this process are new customers per month, on time delivery, customer satisfaction, customer retention rate.

Kpis And Operations Metrics Presentation Powerpoint Example
This is a kpis and operations metrics presentation powerpoint example. This is a five stage process. The stages in this process are customer class, affiliate, sales by warehouse, warehouse, profit by affiliate.
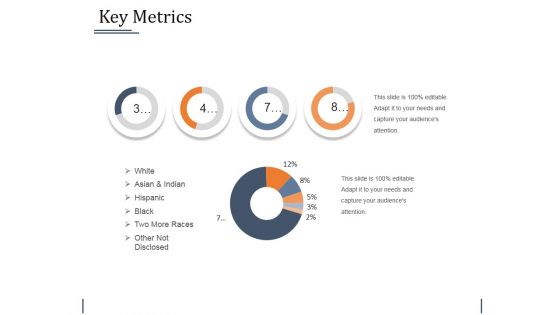
Key Metrics Ppt PowerPoint Presentation Outline Templates
This is a key metrics ppt powerpoint presentation outline templates. This is a four stage process. The stages in this process are white, asian and indian, hispanic, black, two more races, other not disclosed.
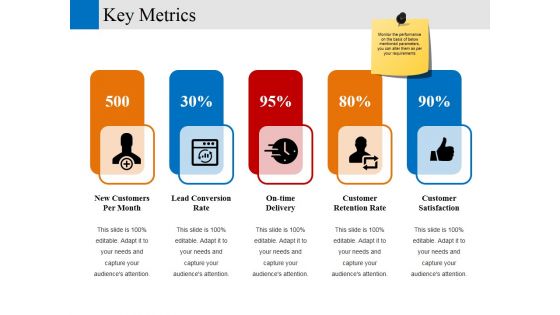
Key Metrics Ppt PowerPoint Presentation Layouts Ideas
This is a key metrics ppt powerpoint presentation layouts ideas. This is a five stage process. The stages in this process are new customers per month, lead conversion rate, on time delivery, customer retention rate, customer satisfaction.
New Commodity Development Assessment Metrics Icons PDF
The following slide highlights the key metrics to evaluate product performance. It includes elements such as product wise revenue, time to the market etc.Pitch your topic with ease and precision using this New Commodity Development Assessment Metrics Icons PDF. This layout presents information on Annual Product, Wise Revenue, Shown Continuous. It is also available for immediate download and adjustment. So, changes can be made in the color, design, graphics or any other component to create a unique layout.

Business Operations Metrics Template Ppt Background Images
This is a business operations metrics template ppt background images. This is a three stage process. The stages in this process are performance data, trend summary data, detailed data.
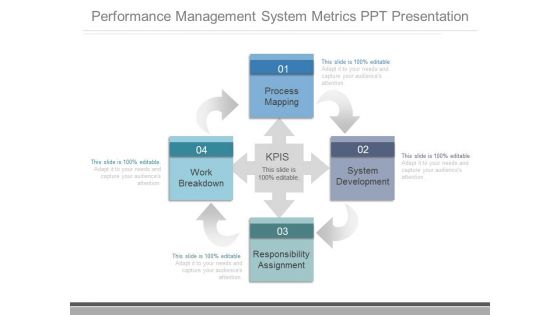
Performance Management System Metrics Ppt Presentation
This is a performance management system metrics ppt presentation. This is a four stage process. The stages in this process are process mapping, work breakdown, responsibility assignment, system development, kpis.

Insurance Sales Procedure Evaluation Metrics Graphics PDF
The following slide highlights evaluation metrics for insurance sales cycle to recognize areas of operational success and failure. It includes KPIs such as quote rate, quota rate, contract rate, number of referrals, percentage pending and sales growth rate. Presenting Insurance Sales Procedure Evaluation Metrics Graphics PDF to dispense important information. This template comprises six stages. It also presents valuable insights into the topics including Contract Rate, Percentage Pending, Sales Growth Rate . This is a completely customizable PowerPoint theme that can be put to use immediately. So, download it and address the topic impactfully.
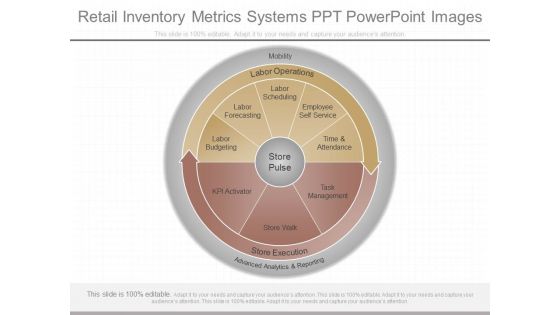
Retail Inventory Metrics Systems Ppt Powerpoint Images
This is a retail inventory metrics systems ppt powerpoint images. This is a one stage process. The stages in this process are mobility, labor operations, store pulse, labor budgeting, labor forecasting, labor scheduling, employee self service, time and attendance, kpi activator, store walk, task management, store execution, advanced analytics and reporting.
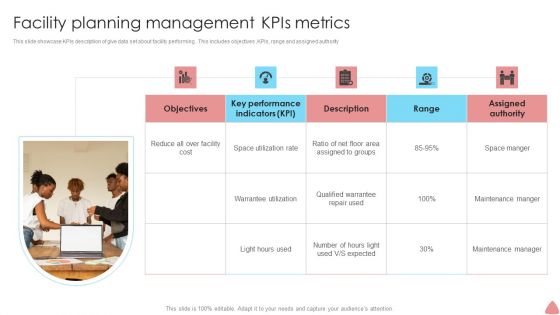
Facility Planning Management Kpis Metrics Portrait PDF
This slide showcase KPIs description of give data set about facility performing . This includes objectives ,KPIs, range and assigned authority. Persuade your audience using this Facility Planning Management Kpis Metrics Portrait PDF. This PPT design covers five stages, thus making it a great tool to use. It also caters to a variety of topics including Key Performance Indicators, Assigned Authority, Space Utilization Rate. Download this PPT design now to present a convincing pitch that not only emphasizes the topic but also showcases your presentation skills.

Key Web Software Performance Metrics Background PDF
Persuade your audience using this Key Web Software Performance Metrics Background PDF. This PPT design covers Seven stages, thus making it a great tool to use. It also caters to a variety of topics including User Satisfaction, Peak Response Time, Time To Interactive. Download this PPT design now to present a convincing pitch that not only emphasizes the topic but also showcases your presentation skills.
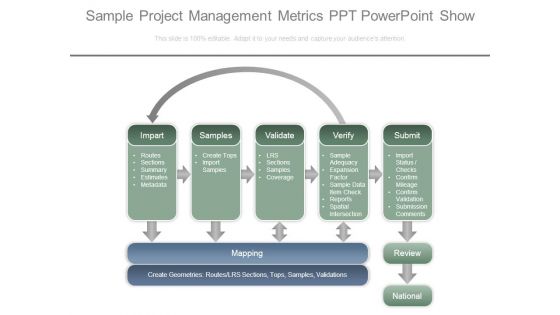
Sample Project Management Metrics Ppt Powerpoint Show
This is a sample project management metrics ppt powerpoint show. This is a seven stage process. The stages in this process are impart, routes, sections, summary, estimates, metadata, samples, create tops, import samples, validate, lrs, sections, samples, coverage, verify, sample, adequacy, expansion factor, sample data item check, reports, spatial intersection, impart, routes, sections, summary, estimates, metadata, samples, create tops, import samples, validate, lrs, sections, samples, coverage, verify, sample, adequacy, expansion factor, sample data item check, reports, spatial intersection.

Metrics Scorecard For HR Manager Download PDF
This slide showcases KPI scorecard that can help to do the performance assessment of human resource manager. Its key result areas are recruitment, training and development, performance and career management and employee retention plus productivity. Showcasing this set of slides titled Metrics Scorecard For HR Manager Download PDF. The topics addressed in these templates are Key Results Areas, Recruitment, Training Development. All the content presented in this PPT design is completely editable. Download it and make adjustments in color, background, font etc. as per your unique business setting.

Human Resource Metrics Improvement Strategies Themes PDF
This slide outlines strategies that can help organization to improve the human resource key KPIs that are absenteeism rate, cost per hire, employee turnover rate and training cost. It also showcases result before and after the implementation of improvement tactics. Showcasing this set of slides titled Human Resource Metrics Improvement Strategies Themes PDF. The topics addressed in these templates are Absenteeism Rate, Employee Turnover Rate, Cost Per Hire. All the content presented in this PPT design is completely editable. Download it and make adjustments in color, background, font etc. as per your unique business setting.

Human Resource Recruitment Source Metrics Portrait PDF
This slide recruitment sources that can help to compare the human resource KPIs from different platforms and evaluate the reason behind it. Its key elements are qualified candidates per opening, average time to hire, average cost per hire and offer acceptance rate. Pitch your topic with ease and precision using this Human Resource Recruitment Source Metrics Portrait PDF. This layout presents information on Application Completion, Lowest Cost Per, Advertisement Cost. It is also available for immediate download and adjustment. So, changes can be made in the color, design, graphics or any other component to create a unique layout.

Maintenance Metrics To Optimize Production Information PDF
The following slide highlights some maintenance KPIs for manufacturing industry to trace and reduce production downtime. It also includes top downtime reasons along with the present downtime with machine name, reason and duration. Showcasing this set of slides titled Maintenance Metrics To Optimize Production Information PDF. The topics addressed in these templates are Human Error, Misplaced Parts, Machine Breakdown. All the content presented in this PPT design is completely editable. Download it and make adjustments in color, background, font etc. as per your unique business setting.
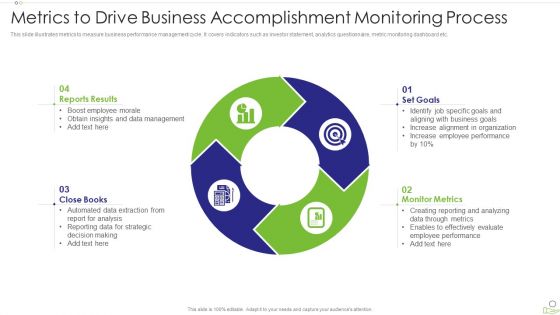
Metrics To Drive Business Accomplishment Monitoring Process Infographics PDF
This slide illustrates metrics to measure business performance management cycle. It covers indicators such as investor statement, analytics questionnaire, metric monitoring dashboard etc. Presenting metrics to drive business accomplishment monitoring process infographics pdf to dispense important information. This template comprises four stages. It also presents valuable insights into the topics including monitor metrics, set goals, close books. This is a completely customizable PowerPoint theme that can be put to use immediately. So, download it and address the topic impactfully.
Business Analytics Application Employee Engagement Key Performance Metrics Icons PDF
This slide represents key metrics dashboard to analyze the engagement of employees in the organization. It includes details related to KPIs such as engagement score, response rate, net promoter score etc. Formulating a presentation can take up a lot of effort and time, so the content and message should always be the primary focus. The visuals of the PowerPoint can enhance the presenters message, so our Business Analytics Application Employee Engagement Key Performance Metrics Icons PDF was created to help save time. Instead of worrying about the design, the presenter can concentrate on the message while our designers work on creating the ideal templates for whatever situation is needed. Slidegeeks has experts for everything from amazing designs to valuable content, we have put everything into Business Analytics Application Employee Engagement Key Performance Metrics Icons PDF.

Human Resource Analytics Employee Engagement Key Performance Metrics Inspiration PDF
This slide represents key metrics dashboard to analyze the engagement of employees in the organization. It includes details related to KPIs such as engagement score, response rate, net promoter score etc. Crafting an eye-catching presentation has never been more straightforward. Let your presentation shine with this tasteful yet straightforward Human Resource Analytics Employee Engagement Key Performance Metrics Inspiration PDF template. It offers a minimalistic and classy look that is great for making a statement. The colors have been employed intelligently to add a bit of playfulness while still remaining professional. Construct the ideal Human Resource Analytics Employee Engagement Key Performance Metrics Inspiration PDF that effortlessly grabs the attention of your audience Begin now and be certain to wow your customers.
Data Assimilation Your Title Here Metrics Ppt Icon Skills PDF
This is a data assimilation your title here metrics ppt icon skills pdf template with various stages. Focus and dispense information on two stages using this creative set, that comes with editable features. It contains large content boxes to add your information on topics like kpi metrics, kpi dashboards. You can also showcase facts, figures, and other relevant content using this PPT layout. Grab it now.

Table Of Content Enhancing Hospital Software System Metrics Pictures PDF
Deliver an awe inspiring pitch with this creative table of content enhancing hospital software system metrics pictures pdf bundle. Topics like risk management framework, management system, dashboards and metrics can be discussed with this completely editable template. It is available for immediate download depending on the needs and requirements of the user.

Effectivity Associated To Target Market Marketing Management Kpi Metrics Metrics Ppt Inspiration Rules PDF
Deliver an awe inspiring pitch with this creative effectivity associated to target market marketing management kpi metrics metrics ppt inspiration rules pdf bundle. Topics like communication, marketing, trend indication, calculation, metrics can be discussed with this completely editable template. It is available for immediate download depending on the needs and requirements of the user.

Types And Metrics Of Performance Metrics Ppt PowerPoint Presentation File Infographics PDF
Slidegeeks has constructed Types And Metrics Of Performance Metrics Ppt PowerPoint Presentation File Infographics PDF after conducting extensive research and examination. These presentation templates are constantly being generated and modified based on user preferences and critiques from editors. Here, you will find the most attractive templates for a range of purposes while taking into account ratings and remarks from users regarding the content. This is an excellent jumping off point to explore our content and will give new users an insight into our top notch PowerPoint Templates.

Hospital Operations Metrics To Monitor Performance Structure PDF
This slide represents a dashboard showcasing operations metrics to monitor medical institute performance. It includes the total number of patients, operational cost, available staff, etc. Showcasing this set of slides titled Hospital Operations Metrics To Monitor Performance Structure PDF. The topics addressed in these templates are Divisions, Overall Patient Satisfaction, Total Operational Cost. All the content presented in this PPT design is completely editable. Download it and make adjustments in color, background, font etc. as per your unique business setting.
Satisfaction Rate Icon For Customer Service Metrics Summary PDF
Persuade your audience using this Satisfaction Rate Icon For Customer Service Metrics Summary PDF. This PPT design covers four stages, thus making it a great tool to use. It also caters to a variety of topics including Satisfaction Rate Icon, Customer Service Metrics. Download this PPT design now to present a convincing pitch that not only emphasizes the topic but also showcases your presentation skills.
Our Key Metrics Ppt PowerPoint Presentation Icon Slide
This is a our key metrics ppt powerpoint presentation icon slide. This is a five stage process. The stages in this process are cash flow, turnover, productivity, net income, customer satisfaction .
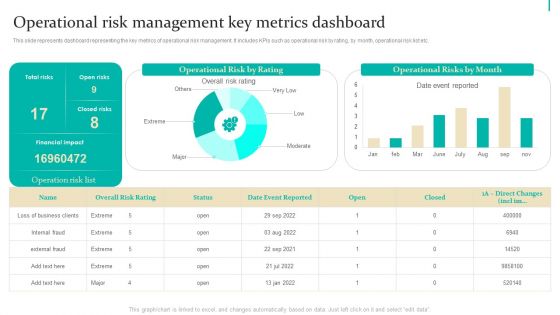
Enterprise Risk Management Operational Risk Management Key Metrics Inspiration PDF
This slide represents dashboard representing the key metrics of operational risk management. It includes KPIs such as operational risk by rating, by month, operational risk list etc. Boost your pitch with our creative Enterprise Risk Management Operational Risk Management Key Metrics Inspiration PDF. Deliver an awe-inspiring pitch that will mesmerize everyone. Using these presentation templates you will surely catch everyones attention. You can browse the ppts collection on our website. We have researchers who are experts at creating the right content for the templates. So you dont have to invest time in any additional work. Just grab the template now and use them.
Education Metrics Tracker For Students Performance Evaluation Professional PDF
This slide covers student performance analysis dashboard. It include metrics student count, student attendance, average subject score, branch examination results, student count by grade, etc. Showcasing this set of slides titled Education Metrics Tracker For Students Performance Evaluation Professional PDF. The topics addressed in these templates are Students Count, Grade And Gender, Students Details, Examination Results Branch. All the content presented in this PPT design is completely editable. Download it and make adjustments in color, background, font etc. as per your unique business setting.
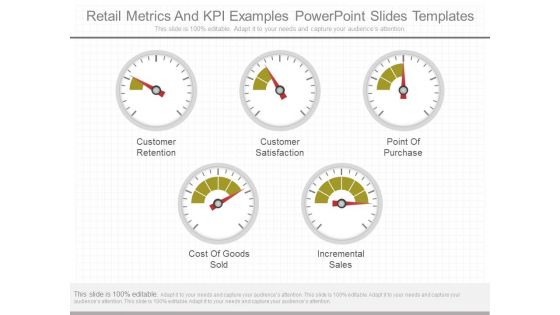
Retail Metrics And Kpi Examples Powerpoint Slides Templates
This is a retail metrics and kpi examples powerpoint slides templates. This is a five stage process. The stages in this process are customer retention, customer satisfaction, point of purchase, cost of goods sold, incremental sales.

Redis Cache Data Structure IT Performance Memory And Activity Metrics Introduction PDF
This slide depicts performance memory and activity metrics dashboard for Redis cache, including cache hit ratio, slow log, latency, used memory, etc. This is a redis cache data structure it performance memory and activity metrics introduction pdf template with various stages. Focus and dispense information on one stages using this creative set, that comes with editable features. It contains large content boxes to add your information on topics like performance memory and activity metrics dashboard for redis cache. You can also showcase facts, figures, and other relevant content using this PPT layout. Grab it now.

Our Key Metrics For Money Flow Ppt Slide
This is a our key metrics for money flow ppt slide. This is a five stage process. The stages in this process are cash flow, productivity, customer satisfaction, turnover, net income.
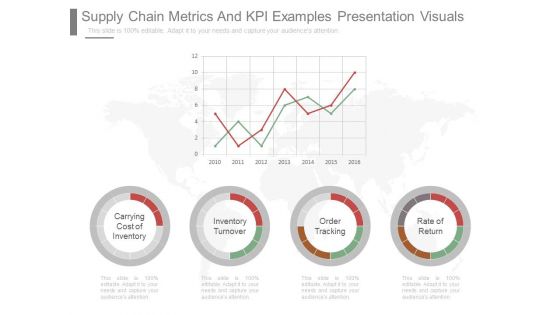
Supply Chain Metrics And Kpi Examples Presentation Visuals
This is a supply chain metrics and kpi examples presentation visuals. This is a four stage process. The stages in this process are carrying cost of inventory, inventory turnover, order tracking, rate of return.

Financial Metrics And Kpi Template Presentation Visual Aids
This is a financial metrics and kpi template presentation visual aids. This is a three stage process. The stages in this process are operating profit last 12 months, total income act vs forecast between 2009 and 2010, income by qtr by tr between 2007 and 2010.
KPI Metrics Vector Icon Ppt PowerPoint Presentation Layouts Slide
This is a kpi metrics vector icon ppt powerpoint presentation layouts slide. This is a three stage process. The stages in this process are kpi proposal, kpi plan, kpi scheme.
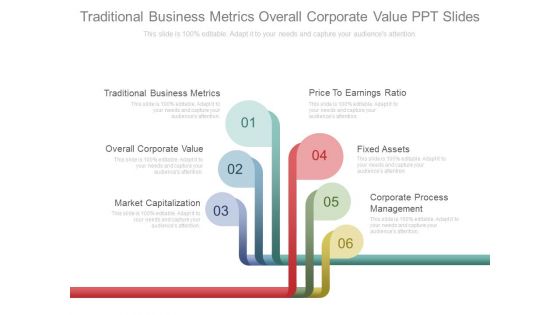
Traditional Business Metrics Overall Corporate Value Ppt Slides
This is a traditional business metrics overall corporate value ppt slides. This is a six stage process. The stages in this process are success, business, marketing.
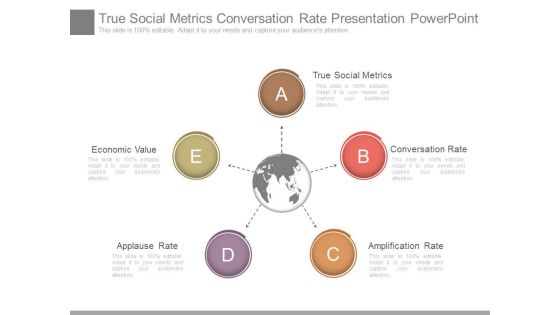
True Social Metrics Conversation Rate Presentation PowerPoint Slides
This is a true social metrics conversation rate presentation powerpoint slide. This is a five stage process. The stages in this process are technology, globe, marketing, business.
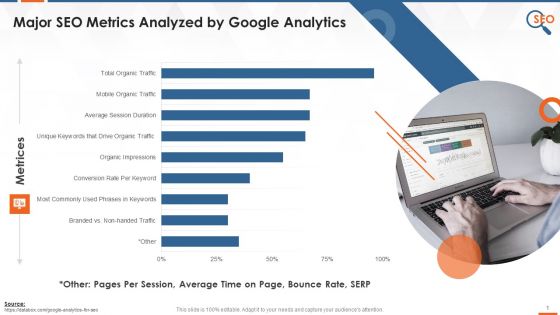
SEO Metrics That Google Analytics Analyses Training Ppt
This slide graphically presents the major SEO metrics analyzed by Google Analytics tools such as total organic traffic, average session duration, conversion rate per keyword, branded vs. non-branded traffic, etc.
Business Diagram Metrics For Performance Measurement Presentation Template
This diagram slide has been designed with graphic of matrix. You may use this matrix for performance management. Download this diagram to make interactive presentations.

Google Search Console Performance Report Metrics Training Ppt
This slide Covers a description of webmaster performance report metrics. It depicts The total number of times users clicked on a website, the number of times the site appeared in the search result, the average click-through rate, and an average ranking of the website URLs in the Google search engine.
Change Requests Tracking Metrics For Company Microsoft PDF
This slide displays dashboard to monitor change requests count assigned and completed for the organization. It includes key components such as models, owners, over time progress, etc Showcasing this set of slides titled Change Requests Tracking Metrics For Company Microsoft PDF The topics addressed in these templates are Departments, Model Owners, Requests. All the content presented in this PPT design is completely editable. Download it and make adjustments in color, background, font etc. as per your unique business setting.

Change Management Metrics With New And Urgent Requests Summary PDF
This slide displays KPI dashboard for real time tracking of change requests status in the company. It includes details about priority categories, trend, distribution, etc. Showcasing this set of slides titled Change Management Metrics With New And Urgent Requests Summary PDF The topics addressed in these templates are Urgent Requests, Priority, Changes. All the content presented in this PPT design is completely editable. Download it and make adjustments in color, background, font etc. as per your unique business setting.
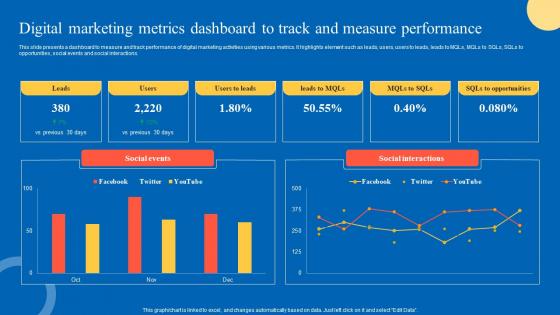
Digital Marketing Metrics Strategic Guide For Marketing Program Pictures Pdf
This slide presents a dashboard to measure and track performance of digital marketing activities using various metrics. It highlights element such as leads, users, users to leads, leads to MQLs, MQLs to SQLs, SQLs to opportunities, social events and social interactions. Whether you have daily or monthly meetings, a brilliant presentation is necessary. Digital Marketing Metrics Strategic Guide For Marketing Program Pictures Pdf can be your best option for delivering a presentation. Represent everything in detail using Digital Marketing Metrics Strategic Guide For Marketing Program Pictures Pdf and make yourself stand out in meetings. The template is versatile and follows a structure that will cater to your requirements. All the templates prepared by Slidegeeks are easy to download and edit. Our research experts have taken care of the corporate themes as well. So, give it a try and see the results.

Organizations Performance Management Pyramid With Key Metrics Ppt Example SS
The following slide showcases business sustainability dashboard highlighting multiple sources of technology. It provides information about renewable energy, plant age, solar, wind, biomass, regionality, etc. Here you can discover an assortment of the finest PowerPoint and Google Slides templates. With these templates, you can create presentations for a variety of purposes while simultaneously providing your audience with an eye-catching visual experience. Download Organizations Performance Management Pyramid With Key Metrics Ppt Example SS to deliver an impeccable presentation. These templates will make your job of preparing presentations much quicker, yet still, maintain a high level of quality. Slidegeeks has experienced researchers who prepare these templates and write high-quality content for you. Later on, you can personalize the content by editing the Organizations Performance Management Pyramid With Key Metrics Ppt Example SS
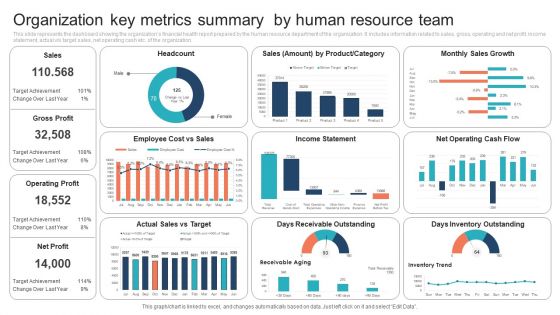
Organization Key Metrics Summary By Human Resource Team Information PDF
This slide represents the dashboard showing the organizations financial health report prepared by the human resource department of the organization. It includes information related to sales, gross, operating and net profit, income statement, actual vs target sales, net operating cash etc. of the organization.Showcasing this set of slides titled Organization Key Metrics Summary By Human Resource Team Information PDF. The topics addressed in these templates are Organization Key Metrics Summary, Human Resource Team. All the content presented in this PPT design is completely editable. Download it and make adjustments in color, background, font etc. as per your unique business setting.

Implementation Steps Determine Metrics Supporting Business Goals Graphics PDF
This slide covers various KPIs that need to be measured to achieve organizational goals. It includes metrics such as salespersons performance report, number of leads converted, leads generated through campaigns, monthly sales report, number of unresolved cases, etc. Deliver an awe inspiring pitch with this creative Implementation Steps Determine Metrics Supporting Business Goals Graphics PDF bundle. Topics like Generate Reports, Salespersons Performance, Report Dashboard can be discussed with this completely editable template. It is available for immediate download depending on the needs and requirements of the user.
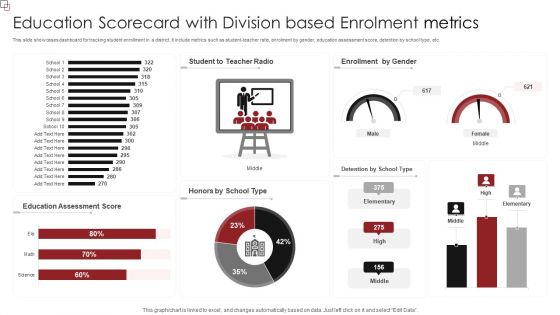
Education Scorecard With Division Based Enrolment Metrics Professional PDF
This slide showcases dashboard for tracking student enrollment in a district. It include metrics such as student-teacher ratio, enrolment by gender, education assessment score, detention by school type, etc. Pitch your topic with ease and precision using this Education Scorecard With Division Based Enrolment Metrics Professional PDF. This layout presents information on Education Assessment Score, Enrollment Gender. It is also available for immediate download and adjustment. So, changes can be made in the color, design, graphics or any other component to create a unique layout.

 Home
Home