Metric Comparison

Project Management Life Cycle Performance Comparison Mockup PDF
This slide depicts comparison of different projects performance and overall progress of project towards milestone set for completion. It include the pointer such as project integrator overview, product overview and average profit of project. Pitch your topic with ease and precision using this Project Management Life Cycle Performance Comparison Mockup PDF. This layout presents information on Project Integrator Overview, Overview Of Product, Cycle Performance Comparison. It is also available for immediate download and adjustment. So, changes can be made in the color, design, graphics or any other component to create a unique layout.

Companys Performance Comparison Before And After Strategy Implementation Professional PDF
This slide shows the comparison of companys performance before and after the product marketing strategy implementation. It shows the comparison based on parameters such as number of product sold, total sale, lead conversion rate, customer retention rate, per customer acquisition cost etc. If you are looking for a format to display your unique thoughts, then the professionally designed Companys Performance Comparison Before And After Strategy Implementation Professional PDF is the one for you. You can use it as a Google Slides template or a PowerPoint template. Incorporate impressive visuals, symbols, images, and other charts. Modify or reorganize the text boxes as you desire. Experiment with shade schemes and font pairings. Alter, share or cooperate with other people on your work. Download Companys Performance Comparison Before And After Strategy Implementation Professional PDF and find out how to give a successful presentation. Present a perfect display to your team and make your presentation unforgettable.

Companys Performance Comparison Before And After Strategy Implementation Slides PDF
This slide shows the comparison of companys performance before and after the product marketing strategy implementation. It shows the comparison based on parameters such as number of product sold, total sale, lead conversion rate, customer retention rate, per customer acquisition cost etc.Create an editable Companys Performance Comparison Before And After Strategy Implementation Slides PDF that communicates your idea and engages your audience. Whether you are presenting a business or an educational presentation, pre-designed presentation templates help save time. Companys Performance Comparison Before And After Strategy Implementation Slides PDF is highly customizable and very easy to edit, covering many different styles from creative to business presentations. Slidegeeks has creative team members who have crafted amazing templates. So, go and get them without any delay.
Sales Performance Comparison Graph Of Top Customer Icons PDF
This slide shows the customer sales comparison graph along with the units of product purchased by the clients. Showcasing this set of slides titled Sales Performance Comparison Graph Of Top Customer Icons PDF. The topics addressed in these templates are Highest Units, Customer, Product. All the content presented in this PPT design is completely editable. Download it and make adjustments in color, background, font etc. as per your unique business setting.
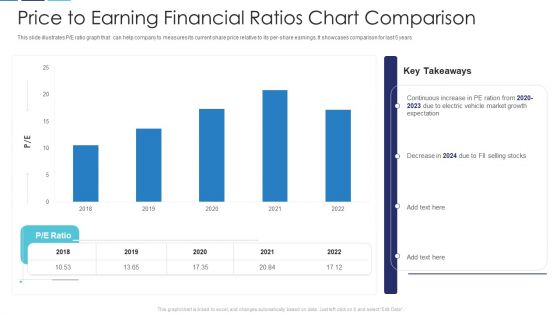
Price To Earning Financial Ratios Chart Comparison Slides PDF
This slide illustrates P or E ratio graph that can help company to measures its current share price relative to its per-share earnings. It showcases comparison for last 5 years Showcasing this set of slides titled price to earning financial ratios chart comparison slides pdf. The topics addressed in these templates are price to earning financial ratios chart comparison. All the content presented in this PPT design is completely editable. Download it and make adjustments in color, background, font etc. as per your unique business setting.

Ppt Comparison Diagram Of 4 Colorful State PowerPoint Templates
PPT comparison diagram of 4 colorful state PowerPoint Templates-This Detailed Flow Diagram displays the activities you may need to execute to achieve successful implementation and in-service management of your services program. You can show various processes with these linear designed Circular pieces. This image has been conceived to enable you to emphatically communicate your ideas in your Comparing 4 quantities PPT presentation.-PPT comparison diagram of 4 colorful state PowerPoint Templates-3d, Abstract, Backgrounds, Ball, Business, Choice, Comparison, Concept, Descriptive, Equilibrium, Grow, Illustrations, Instrument, Measurement, Metallic, Part, Partnership, Pattern, Progress, Reflections, Scales, Several, Sphere, Strategy, Success
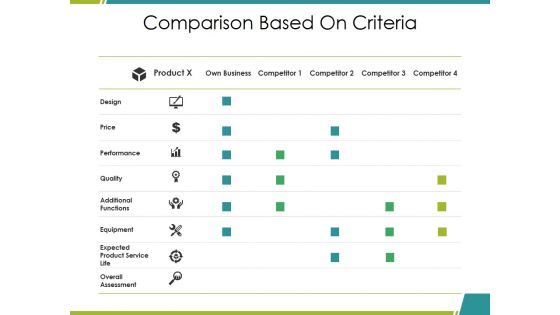
Comparison Based On Criteria Ppt PowerPoint Presentation Infographics Elements
This is a comparison based on criteria ppt powerpoint presentation infographics elements. This is a four stage process. The stages in this process are design, price, performance, product, competitor.
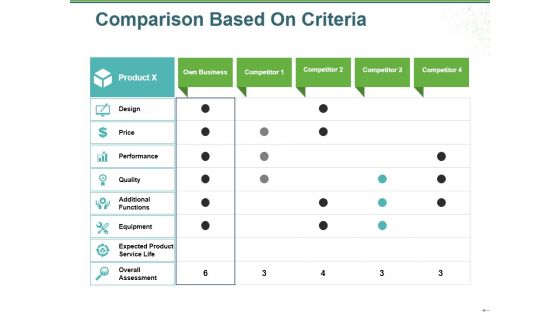
Comparison Based On Criteria Ppt PowerPoint Presentation Summary Good
This is a comparison based on criteria ppt powerpoint presentation summary good. This is a four stage process. The stages in this process are product, design, price, performance, quality.
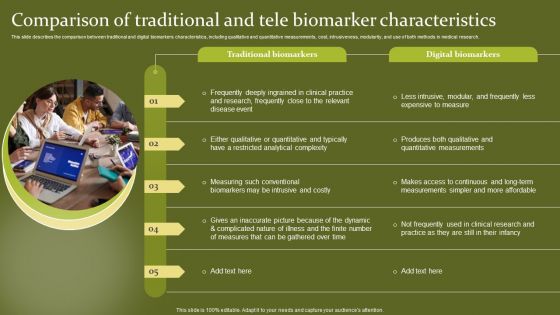
Telehealth Comparison Of Traditional And Tele Biomarker Characteristics Pictures PDF
This slide describes the comparison between traditional and digital biomarkers characteristics, including qualitative and quantitative measurements, cost, intrusiveness, modularity, and use of both methods in medical research. Presenting this PowerPoint presentation, titled Telehealth Comparison Of Traditional And Tele Biomarker Characteristics Pictures PDF, with topics curated by our researchers after extensive research. This editable presentation is available for immediate download and provides attractive features when used. Download now and captivate your audience. Presenting this Telehealth Comparison Of Traditional And Tele Biomarker Characteristics Pictures PDF. Our researchers have carefully researched and created these slides with all aspects taken into consideration. This is a completely customizable Telehealth Comparison Of Traditional And Tele Biomarker Characteristics Pictures PDF that is available for immediate downloading. Download now and make an impact on your audience. Highlight the attractive features available with our PPTs.
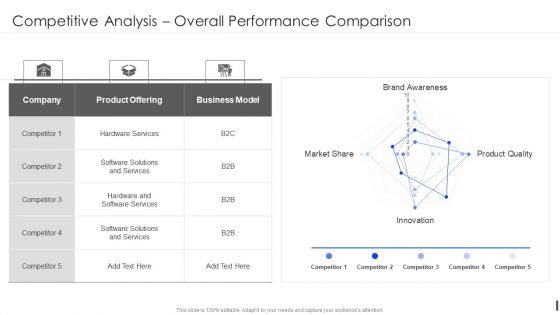
Product Marketing Playbook Competitive Analysis Overall Performance Comparison Background PDF
Deliver and pitch your topic in the best possible manner with this Product Marketing Playbook Competitive Analysis Overall Performance Comparison Background PDF Use them to share invaluable insights on Product Offering, Business Model, Software Solutions and impress your audience. This template can be altered and modified as per your expectations. So, grab it now.
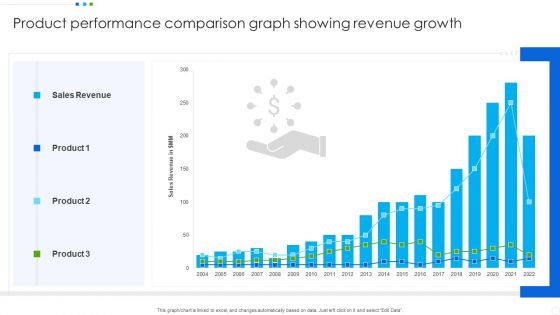
Product Performance Comparison Graph Showing Revenue Growth Portrait PDF
Showcasing this set of slides titled Product Performance Comparison Graph Showing Revenue Growth Portrait PDF. The topics addressed in these templates are Sales Revenue, Product. All the content presented in this PPT design is completely editable. Download it and make adjustments in color, background, font etc. as per your unique business setting.

Marketing Performance Measurement Comparison Ppt Pictures Slides PDF
Presenting this set of slides with name marketing performance measurement comparison ppt pictures slides pdf. The topics discussed in these slides are you tube, whatsapp, face book. This is a completely editable PowerPoint presentation and is available for immediate download. Download now and impress your audience.

Commodity Unique Selling Proposition Product Feature Comparison Mockup PDF
Compare and Contrast your product from the competitors product in this slide. Deliver and pitch your topic in the best possible manner with this commodity unique selling proposition product feature comparison mockup pdf. Use them to share invaluable insights on processor, product, performance and impress your audience. This template can be altered and modified as per your expectations. So, grab it now.
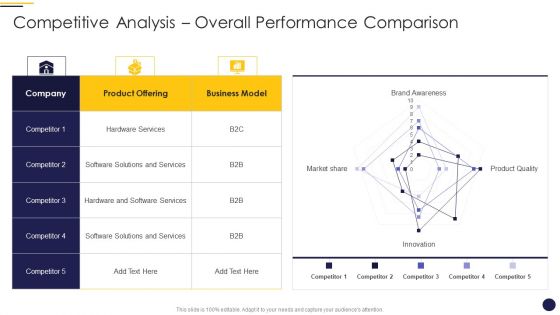
Internet Marketing Playbook Competitive Analysis Overall Performance Comparison Themes PDF
Deliver an awe inspiring pitch with this creative Internet Marketing Playbook Competitive Analysis Overall Performance Comparison Themes PDF bundle. Topics like Product Offering Business, Model Hardware Services, Software Solutions Services can be discussed with this completely editable template. It is available for immediate download depending on the needs and requirements of the user.
Workforce Performance Comparison Report With Feedback Ppt Icon Objects PDF
Pitch your topic with ease and precision using this workforce performance comparison report with feedback ppt icon objects pdf. This layout presents information on finance, sales, research, production. It is also available for immediate download and adjustment. So, changes can be made in the color, design, graphics or any other component to create a unique layout.
IOT Industry Assessment Touchpoint Performance Comparison Ppt Icon Maker PDF
Following slide shows the performance of companys touchpoint compared to its competitor. Performance measurement is based on the feelings about touchpoint vs impact on likelihood of purchase. Presenting iot industry assessment touchpoint performance comparison ppt icon maker pdf to provide visual cues and insights. Share and navigate important information on two stages that need your due attention. This template can be used to pitch topics like touchpoint performance comparison. In addtion, this PPT design contains high resolution images, graphics, etc, that are easily editable and available for immediate download.
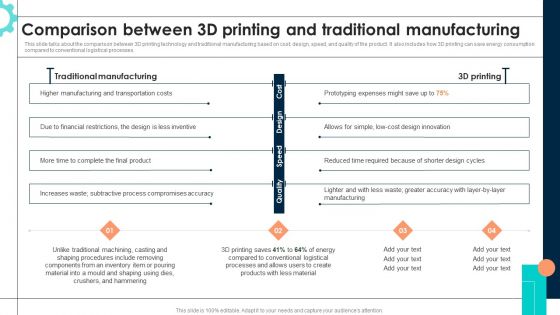
Intelligent Manufacturing Comparison Between 3D Printing And Traditional Introduction PDF
This slide talks about the comparison between 3D printing technology and traditional manufacturing based on cost, design, speed, and quality of the product. It also includes how 3D printing can save energy consumption compared to conventional logistical processes. From laying roadmaps to briefing everything in detail, our templates are perfect for you. You can set the stage with your presentation slides. All you have to do is download these easy to edit and customizable templates. Intelligent Manufacturing Comparison Between 3D Printing And Traditional Introduction PDF will help you deliver an outstanding performance that everyone would remember and praise you for. Do download this presentation today.
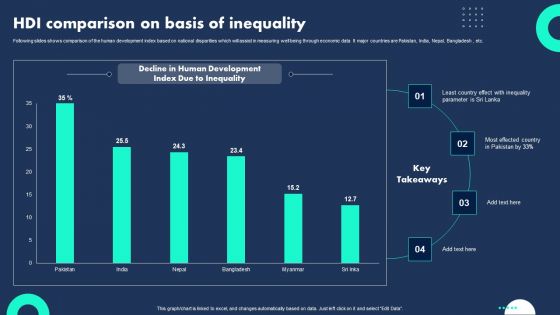
HDI Comparison On Basis Of Inequality Infographics PDF
Following slides shows comparison of the human development index based on national disparities which will assist in measuring well being through economic data It major countries are Pakistan, India, Nepal, Bangladesh , etc. Showcasing this set of slides titled HDI Comparison On Basis Of Inequality Infographics PDF. The topics addressed in these templates are Country Effect, Most Effected Country, Human Development. All the content presented in this PPT design is completely editable. Download it and make adjustments in color, background, font etc. as per your unique business setting.
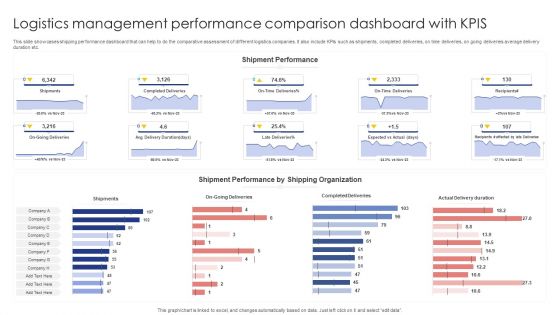
Logistics Management Performance Comparison Dashboard With Kpis Sample PDF
This slide showcases shipping performance dashboard that can help to do the comparative assessment of different logistics companies. It also include KPIs such as shipments, completed deliveries, on time deliveries, on going deliveries average delivery duration etc. Pitch your topic with ease and precision using this Logistics Management Performance Comparison Dashboard With Kpis Sample PDF. This layout presents information on Shipments, Completed Deliveries, Actual Delivery Duration. It is also available for immediate download and adjustment. So, changes can be made in the color, design, graphics or any other component to create a unique layout.

State Wise Customer Sales Performance Comparison Graph Introduction PDF
This slide shows the sales graph of 3 products of a company in various states. It includes five states which are New York, Texas, California, Washington and New Jersey. Showcasing this set of slides titled State Wise Customer Sales Performance Comparison Graph Introduction PDF. The topics addressed in these templates are Lowest Sales, Decrease Demand. All the content presented in this PPT design is completely editable. Download it and make adjustments in color, background, font etc. as per your unique business setting.

CRM Software Dashboard For Sales Comparison Mockup PDF
This slide represents the sales dashboard of CRM software. It includes KPIs such as profit, number of sales and expenses incurred. Pitch your topic with ease and precision using this CRM Software Dashboard For Sales Comparison Mockup PDF. This layout presents information on Profit, Sales Dashboard, Expenses Incurred. It is also available for immediate download and adjustment. So, changes can be made in the color, design, graphics or any other component to create a unique layout.

Program Six Months Comparison Roadmap With Team Review Summary
Presenting our innovatively structured program six months comparison roadmap with team review summary Template. Showcase your roadmap process in different formats like PDF, PNG, and JPG by clicking the download button below. This PPT design is available in both Standard Screen and Widescreen aspect ratios. It can also be easily personalized and presented with modified font size, font type, color, and shapes to measure your progress in a clear way.
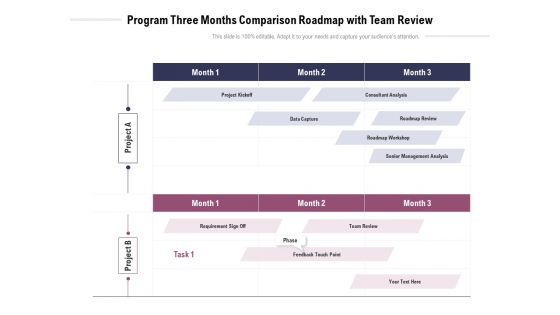
Program Three Months Comparison Roadmap With Team Review Download
Introducing our program three months comparison roadmap with team review download. This PPT presentation is Google Slides compatible, therefore, you can share it easily with the collaborators for measuring the progress. Also, the presentation is available in both standard screen and widescreen aspect ratios. So edit the template design by modifying the font size, font type, color, and shapes as per your requirements. As this PPT design is fully editable it can be presented in PDF, JPG and PNG formats.

Quarterly IT Products Comparison Roadmap Based On Compatibility Mode Download
Presenting our innovatively structured quarterly it products comparison roadmap based on compatibility mode download Template. Showcase your roadmap process in different formats like PDF, PNG, and JPG by clicking the download button below. This PPT design is available in both Standard Screen and Widescreen aspect ratios. It can also be easily personalized and presented with modified font size, font type, color, and shapes to measure your progress in a clear way.

Arrows Stages Comparison Process Flow PowerPoint Templates Backgrounds For Slides
We present our arrows stages comparison process flow PowerPoint templates backgrounds for slides.Use our Flow Charts PowerPoint Templates because You can Inspire your team with our PowerPoint Templates and Slides. Let the force of your ideas flow into their minds. Download our Process and Flows PowerPoint Templates because You are working at that stage with an air of royalty. Let our PowerPoint Templates and Slides be the jewels in your crown. Use our Marketing PowerPoint Templates because You can Zap them with our PowerPoint Templates and Slides. See them reel under the impact. Use our Business PowerPoint Templates because You can Be the puppeteer with our PowerPoint Templates and Slides as your strings. Lead your team through the steps of your script. Present our Shapes PowerPoint Templates because Our PowerPoint Templates and Slides will Activate the energies of your audience. Get their creative juices flowing with your words.Use these PowerPoint slides for presentations relating to Accounting, arrow, bar, blue, business, chart, collection, company, diagram, directive, finance, forecast, future, growth, icon, illustration, market, measure, profit, progress, statistic, stock, success. The prominent colors used in the PowerPoint template are Blue, Gray, White. People tell us our arrows stages comparison process flow PowerPoint templates backgrounds for slides will make you look like a winner. Presenters tell us our company PowerPoint templates and PPT Slides have awesome images to get your point across. Customers tell us our arrows stages comparison process flow PowerPoint templates backgrounds for slides will help them to explain complicated concepts. Customers tell us our bar PowerPoint templates and PPT Slides will save the presenter time. Professionals tell us our arrows stages comparison process flow PowerPoint templates backgrounds for slides will make the presenter look like a pro even if they are not computer savvy. Use our company PowerPoint templates and PPT Slides will save the presenter time.
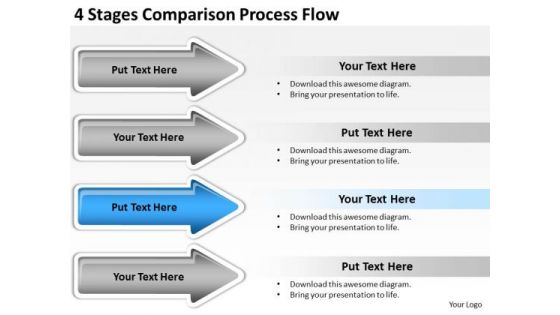
Arrows PowerPoint 4 Stages Comparison Process Flow Slides
We present our arrows powerpoint 4 stages comparison process flow Slides.Use our Business PowerPoint Templates because Our PowerPoint Templates and Slides are created with admirable insight. Use them and give your group a sense of your logical mind. Present our Process and Flows PowerPoint Templates because Our PowerPoint Templates and Slides are created by a hardworking bunch of busybees. Always flitting around with solutions gauranteed to please. Download our Shapes PowerPoint Templates because They will bring a lot to the table. Their alluring flavours will make your audience salivate. Download our Steps PowerPoint Templates because You have a driving passion to excel in your field. Our PowerPoint Templates and Slides will prove ideal vehicles for your ideas. Present our Flow Charts PowerPoint Templates because Our PowerPoint Templates and Slides are effectively colour coded to prioritise your plans They automatically highlight the sequence of events you desire.Use these PowerPoint slides for presentations relating to Accounting, arrow, bar, blue, business, chart, collection, company, diagram, directive, finance, forecast, future, growth, icon, illustration, market, measure, profit, progress, statistic, stock, success. The prominent colors used in the PowerPoint template are Blue, Gray, White. People tell us our arrows powerpoint 4 stages comparison process flow Slides are designed to make your presentations professional. Presenters tell us our company PowerPoint templates and PPT Slides are effectively colour coded to prioritise your plans They automatically highlight the sequence of events you desire. Customers tell us our arrows powerpoint 4 stages comparison process flow Slides are visually appealing. Customers tell us our blue PowerPoint templates and PPT Slides will get their audience's attention. Professionals tell us our arrows powerpoint 4 stages comparison process flow Slides effectively help you save your valuable time. Use our chart PowerPoint templates and PPT Slides are aesthetically designed to attract attention. We guarantee that they will grab all the eyeballs you need.
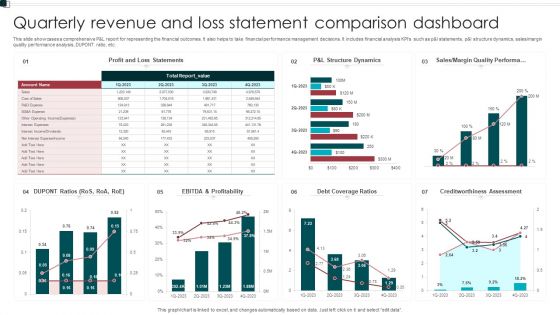
Quarterly Revenue And Loss Statement Comparison Dashboard Portrait PDF
This slide showcases a comprehensive P and L report for representing the financial outcomes. It also helps to take financial performance management decisions. It includes financial analysis KPIs such as p and l statements, p and l structure dynamics, sales or margin quality performance analysis, DUPONT ratio, etc. Showcasing this set of slides titled Quarterly Revenue And Loss Statement Comparison Dashboard Portrait PDF. The topics addressed in these templates are Profitability, Debt Coverage Ratios, Margin Quality Performa. All the content presented in this PPT design is completely editable. Download it and make adjustments in color, background, font etc. as per your unique business setting.

Merchant Performance Comparison With Business Parameters Ideas PDF
The purpose of this slide is to illustrate the performance of two different vendors on certain parameters in order to measure the reliability of vendors. The attributes include points, weighting, and total of vendor A and B. Presenting Merchant Performance Comparison With Business Parameters Ideas PDF to dispense important information. This template comprises one stages. It also presents valuable insights into the topics including Price, Functional Requirement, Business Parameters. This is a completely customizable PowerPoint theme that can be put to use immediately. So, download it and address the topic impactfully.
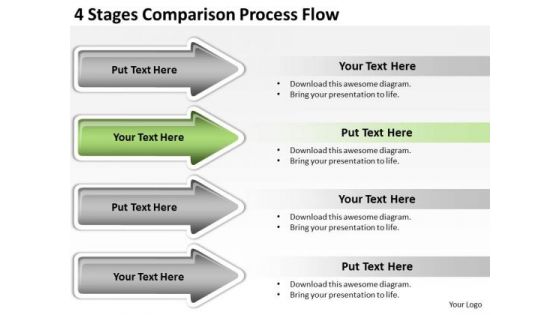
Advantages Of Parallel Processing 4 Stages Comparison Flow PowerPoint Templates
We present our advantages of parallel processing 4 stages comparison flow PowerPoint templates.Download and present our Arrows PowerPoint Templates because you can Add colour to your speech with our PowerPoint Templates and Slides. Your presentation will leave your audience speechless. Use our Business PowerPoint Templates because Our PowerPoint Templates and Slides will Embellish your thoughts. They will help you illustrate the brilliance of your ideas. Use our Steps PowerPoint Templates because Our PowerPoint Templates and Slides will help you be quick off the draw. Just enter your specific text and see your points hit home. Present our Process and Flows PowerPoint Templates because It will Strengthen your hand with your thoughts. They have all the aces you need to win the day. Download our Flow Charts PowerPoint Templates because Our PowerPoint Templates and Slides help you meet the demand of the Market. Just browse and pick the slides that appeal to your intuitive senses.Use these PowerPoint slides for presentations relating to Accounting, arrow, art, bar, blue, business, calculation, chart, collection,company, elements, diagram, directive, expense, finance, firm, forecast,future, gain, graph, grow, growth, icon, illustration, income, line, market, measure,objects, office, profit, progress, rate, set, statistic, stock, success, two, up, . The prominent colors used in the PowerPoint template are Green lime , White, Gray. The feedback we get is that our advantages of parallel processing 4 stages comparison flow PowerPoint templates are readymade to fit into any presentation structure. Professionals tell us our blue PowerPoint templates and PPT Slides will make you look like a winner. Use our advantages of parallel processing 4 stages comparison flow PowerPoint templates are the best it can get when it comes to presenting. Presenters tell us our bar PowerPoint templates and PPT Slides will impress their bosses and teams. You can be sure our advantages of parallel processing 4 stages comparison flow PowerPoint templates are effectively colour coded to prioritise your plans They automatically highlight the sequence of events you desire. PowerPoint presentation experts tell us our chart PowerPoint templates and PPT Slides will impress their bosses and teams.
PowerPoint Arrow Shapes Comparison Process Ppt Templates Backgrounds For Slides
3d, accounting, arrow, art, bar, blue, business, calculation, chart, collection, company, design elements, diagram, directive, expense, finance, firm, forecast, future, gain, graph, grow, growth, icon, illustration, income, line, market, measure, objects, office, profit, progress, rate, set, statistic, stock, success, two, up, vector, yellow

Metrics Depicting Business Operations Metrics Diagrams PDF
Pitch your topic with ease and precision using this Metrics Depicting Business Operations Metrics Diagrams PDF. This layout presents information on Metrics Depicting, Business, Operations Metrics. It is also available for immediate download and adjustment. So, changes can be made in the color, design, graphics or any other component to create a unique layout.
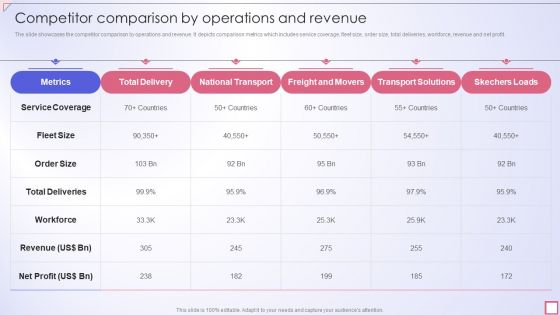
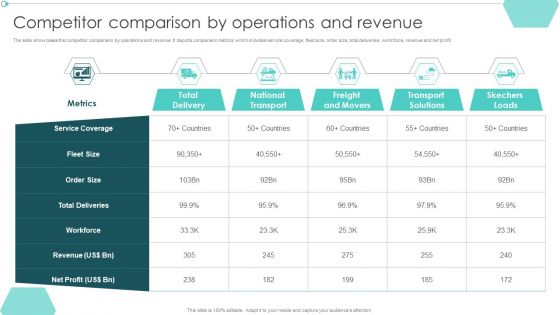
Freight Shipping Company Profile Competitor Comparison By Operations And Revenue Template PDF
The slide showcases the competitor comparison by operations and revenue. It depicts comparison metrics which includes service coverage, fleet size, order size, total deliveries, workforce, revenue and net profit.Deliver an awe inspiring pitch with this creative Freight Shipping Company Profile Competitor Comparison By Operations And Revenue Template PDF bundle. Topics like Service Coverage, Total Deliveries, National Transport can be discussed with this completely editable template. It is available for immediate download depending on the needs and requirements of the user.
Transportation Company Profile Competitor Comparison By Operations And Revenue Ppt PowerPoint Presentation Model Inspiration PDF
The slide showcases the competitor comparison by operations and revenue. It depicts comparison metrics which includes service coverage, fleet size, order size, total deliveries, workforce, revenue and net profit.Deliver an awe inspiring pitch with this creative Transportation Company Profile Competitor Comparison By Operations And Revenue Ppt PowerPoint Presentation Model Inspiration PDF bundle. Topics like National Transport, Freight Movers, Transport Solutions can be discussed with this completely editable template. It is available for immediate download depending on the needs and requirements of the user.
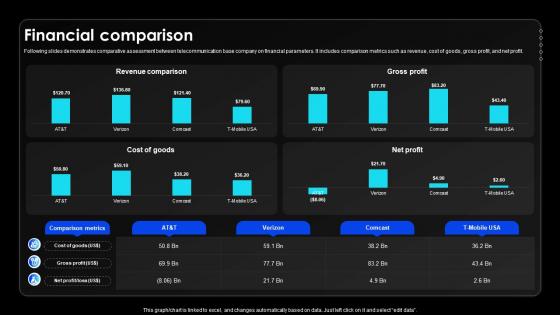
Financial Comparison Wireless Communication Services Provider Company Profile CP SS V
Following slides demonstrates comparative assessment between telecommunication base company on financial parameters. It includes comparison metrics such as revenue, cost of goods, gross profit, and net profit.If your project calls for a presentation, then Slidegeeks is your go-to partner because we have professionally designed, easy-to-edit templates that are perfect for any presentation. After downloading, you can easily edit Financial Comparison Wireless Communication Services Provider Company Profile CP SS V and make the changes accordingly. You can rearrange slides or fill them with different images. Check out all the handy templates

Transportation And Logistics Services Company Profile Competitor Comparison By Operations Inspiration PDF
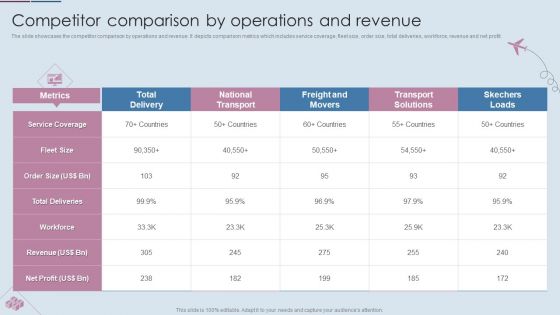
The slide showcases the competitor comparison by operations and revenue. It depicts comparison metrics which includes service coverage, fleet size, order size, total deliveries, workforce, revenue and net profit. Deliver and pitch your topic in the best possible manner with this Transportation And Logistics Services Company Profile Competitor Comparison By Operations Inspiration PDF. Use them to share invaluable insights on Service Coverage, Fleet Size, Workforce, Order Size, Revenue and impress your audience. This template can be altered and modified as per your expectations. So, grab it now.
Logistics Shipment Company Profile Competitor Comparison By Operations And Revenue Brochure PDF
The slide showcases the competitor comparison by operations and revenue. It depicts comparison metrics which includes service coverage, fleet size, order size, total deliveries, workforce, revenue and net profit. Deliver and pitch your topic in the best possible manner with this Logistics Shipment Company Profile Competitor Comparison By Operations And Revenue Brochure PDF. Use them to share invaluable insights on Service Coverage, Order Size, Total Deliveries and impress your audience. This template can be altered and modified as per your expectations. So, grab it now.
Sales Target Metrics Report With Metrics Introduction PDF
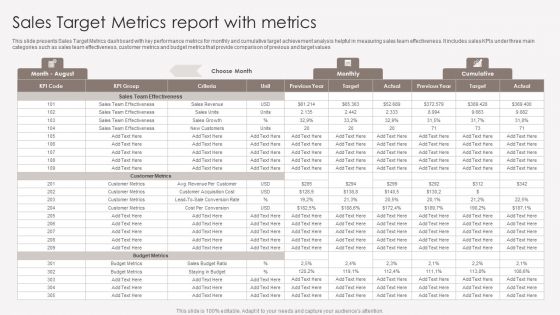
This slide presents Sales Target Metrics dashboard with key performance metrics for monthly and cumulative target achievement analysis helpful in measuring sales team effectiveness. It includes sales KPIs under three main categories such as sales team effectiveness, customer metrics and budget metrics that provide comparison of previous and target values. Pitch your topic with ease and precision using this Sales Target Metrics Report With Metrics Introduction PDF. This layout presents information on Sales Team Effectiveness, Customer Metrics, Budget Metrics. It is also available for immediate download and adjustment. So, changes can be made in the color, design, graphics or any other component to create a unique layout.

Customer Service Metric Benchmarks With Ratings Ppt PowerPoint Presentation Visuals PDF
Pitch your topic with ease and precision using this customer service metric benchmarks with ratings ppt powerpoint presentation visuals pdf. This layout presents information on customer service metric benchmarks with ratings. It is also available for immediate download and adjustment. So, changes can be made in the color, design, graphics or any other component to create a unique layout.
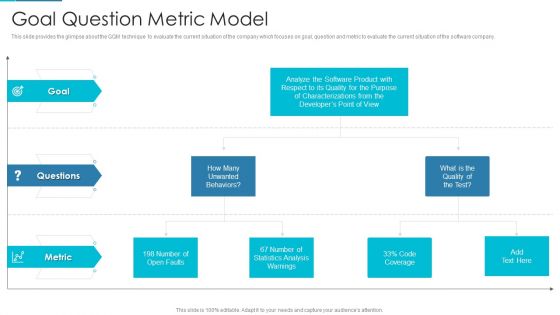
Project Management Outline For Schedule Performance Index Goal Question Metric Model Topics PDF
This slide provides the glimpse about the GQM technique to evaluate the current situation of the company which focuses on goal, question and metric to evaluate the current situation of the software company. Deliver an awe inspiring pitch with this creative project management outline for schedule performance index goal question metric model topics pdf bundle. Topics like goal, metric, developers, analysis can be discussed with this completely editable template. It is available for immediate download depending on the needs and requirements of the user.
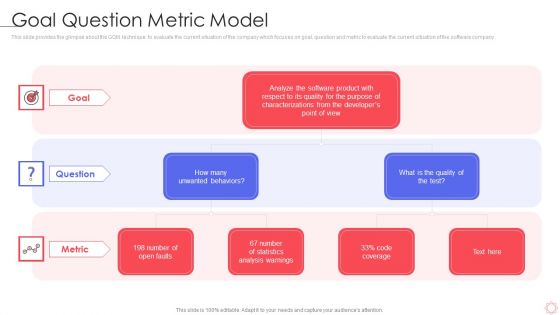
SPI Methodology Goal Question Metric Model Ppt PowerPoint Presentation Gallery Visual Aids PDF
This slide provides the glimpse about the GQM technique to evaluate the current situation of the company which focuses on goal, question and metric to evaluate the current situation of the software company. This is a spi methodology goal question metric model ppt powerpoint presentation gallery visual aids pdf template with various stages. Focus and dispense information on two stages using this creative set, that comes with editable features. It contains large content boxes to add your information on topics like goal, question, metric. You can also showcase facts, figures, and other relevant content using this PPT layout. Grab it now.
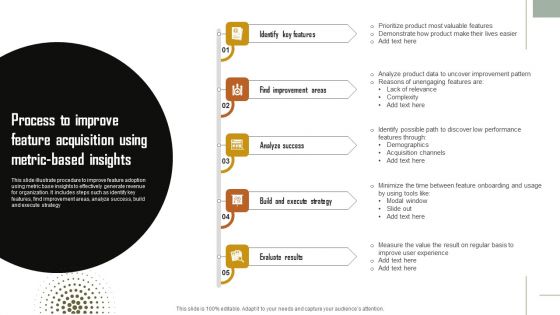
Process To Improve Feature Acquisition Using Metric Based Insights Topics PDF
This slide illustrate procedure to improve feature adoption using metric base insights to effectively generate revenue for organization. It includes steps such as identify key features, find improvement areas, analyze success, build and execute strategy. Persuade your audience using this Process To Improve Feature Acquisition Using Metric Based Insights Topics PDF. This PPT design covers five stages, thus making it a great tool to use. It also caters to a variety of topics including Analyze Success, Build And Execute Strategy, Evaluate Results. Download this PPT design now to present a convincing pitch that not only emphasizes the topic but also showcases your presentation skills.
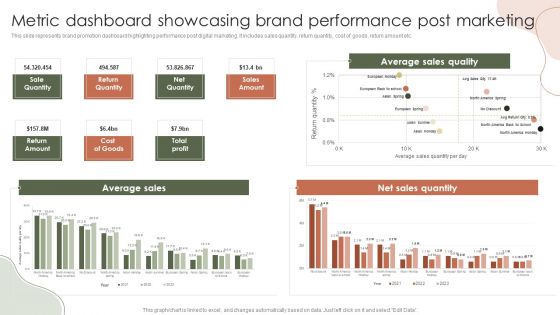
Digital Marketing Approach For Brand Awareness Metric Dashboard Showcasing Brand Performance Post Marketing Mockup PDF
Presenting this PowerPoint presentation, titled Digital Marketing Approach For Brand Awareness Metric Dashboard Showcasing Brand Performance Post Marketing Mockup This slide represents brand promotion dashboard highlighting performance post digital marketing. It includes sales quantity, return quantity, cost of goods, return amount etc. PDF, with topics curated by our researchers after extensive research. This editable presentation is available for immediate download and provides attractive features when used. Download now and captivate your audience. Presenting this Digital Marketing Approach For Brand Awareness Metric Dashboard Showcasing Brand Performance Post Marketing Mockup PDF. Our researchers have carefully researched and created these slides with all aspects taken into consideration. This is a completely customizable Digital Marketing Approach For Brand Awareness Metric Dashboard Showcasing Brand Performance Post Marketing Mockup PDF that is available for immediate downloading. Download now and make an impact on your audience. Highlight the attractive features available with our PPTs.

Metric Dashboard Showcasing Measurement Of Gender Diversity Pay Gap Sample PDF
This slide represents KPI dashboard showcasing metrics to measure gender pay gap. It provides information regarding salary pay gap, bonus pay gap, women promoted, recruited, and total women in each department. Pitch your topic with ease and precision using this Metric Dashboard Showcasing Measurement Of Gender Diversity Pay Gap Sample PDF. This layout presents information on Marketing, Screened, Delivery. It is also available for immediate download and adjustment. So, changes can be made in the color, design, graphics or any other component to create a unique layout.

Customer Data Quality Kpis And Record Uniqueness Metric Scorecard Background PDF
Pitch your topic with ease and precision using this Customer Data Quality Kpis And Record Uniqueness Metric Scorecard Background PDF. This layout presents information on Average Spurious, Records Per Duplicate. It is also available for immediate download and adjustment. So, changes can be made in the color, design, graphics or any other component to create a unique layout.

Customer Service Metric With Satisfaction Levels Ppt PowerPoint Presentation Styles Graphic Images PDF
Pitch your topic with ease and precision using this customer service metric with satisfaction levels ppt powerpoint presentation styles graphic images pdf. This layout presents information on product, knowledge, service. It is also available for immediate download and adjustment. So, changes can be made in the color, design, graphics or any other component to create a unique layout.

Customer NPS Metric With Revenue Growth Impact Ppt Show Portrait PDF
This slide illustrates net promoter score with revenue growth impact. It provides information about market average NPS, respondents, promoter, detractor, passive, etc. Pitch your topic with ease and precision using this Customer NPS Metric With Revenue Growth Impact Ppt Show Portrait PDF. This layout presents information on Promoter, Detractor, Passive. It is also available for immediate download and adjustment. So, changes can be made in the color, design, graphics or any other component to create a unique layout.

Diversity And Inclusion Strategy With Metric To Improve Business Performance Information PDF
This slide showcases diversity and inclusion strategy with KPIs which help businesses understand causality, find success factors and study potential outcomes. It provides information regarding diversity, recruitment , innovation and expectations of internal and external customers. Pitch your topic with ease and precision using this Diversity And Inclusion Strategy With Metric To Improve Business Performance Information PDF. This layout presents information on Stakeholders, Customer, Business Processes. It is also available for immediate download and adjustment. So, changes can be made in the color, design, graphics or any other component to create a unique layout.

Customer NPS Metric Dashboard For Call Centers Ppt Inspiration Smartart PDF
This slide shows net promoter score dashboard for call centers which contains occupancy rate, tickets unassigned, opened tickets, completed tickets and raised tickets. It also has details on resolution rate on first call, enquiries, etc. Pitch your topic with ease and precision using this Customer NPS Metric Dashboard For Call Centers Ppt Inspiration Smartart PDF. This layout presents information on Occupancy Rate, Resolution Rate, Net Promoter Score. It is also available for immediate download and adjustment. So, changes can be made in the color, design, graphics or any other component to create a unique layout.
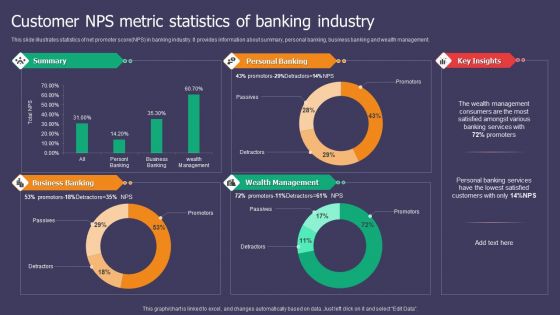
Customer NPS Metric Statistics Of Banking Industry Ppt Styles Microsoft PDF
This slide illustrates statistics of net promoter score NPS in banking industry. It provides information about summary, personal banking, business banking and wealth management. Pitch your topic with ease and precision using this Customer NPS Metric Statistics Of Banking Industry Ppt Styles Microsoft PDF. This layout presents information on Summary, Personal Banking, Business Banking, Wealth Management. It is also available for immediate download and adjustment. So, changes can be made in the color, design, graphics or any other component to create a unique layout.

Ecommerce Customer Survey With Customer NPS Metric Rating Scale Ppt Inspiration Visual Aids PDF
This slide shows net promoter score rating scale with ecommerce customer survey. It includes information about price fairness, customer support experience, order checkout, product quality, passives, promoters, detractors, etc. Pitch your topic with ease and precision using this Ecommerce Customer Survey With Customer NPS Metric Rating Scale Ppt Inspiration Visual Aids PDF. This layout presents information on Net Promoter Score, Price Fairness, Product Purchased. It is also available for immediate download and adjustment. So, changes can be made in the color, design, graphics or any other component to create a unique layout.
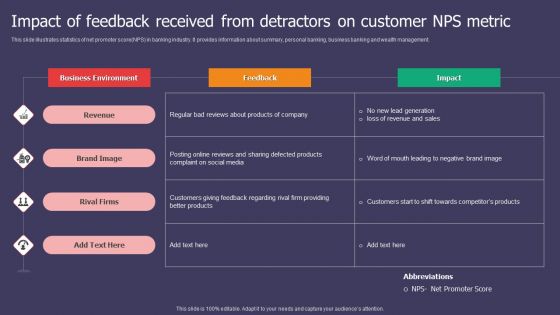
Impact Of Feedback Received From Detractors On Customer NPS Metric Ppt Inspiration Visuals PDF
This slide illustrates statistics of net promoter score NPS in banking industry. It provides information about summary, personal banking, business banking and wealth management. Pitch your topic with ease and precision using this Impact Of Feedback Received From Detractors On Customer NPS Metric Ppt Inspiration Visuals PDF. This layout presents information on Business Environment, Feedback, Revenue. It is also available for immediate download and adjustment. So, changes can be made in the color, design, graphics or any other component to create a unique layout.

Strategic Plan For Organization Diversity And Inclusion With Metric Diagrams PDF
This slide showcases strategic action plan for organization to develop a diversity and inclusion program which helps in business sustainability. It provides information regarding engaging stakeholders and developing Pitch your topic with ease and precision using this Strategic Plan For Organization Diversity And Inclusion With Metric Diagrams PDF. This layout presents information on Objectives, Actionable Points, Strategies. It is also available for immediate download and adjustment. So, changes can be made in the color, design, graphics or any other component to create a unique layout.

Financial Comparison Enterprise Software Solution Providing Company Profile CP SS V
Following slide provides information about software solutions offering company financial comparison. It includes financial metrics such as revenue, cost of goods sold, gross profit and net profit.Welcome to our selection of the Financial Comparison Enterprise Software Solution Providing Company Profile CP SS V. These are designed to help you showcase your creativity and bring your sphere to life. Planning and Innovation are essential for any business that is just starting out. This collection contains the designs that you need for your everyday presentations. All of our PowerPoints are 100 percent editable, so you can customize them to suit your needs. This multi-purpose template can be used in various situations. Grab these presentation templates today.
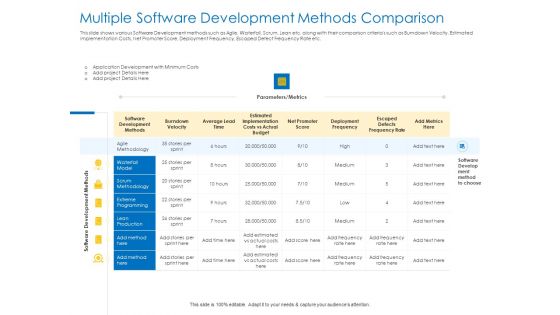
Agile Best Practices For Effective Team Multiple Software Development Methods Comparison Formats PDF
Deliver an awe inspiring pitch with this creative agile best practices for effective team multiple software development methods comparison formats pdf bundle. Topics like development, implementation, costs, metrics, deployment can be discussed with this completely editable template. It is available for immediate download depending on the needs and requirements of the user.
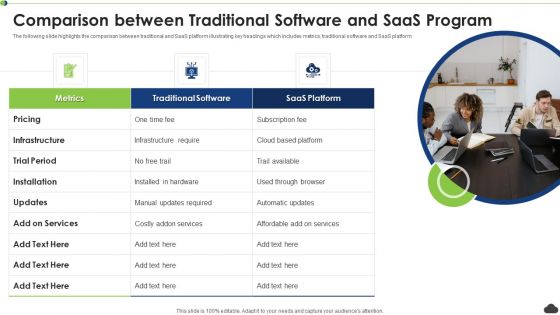
Comparison Between Traditional Software And Saas Program Ppt PowerPoint Presentation File Show PDF
The following slide highlights the comparison between traditional and SaaS platform illustrating key headings which includes metrics, traditional software and SaaS platform. Persuade your audience using this comparison between traditional software and saas program ppt powerpoint presentation file show pdf. This PPT design covers three stages, thus making it a great tool to use. It also caters to a variety of topics including pricing, metrics, traditional software, saas platform. Download this PPT design now to present a convincing pitch that not only emphasizes the topic but also showcases your presentation skills.
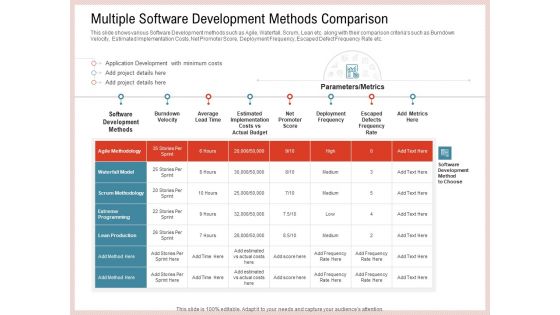
Agile Model Improve Task Team Performance Multiple Software Development Methods Comparison Elements PDF
This slide shows various Software Development methods such as Agile, Waterfall, Scrum, Lean etc. along with their comparison criterias such as Burndown Velocity, Estimated Implementation Costs, Net Promoter Score, Deployment Frequency, Escaped Defect Frequency Rate etc. Deliver an awe inspiring pitch with this creative aagile model improve task team performance multiple software development methods comparison elements pdf bundle. Topics like development, implementation, costs, metrics, deployment can be discussed with this completely editable template. It is available for immediate download depending on the needs and requirements of the user.
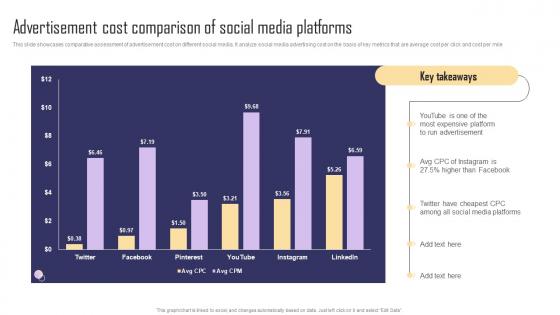
Advertisement Cost Comparison Of Social Media Paid Internet Marketing Strategy Information Pdf
This slide showcases comparative assessment of advertisement cost on different social media. It analyze social media advertising cost on the basis of key metrics that are average cost per click and cost per mile. Boost your pitch with our creative Advertisement Cost Comparison Of Social Media Paid Internet Marketing Strategy Information Pdf. Deliver an awe-inspiring pitch that will mesmerize everyone. Using these presentation templates you will surely catch everyones attention. You can browse the ppts collection on our website. We have researchers who are experts at creating the right content for the templates. So you do not have to invest time in any additional work. Just grab the template now and use them.

Marketing Analytics And Performance Tools Comparison Comprehensive Guide For Marketing Technology
Mentioned slide demonstrates comparative assessment between marketing analytics and performance tracking software solution. It includes key metrics such as data integration, ease of use, data visualization, analytics features, cost, scalability, etc.Get a simple yet stunning designed Marketing Analytics And Performance Tools Comparison Comprehensive Guide For Marketing Technology. It is the best one to establish the tone in your meetings. It is an excellent way to make your presentations highly effective. So, download this PPT today from Slidegeeks and see the positive impacts. Our easy-to-edit Marketing Analytics And Performance Tools Comparison Comprehensive Guide For Marketing Technology can be your go-to option for all upcoming conferences and meetings. So, what are you waiting for Grab this template today.

Computer Mediated Reality Investor Funding Elevator Comparing Our Product Values In Comparison To Competitors Template PDF
Purpose of the following slide is to compare our organization to our competitors as it highlights the key metrics on which we can compare such as Ease to use, space requirements etc. Deliver an awe inspiring pitch with this creative computer mediated reality investor funding elevator comparing our product values in comparison to competitors template pdf bundle. Topics like comparing our product values in comparison to competitors can be discussed with this completely editable template. It is available for immediate download depending on the needs and requirements of the user.

Cyberspace Simulation Platform Fundraising Elevator Comparing Our Product Values In Comparison Summary PDF
Purpose of the following slide is to compare our organization to our competitors as it highlights the key metrics on which we can compare such as Ease to use, space requirements etc. Deliver and pitch your topic in the best possible manner with this cyberspace simulation platform fundraising elevator comparing our product values in comparison summary pdf. Use them to share invaluable insights on comparing our product values in comparison to competitors and impress your audience. This template can be altered and modified as per your expectations. So, grab it now.

 Home
Home