Meter Gauge
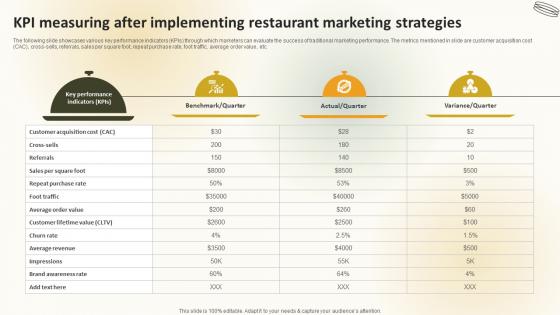
KPI Measuring After Implementing Restaurant Marketing Strategies Create An Effective Restaurant
The following slide showcases various key performance indicators KPIs through which marketers can evaluate the success of traditional marketing performance. The metrics mentioned in slide are customer acquisition cost CAC, cross-sells, referrals, sales per square foot, repeat purchase rate, foot traffic, average order value, etc. Formulating a presentation can take up a lot of effort and time, so the content and message should always be the primary focus. The visuals of the PowerPoint can enhance the presenters message, so our KPI Measuring After Implementing Restaurant Marketing Strategies Create An Effective Restaurant was created to help save time. Instead of worrying about the design, the presenter can concentrate on the message while our designers work on creating the ideal templates for whatever situation is needed. Slidegeeks has experts for everything from amazing designs to valuable content, we have put everything into KPI Measuring After Implementing Restaurant Marketing Strategies Create An Effective Restaurant.
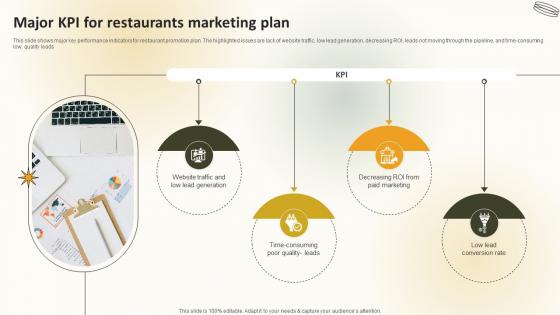
Major KPI For Restaurants Marketing Plan Create An Effective Restaurant
This slide shows major key performance indicators for restaurant promotion plan. The highlighted issues are lack of website traffic, low lead generation, decreasing ROI, leads not moving through the pipeline, and time-consuming low, quality leads. Coming up with a presentation necessitates that the majority of the effort goes into the content and the message you intend to convey. The visuals of a PowerPoint presentation can only be effective if it supplements and supports the story that is being told. Keeping this in mind our experts created Major KPI For Restaurants Marketing Plan Create An Effective Restaurant to reduce the time that goes into designing the presentation. This way, you can concentrate on the message while our designers take care of providing you with the right template for the situation.
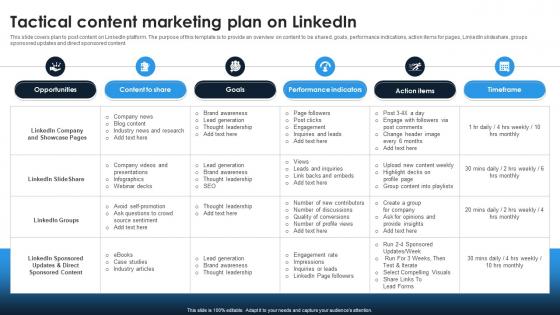
Linkedin Content Strategies Tactical Content Marketing Plan On Linkedin MKT SS V
This slide covers plan to post content on LinkedIn platform. The purpose of this template is to provide an overview on content to be shared, goals, performance indications, action items for pages, LinkedIn slideshare ,groups sponsored updates and direct sponsored content. Present like a pro with Linkedin Content Strategies Tactical Content Marketing Plan On Linkedin MKT SS V. Create beautiful presentations together with your team, using our easy-to-use presentation slides. Share your ideas in real-time and make changes on the fly by downloading our templates. So whether you are in the office, on the go, or in a remote location, you can stay in sync with your team and present your ideas with confidence. With Slidegeeks presentation got a whole lot easier. Grab these presentations today.
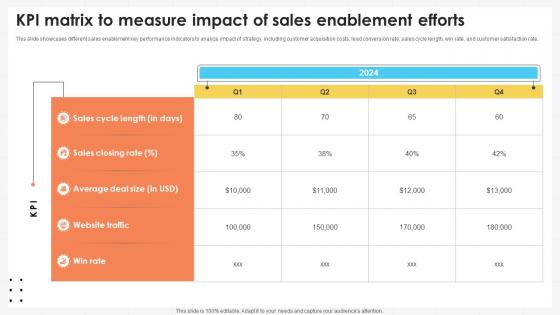
Business Development Team Kpi Matrix To Measure Impact Of Sales Enablement Efforts SA SS V
This slide showcases different sales enablement key performance indicators to analyze impact of strategy, including customer acquisition costs, lead conversion rate, sales cycle length, win rate, and customer satisfaction rate. Are you searching for a Business Development Team Kpi Matrix To Measure Impact Of Sales Enablement Efforts SA SS V that is uncluttered, straightforward, and original Its easy to edit, and you can change the colors to suit your personal or business branding. For a presentation that expresses how much effort you have put in, this template is ideal With all of its features, including tables, diagrams, statistics, and lists, its perfect for a business plan presentation. Make your ideas more appealing with these professional slides. Download Business Development Team Kpi Matrix To Measure Impact Of Sales Enablement Efforts SA SS V from Slidegeeks today.

Analyzing Impact Post Erp And Digital Transformation For Maximizing DT SS V
This slide presents key performance indicators KPIs to measure the success of digital transformation and ERP implementation. It measures the performance of metrics such as increase in digital revenue, customer satisfaction improvement, time-to- market new products and employee digital literacy, etc. Want to ace your presentation in front of a live audience Our Analyzing Impact Post Erp And Digital Transformation For Maximizing DT SS V can help you do that by engaging all the users towards you. Slidegeeks experts have put their efforts and expertise into creating these impeccable powerpoint presentations so that you can communicate your ideas clearly. Moreover, all the templates are customizable, and easy-to-edit and downloadable. Use these for both personal and commercial use.
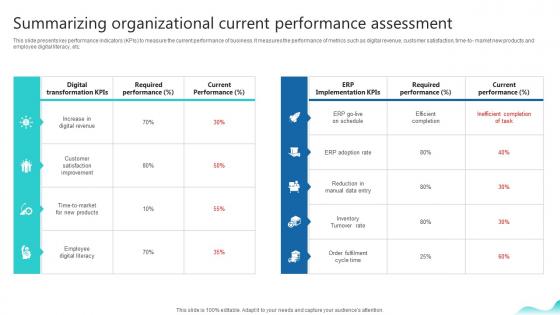
Summarizing Organizational Current Performance Erp And Digital Transformation For Maximizing DT SS V
This slide presents key performance indicators KPIs to measure the current performance of business. It measures the performance of metrics such as digital revenue, customer satisfaction, time-to- market new products and employee digital literacy, etc. Boost your pitch with our creative Summarizing Organizational Current Performance Erp And Digital Transformation For Maximizing DT SS V. Deliver an awe-inspiring pitch that will mesmerize everyone. Using these presentation templates you will surely catch everyones attention. You can browse the ppts collection on our website. We have researchers who are experts at creating the right content for the templates. So you do not have to invest time in any additional work. Just grab the template now and use them.
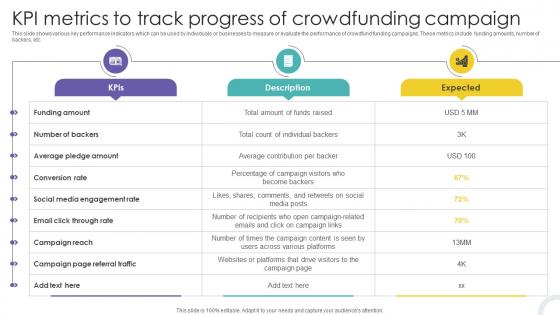
KPI Metrics To Track Progress Of Crowdfunding Strategies To Raise Funds Fin SS V
This slide shows various key performance indicators which can be used by individuals or businesses to measure or evaluate the performance of crowdfund funding campaigns. These metrics include funding amounts, number of backers, etc. Presenting this PowerPoint presentation, titled KPI Metrics To Track Progress Of Crowdfunding Strategies To Raise Funds Fin SS V, with topics curated by our researchers after extensive research. This editable presentation is available for immediate download and provides attractive features when used. Download now and captivate your audience. Presenting this KPI Metrics To Track Progress Of Crowdfunding Strategies To Raise Funds Fin SS V. Our researchers have carefully researched and created these slides with all aspects taken into consideration. This is a completely customizable KPI Metrics To Track Progress Of Crowdfunding Strategies To Raise Funds Fin SS V that is available for immediate downloading. Download now and make an impact on your audience. Highlight the attractive features available with our PPTs.

Dashboard Highlighting Community Building A Winning Community Outreach Strategy SS V
This slide covers dashboard to evaluate the success rate of health campaign launched. The purpose of this template is to provide an overview on performance of the campaign comprising of funds raised, patients enrolled and recovered, summary of health indicators. Whether you have daily or monthly meetings, a brilliant presentation is necessary. Dashboard Highlighting Community Building A Winning Community Outreach Strategy SS V can be your best option for delivering a presentation. Represent everything in detail using Dashboard Highlighting Community Building A Winning Community Outreach Strategy SS V and make yourself stand out in meetings. The template is versatile and follows a structure that will cater to your requirements. All the templates prepared by Slidegeeks are easy to download and edit. Our research experts have taken care of the corporate themes as well. So, give it a try and see the results.

Facebook Marketing Plan KPI Dashboard To Monitor Facebook Marketing Strategy SS V

Facebook Marketing Plan Kpis To Measure Effectiveness Of Facebook Ad Strategy SS V
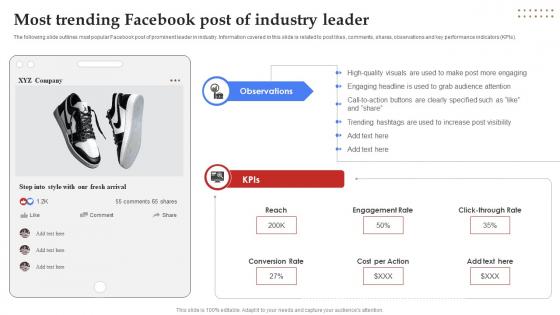
Facebook Marketing Plan Most Trending Facebook Post Of Industry Leader Strategy SS V

Facebook Marketing Plan Running Facebook Advertisement Campaign Strategy SS V

Facebook Marketing Techniques KPI Dashboard To Monitor Facebook Marketing Strategy SS V
The following slide outlines key performance indicator KPI dashboard which can be used to evaluate Facebook advertisement performance. The metrics mentioned in slide are total fans, page views, total actions, post likes, audience growth, fans by language, etc. Do you know about Slidesgeeks Facebook Marketing Techniques KPI Dashboard To Monitor Facebook Marketing Strategy SS V These are perfect for delivering any kind od presentation. Using it, create PowerPoint presentations that communicate your ideas and engage audiences. Save time and effort by using our pre-designed presentation templates that are perfect for a wide range of topic. Our vast selection of designs covers a range of styles, from creative to business, and are all highly customizable and easy to edit. Download as a PowerPoint template or use them as Google Slides themes.

Analyzing Current Business Performance Results Objectives And Key Result Methodology For Business
The following slide highlights existing business performance indicators to review and plan corrective actions of improvement. It includes elements such as quarterly sales revenue, customer acquisition cost along with key insights etc. Slidegeeks is one of the best resources for PowerPoint templates. You can download easily and regulate Analyzing Current Business Performance Results Objectives And Key Result Methodology For Business for your personal presentations from our wonderful collection. A few clicks is all it takes to discover and get the most relevant and appropriate templates. Use our Templates to add a unique zing and appeal to your presentation and meetings. All the slides are easy to edit and you can use them even for advertisement purposes.
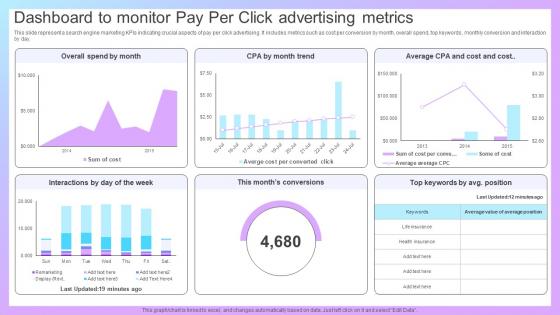
Increasing Business Awareness Dashboard To Monitor Pay Per Click Advertising Strategy SS V
This slide represent a search engine marketing KPIs indicating crucial aspects of pay per click advertising. It includes metrics such as cost per conversion by month, overall spend, top keywords, monthly conversion and interaction by day. Get a simple yet stunning designed Increasing Business Awareness Dashboard To Monitor Pay Per Click Advertising Strategy SS V. It is the best one to establish the tone in your meetings. It is an excellent way to make your presentations highly effective. So, download this PPT today from Slidegeeks and see the positive impacts. Our easy-to-edit Increasing Business Awareness Dashboard To Monitor Pay Per Click Advertising Strategy SS V can be your go-to option for all upcoming conferences and meetings. So, what are you waiting for Grab this template today.
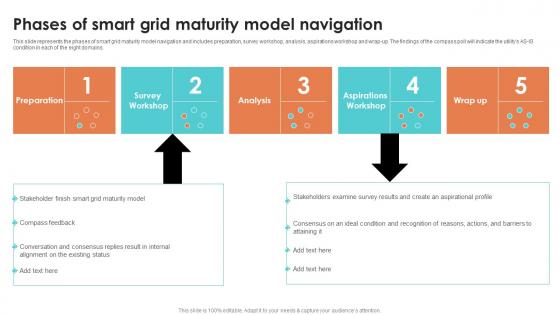
Phases Of Smart Grid Maturity Model Navigation Smart Grid Working
This slide represents the phases of smart grid maturity model navigation and includes preparation, survey workshop, analysis, aspirations workshop and wrap up. The findings of the compass poll will indicate the utilitys AS IS condition in each of the eight domains. Are you searching for a Phases Of Smart Grid Maturity Model Navigation Smart Grid Working that is uncluttered, straightforward, and original Its easy to edit, and you can change the colors to suit your personal or business branding. For a presentation that expresses how much effort you have put in, this template is ideal With all of its features, including tables, diagrams, statistics, and lists, its perfect for a business plan presentation. Make your ideas more appealing with these professional slides. Download Phases Of Smart Grid Maturity Model Navigation Smart Grid Working from Slidegeeks today.

Create A Restaurant Marketing KPI Measuring After Implementing Restaurant
The following slide showcases various key performance indicators KPIs through which marketers can evaluate the success of traditional marketing performance. The metrics mentioned in slide are customer acquisition cost CAC , cross-sells, referrals, sales per square foot, repeat purchase rate, foot traffic, average order value, etc. Crafting an eye-catching presentation has never been more straightforward. Let your presentation shine with this tasteful yet straightforward Create A Restaurant Marketing KPI Measuring After Implementing Restaurant template. It offers a minimalistic and classy look that is great for making a statement. The colors have been employed intelligently to add a bit of playfulness while still remaining professional. Construct the ideal Create A Restaurant Marketing KPI Measuring After Implementing Restaurant that effortlessly grabs the attention of your audience Begin now and be certain to wow your customers
Cryptocurrency Portfolio Tracking Dashboard Summary Cryptocurrency Management With Blockchain
This slide represents the cryptocurrency performance indicators for the individual. The key components include invested money, profit and loss, rate of investment ROI, current valuation of money, etc.Formulating a presentation can take up a lot of effort and time, so the content and message should always be the primary focus. The visuals of the PowerPoint can enhance the presenters message, so our Cryptocurrency Portfolio Tracking Dashboard Summary Cryptocurrency Management With Blockchain was created to help save time. Instead of worrying about the design, the presenter can concentrate on the message while our designers work on creating the ideal templates for whatever situation is needed. Slidegeeks has experts for everything from amazing designs to valuable content, we have put everything into Cryptocurrency Portfolio Tracking Dashboard Summary Cryptocurrency Management With Blockchain.
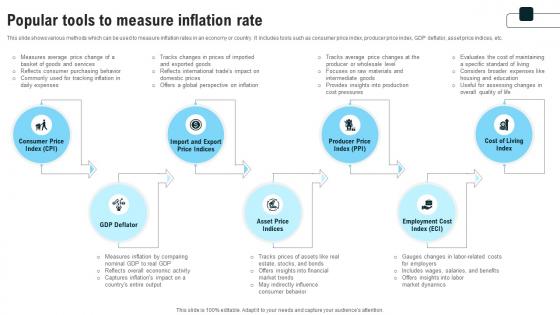
Popular Tools To Measure Inflation Rate Strategies For Inflation A Tactical Guide Fin SS V
This slide shows various methods which can be used to measure inflation rates in an economy or country. It includes tools such as consumer price index, producer price index, GDP deflator, asset price indices, etc. Create an editable Popular Tools To Measure Inflation Rate Strategies For Inflation A Tactical Guide Fin SS V that communicates your idea and engages your audience. Whether you are presenting a business or an educational presentation, pre-designed presentation templates help save time. Popular Tools To Measure Inflation Rate Strategies For Inflation A Tactical Guide Fin SS V is highly customizable and very easy to edit, covering many different styles from creative to business presentations. Slidegeeks has creative team members who have crafted amazing templates. So, go and get them without any delay.

Analysing Impact Of Ineffective Sales Process On Kpis Tactics For Improving Field Sales Team SA SS V
This slide showcases the impact of outside sales team with quarter-wise key performance indicators such as sales cycle length, cost per lead, win rate, etc. Create an editable Analysing Impact Of Ineffective Sales Process On Kpis Tactics For Improving Field Sales Team SA SS V that communicates your idea and engages your audience. Whether you are presenting a business or an educational presentation, pre-designed presentation templates help save time. Analysing Impact Of Ineffective Sales Process On Kpis Tactics For Improving Field Sales Team SA SS V is highly customizable and very easy to edit, covering many different styles from creative to business presentations. Slidegeeks has creative team members who have crafted amazing templates. So, go and get them without any delay.

Impact Of Strategies On Outside Sales Team Kpi Tactics For Improving Field Sales Team SA SS V
This slide showcases the impact of the training program and marketing campaign on key performance indicators such as sales cycle length, cost per lead, win rate, customer acquisition, etc. This Impact Of Strategies On Outside Sales Team Kpi Tactics For Improving Field Sales Team SA SS V is perfect for any presentation, be it in front of clients or colleagues. It is a versatile and stylish solution for organizing your meetings. The Impact Of Strategies On Outside Sales Team Kpi Tactics For Improving Field Sales Team SA SS V features a modern design for your presentation meetings. The adjustable and customizable slides provide unlimited possibilities for acing up your presentation. Slidegeeks has done all the homework before launching the product for you. So, do not wait, grab the presentation templates today

Mild Inflation To Promote Healthy Economic Growth Comprehensive Guide On Inflation Control CM SS V
This slide shows various methods which can be used to measure inflation rates in an economy or country. It includes tools such as consumer price index, producer price index, GDP deflator, asset price indices, etc. Do you know about Slidesgeeks Mild Inflation To Promote Healthy Economic Growth Comprehensive Guide On Inflation Control CM SS V These are perfect for delivering any kind od presentation. Using it, create PowerPoint presentations that communicate your ideas and engage audiences. Save time and effort by using our pre-designed presentation templates that are perfect for a wide range of topic. Our vast selection of designs covers a range of styles, from creative to business, and are all highly customizable and easy to edit. Download as a PowerPoint template or use them as Google Slides themes.

Steps To Calculate Inflation Using Asset Price Comprehensive Guide On Inflation Control CM SS V
This slide shows step by step process which can be used to calculate inflation rate by using asset price indices. It includes stages such as select year, identify assets,, collect price data and interpret results. Get a simple yet stunning designed Steps To Calculate Inflation Using Asset Price Comprehensive Guide On Inflation Control CM SS V. It is the best one to establish the tone in your meetings. It is an excellent way to make your presentations highly effective. So, download this PPT today from Slidegeeks and see the positive impacts. Our easy-to-edit Steps To Calculate Inflation Using Asset Price Comprehensive Guide On Inflation Control CM SS V can be your go-to option for all upcoming conferences and meetings. So, what are you waiting for Grab this template today.

Manufacturing KPI Dashboard For Process Implementing Manufacturing Strategy SS V
The following slide highlights manufacturing and production key performance indicators to track and manage processes. It includes elements such as downtime causes, production volume by machinery, number of returned items, missing parts, service, poor quality etc. Formulating a presentation can take up a lot of effort and time, so the content and message should always be the primary focus. The visuals of the PowerPoint can enhance the presenters message, so our Manufacturing KPI Dashboard For Process Implementing Manufacturing Strategy SS V was created to help save time. Instead of worrying about the design, the presenter can concentrate on the message while our designers work on creating the ideal templates for whatever situation is needed. Slidegeeks has experts for everything from amazing designs to valuable content, we have put everything into Manufacturing KPI Dashboard For Process Implementing Manufacturing Strategy SS V

KPI Metrics To Track Progress Of Crowdfunding Real Estate Crowdfunding To Unlock Fin SS V
This slide shows various key performance indicators which can be used by individuals or businesses to measure or evaluate the performance of crowdfund funding campaigns. These metrics include funding amounts, number of backers, etc. Presenting this PowerPoint presentation, titled KPI Metrics To Track Progress Of Crowdfunding Real Estate Crowdfunding To Unlock Fin SS V, with topics curated by our researchers after extensive research. This editable presentation is available for immediate download and provides attractive features when used. Download now and captivate your audience. Presenting this KPI Metrics To Track Progress Of Crowdfunding Real Estate Crowdfunding To Unlock Fin SS V. Our researchers have carefully researched and created these slides with all aspects taken into consideration. This is a completely customizable KPI Metrics To Track Progress Of Crowdfunding Real Estate Crowdfunding To Unlock Fin SS V that is available for immediate downloading. Download now and make an impact on your audience. Highlight the attractive features available with our PPTs.
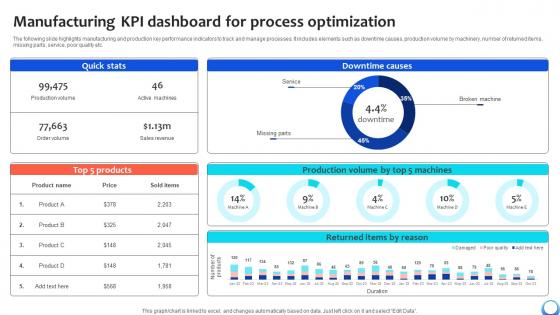
Manufacturing KPI Dashboard For Process Optimization Automating Production Process Strategy SS V
The following slide highlights manufacturing and production key performance indicators to track and manage processes. It includes elements such as downtime causes, production volume by machinery, number of returned items, missing parts, service, poor quality etc. Formulating a presentation can take up a lot of effort and time, so the content and message should always be the primary focus. The visuals of the PowerPoint can enhance the presenters message, so our Manufacturing KPI Dashboard For Process Optimization Automating Production Process Strategy SS V was created to help save time. Instead of worrying about the design, the presenter can concentrate on the message while our designers work on creating the ideal templates for whatever situation is needed. Slidegeeks has experts for everything from amazing designs to valuable content, we have put everything into Manufacturing KPI Dashboard For Process Optimization Automating Production Process Strategy SS V
Tracking First Response Time With KPI Boosting Customer Retention Rate With Live Chat
The following slide depicts key performance indicators to review call resolution time and offer real time support. It also includes elements such as unsolved calls, weekly response time analysis, best day to call etc. Presenting this PowerPoint presentation, titled Tracking First Response Time With KPI Boosting Customer Retention Rate With Live Chat, with topics curated by our researchers after extensive research. This editable presentation is available for immediate download and provides attractive features when used. Download now and captivate your audience. Presenting this Tracking First Response Time With KPI Boosting Customer Retention Rate With Live Chat. Our researchers have carefully researched and created these slides with all aspects taken into consideration. This is a completely customizable Tracking First Response Time With KPI Boosting Customer Retention Rate With Live Chat that is available for immediate downloading. Download now and make an impact on your audience. Highlight the attractive features available with our PPTs.

Analysing Impact Of Ineffective Sales Process Efficient Sales Territory Management To Build SA SS V
This slide showcases the impact of outside sales team with quarter-wise key performance indicators such as sales cycle length, cost per lead, win rate, etc. Create an editable Analysing Impact Of Ineffective Sales Process Efficient Sales Territory Management To Build SA SS V that communicates your idea and engages your audience. Whether you are presenting a business or an educational presentation, pre-designed presentation templates help save time. Analysing Impact Of Ineffective Sales Process Efficient Sales Territory Management To Build SA SS V is highly customizable and very easy to edit, covering many different styles from creative to business presentations. Slidegeeks has creative team members who have crafted amazing templates. So, go and get them without any delay.
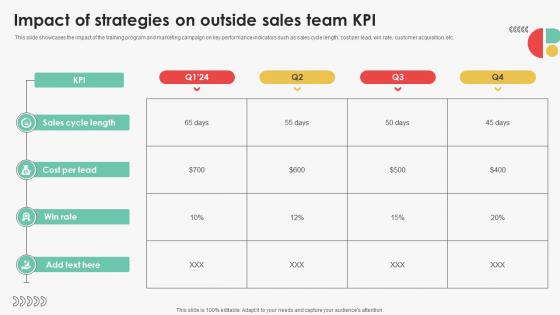
Impact Of Strategies On Outside Sales Team Efficient Sales Territory Management To Build SA SS V
This slide showcases the impact of the training program and marketing campaign on key performance indicators such as sales cycle length, cost per lead, win rate, customer acquisition, etc. This Impact Of Strategies On Outside Sales Team Efficient Sales Territory Management To Build SA SS V is perfect for any presentation, be it in front of clients or colleagues. It is a versatile and stylish solution for organizing your meetings. The Impact Of Strategies On Outside Sales Team Efficient Sales Territory Management To Build SA SS V features a modern design for your presentation meetings. The adjustable and customizable slides provide unlimited possibilities for acing up your presentation. Slidegeeks has done all the homework before launching the product for you. So, do not wait, grab the presentation templates today

Relationship Management Automation Impact Of Supplier Relationship Management
Mentioned slide demonstrates KPI for tracking impact of suppliers relationship management solutions on organisational production. It includes key performance indicators such as lead time compliance rate, defective product, product quality and timely product delivery. Formulating a presentation can take up a lot of effort and time, so the content and message should always be the primary focus. The visuals of the PowerPoint can enhance the presenters message, so our Relationship Management Automation Impact Of Supplier Relationship Management was created to help save time. Instead of worrying about the design, the presenter can concentrate on the message while our designers work on creating the ideal templates for whatever situation is needed. Slidegeeks has experts for everything from amazing designs to valuable content, we have put everything into Relationship Management Automation Impact Of Supplier Relationship Management

Relationship Management Automation KPI Dashboard To Track Supplier Relationship
Mentioned slide provides information about various key performance indicators which can be used to evaluate impact of relations management on suppliers performance, it includes key points such as total suppliers, contracted, unlisted, average procurement cycle, suppliers share by different products. etc. This Relationship Management Automation KPI Dashboard To Track Supplier Relationship is perfect for any presentation, be it in front of clients or colleagues. It is a versatile and stylish solution for organizing your meetings. The Relationship Management Automation KPI Dashboard To Track Supplier Relationship features a modern design for your presentation meetings. The adjustable and customizable slides provide unlimited possibilities for acing up your presentation. Slidegeeks has done all the homework before launching the product for you. So, do not wait, grab the presentation templates today

Relationship Management Automation Software Impact Of Supplier Relationships Challenges
Mentioned slide illustrates supplier relationship management challenges impact on business led to reduce business performance. It includes key performance indicators such as lead time, compliance rate, defective product, product quality and timely product delivery. Slidegeeks is one of the best resources for PowerPoint templates. You can download easily and regulate Relationship Management Automation Software Impact Of Supplier Relationships Challenges for your personal presentations from our wonderful collection. A few clicks is all it takes to discover and get the most relevant and appropriate templates. Use our Templates to add a unique zing and appeal to your presentation and meetings. All the slides are easy to edit and you can use them even for advertisement purposes.

Relationship Management Strategies Impact On Employee Productivity
Following slide outlines various KPIs metrics which can be used by businesses to determine the impact of relationship management strategies on employees. It includes key performance indicators such as average employee performance rate, employee motivation level, employee turnover, number of complaints received, etc. If you are looking for a format to display your unique thoughts, then the professionally designed Relationship Management Strategies Impact On Employee Productivity is the one for you. You can use it as a Google Slides template or a PowerPoint template. Incorporate impressive visuals, symbols, images, and other charts. Modify or reorganize the text boxes as you desire. Experiment with shade schemes and font pairings. Alter, share or cooperate with other people on your work. Download Relationship Management Strategies Impact On Employee Productivity and find out how to give a successful presentation. Present a perfect display to your team and make your presentation unforgettable.

Current Analysis Analysing Retail Store Performance Optimizing Retail Operations With Digital DT SS V
This slide help analyse the declining performance of current key performance indicators of retail store. It includes marketing and sales, inventory management, customer relationship, data utilization, employee productivity, and competitive analysis.Whether you have daily or monthly meetings, a brilliant presentation is necessary. Current Analysis Analysing Retail Store Performance Optimizing Retail Operations With Digital DT SS V can be your best option for delivering a presentation. Represent everything in detail using Current Analysis Analysing Retail Store Performance Optimizing Retail Operations With Digital DT SS V and make yourself stand out in meetings. The template is versatile and follows a structure that will cater to your requirements. All the templates prepared by Slidegeeks are easy to download and edit. Our research experts have taken care of the corporate themes as well. So, give it a try and see the results.

Post Digitalization Analysing The Impact On Retail Optimizing Retail Operations With Digital DT SS V
This slide help analyses the improving performance of key performance indicators of retail companies after successful digitalization. It includes online sales growth, cart abandonment rate, customer complaints, inventory inaccuracy, time-to-market, supply chain efficiency, foot traffic, and marketing ROI.This Post Digitalization Analysing The Impact On Retail Optimizing Retail Operations With Digital DT SS V is perfect for any presentation, be it in front of clients or colleagues. It is a versatile and stylish solution for organizing your meetings. The Post Digitalization Analysing The Impact On Retail Optimizing Retail Operations With Digital DT SS V features a modern design for your presentation meetings. The adjustable and customizable slides provide unlimited possibilities for acing up your presentation. Slidegeeks has done all the homework before launching the product for you. So, do not wait, grab the presentation templates today
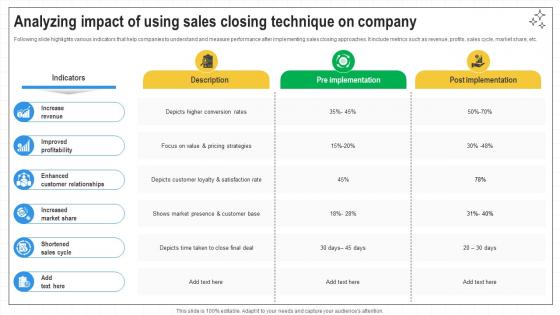
Closing Techniques To Seal Analyzing Impact Of Using Sales Closing Technique SA SS V
Following slide highlights various indicators that help companies to understand and measure performance after implementing sales closing approaches. It include metrics such as revenue, profits, sales cycle, market share, etc. Slidegeeks is one of the best resources for PowerPoint templates. You can download easily and regulate Closing Techniques To Seal Analyzing Impact Of Using Sales Closing Technique SA SS V for your personal presentations from our wonderful collection. A few clicks is all it takes to discover and get the most relevant and appropriate templates. Use our Templates to add a unique zing and appeal to your presentation and meetings. All the slides are easy to edit and you can use them even for advertisement purposes.
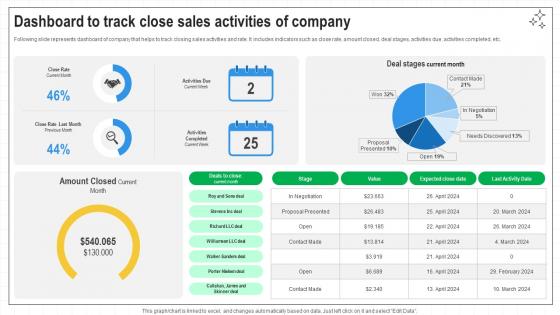
Closing Techniques To Seal Dashboard To Track Close Sales Activities Of Company SA SS V
Following slide represents dashboard of company that helps to track closing sales activities and rate. It includes indicators such as close rate, amount closed, deal stages, activities due, activities completed, etc. If you are looking for a format to display your unique thoughts, then the professionally designed Closing Techniques To Seal Dashboard To Track Close Sales Activities Of Company SA SS V is the one for you. You can use it as a Google Slides template or a PowerPoint template. Incorporate impressive visuals, symbols, images, and other charts. Modify or reorganize the text boxes as you desire. Experiment with shade schemes and font pairings. Alter, share or cooperate with other people on your work. Download Closing Techniques To Seal Dashboard To Track Close Sales Activities Of Company SA SS V and find out how to give a successful presentation. Present a perfect display to your team and make your presentation unforgettable.
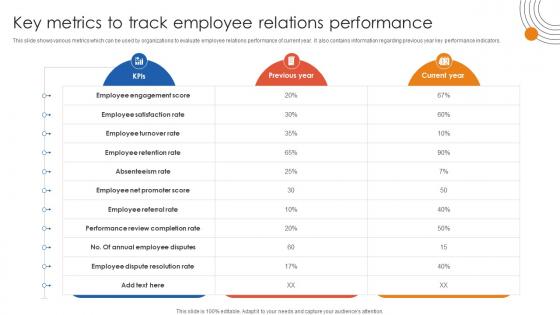
Human Resource Industrial Relationship Key Metrics To Track Employee Relations Performance
This slide shows various metrics which can be used by organizations to evaluate employee relations performance of current year. It also contains information regarding previous year key performance indicators. This modern and well-arranged Human Resource Industrial Relationship Key Metrics To Track Employee Relations Performance provides lots of creative possibilities. It is very simple to customize and edit with the Powerpoint Software. Just drag and drop your pictures into the shapes. All facets of this template can be edited with Powerpoint, no extra software is necessary. Add your own material, put your images in the places assigned for them, adjust the colors, and then you can show your slides to the world, with an animated slide included.

Manufacturing KPI Dashboard For Process Manufacturing Strategy Driving Industry 4 0
The following slide highlights manufacturing and production key performance indicators to track and manage processes. It includes elements such as downtime causes, production volume by machinery, number of returned items, missing parts, service, poor quality etc. Boost your pitch with our creative Manufacturing KPI Dashboard For Process Manufacturing Strategy Driving Industry 4 0. Deliver an awe-inspiring pitch that will mesmerize everyone. Using these presentation templates you will surely catch everyones attention. You can browse the ppts collection on our website. We have researchers who are experts at creating the right content for the templates. So you do not have to invest time in any additional work. Just grab the template now and use them.

Financial Projections Technology Solutions Provider Investor Funding Elevator Pitch Deck
This slide caters to the details related to the forecast of companies future. It highlights revenue, net income, free cash flow, and cash balance recorded which indicates positive performance and future growth potential. Slidegeeks is here to make your presentations a breeze with Financial Projections Technology Solutions Provider Investor Funding Elevator Pitch Deck With our easy-to-use and customizable templates, you can focus on delivering your ideas rather than worrying about formatting. With a variety of designs to choose from, you are sure to find one that suits your needs. And with animations and unique photos, illustrations, and fonts, you can make your presentation pop. So whether you are giving a sales pitch or presenting to the board, make sure to check out Slidegeeks first
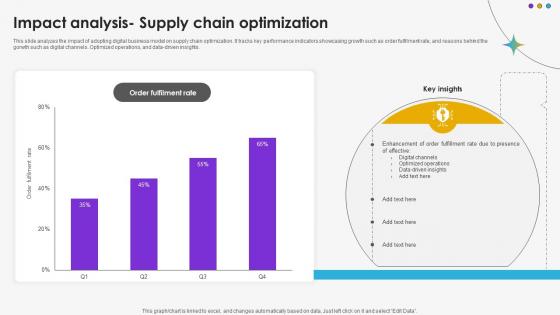
Impact Analysis Supply Chain Optimization DT SS V
This slide analyzes the impact of adopting digital business model on supply chain optimization. It tracks key performance indicators showcasing growth such as order fulfilment rate, and reasons behind the gorwth such as digital channels. Optimized operations, and data-driven insights.Whether you have daily or monthly meetings, a brilliant presentation is necessary. Impact Analysis Supply Chain Optimization DT SS V can be your best option for delivering a presentation. Represent everything in detail using Impact Analysis Supply Chain Optimization DT SS V and make yourself stand out in meetings. The template is versatile and follows a structure that will cater to your requirements. All the templates prepared by Slidegeeks are easy to download and edit. Our research experts have taken care of the corporate themes as well. So, give it a try and see the results.

Current Analysis Analysing Retail Store Performance DT SS V
This slide help analyse the declining performance of current key performance indicators of retail store. It includes marketing and sales, inventory management, customer relationship, data utilization, employee productivity, and competitive analysis.Whether you have daily or monthly meetings, a brilliant presentation is necessary. Current Analysis Analysing Retail Store Performance DT SS V can be your best option for delivering a presentation. Represent everything in detail using Current Analysis Analysing Retail Store Performance DT SS V and make yourself stand out in meetings. The template is versatile and follows a structure that will cater to your requirements. All the templates prepared by Slidegeeks are easy to download and edit. Our research experts have taken care of the corporate themes as well. So, give it a try and see the results.
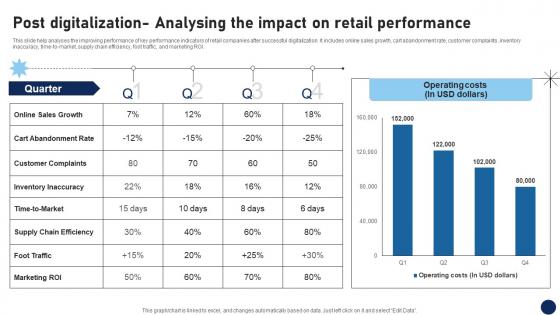
Post Digitalization Analysing The Impact On Retail Performance DT SS V
This slide help analyses the improving performance of key performance indicators of retail companies after successful digitalization. It includes online sales growth, cart abandonment rate, customer complaints, inventory inaccuracy, time-to-market, supply chain efficiency, foot traffic, and marketing ROI. This modern and well-arranged Post Digitalization Analysing The Impact On Retail Performance DT SS V provides lots of creative possibilities. It is very simple to customize and edit with the Powerpoint Software. Just drag and drop your pictures into the shapes. All facets of this template can be edited with Powerpoint, no extra software is necessary. Add your own material, put your images in the places assigned for them, adjust the colors, and then you can show your slides to the world, with an animated slide included.

Impact Assessment In Pre And Post Implementation Periods Product Analytics Implementation Data Analytics V
This slide showcases impact analysis of above mentioned data analytics strategies on employees via use of major performance indicators. It provides information about engagement rate, retention rate, customer lifetime value, number of crashes and feature adoption rate with key insights Explore a selection of the finest Impact Assessment In Pre And Post Implementation Periods Product Analytics Implementation Data Analytics V here. With a plethora of professionally designed and pre-made slide templates, you can quickly and easily find the right one for your upcoming presentation. You can use our Impact Assessment In Pre And Post Implementation Periods Product Analytics Implementation Data Analytics V to effectively convey your message to a wider audience. Slidegeeks has done a lot of research before preparing these presentation templates. The content can be personalized and the slides are highly editable. Grab templates today from Slidegeeks.

Marketing Growth Strategy Customer Loyalty Program To Increase Sales Strategy SS V
The following slide outlines comprehensive loyalty program that can encourage customers to purchase more and lead to more product or service sales. It provides detailed information about program overview, advantages, objectives, target audience, and key performance indicators KPIs. Do you have to make sure that everyone on your team knows about any specific topic I yes, then you should give Marketing Growth Strategy Customer Loyalty Program To Increase Sales Strategy SS V a try. Our experts have put a lot of knowledge and effort into creating this impeccable Marketing Growth Strategy Customer Loyalty Program To Increase Sales Strategy SS V. You can use this template for your upcoming presentations, as the slides are perfect to represent even the tiniest detail. You can download these templates from the Slidegeeks website and these are easy to edit. So grab these today
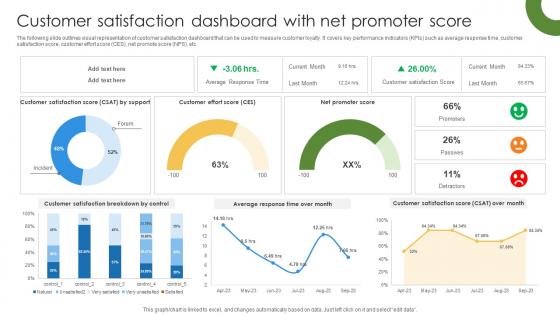
Marketing Growth Strategy Customer Satisfaction Dashboard With Net Promoter Strategy SS V
The following slide outlines visual representation of customer satisfaction dashboard that can be used to measure customer loyalty. It covers key performance indicators KPIs such as average response time, customer satisfaction score, customer effort score CES, net promote score NPS, etc. Get a simple yet stunning designed Marketing Growth Strategy Customer Satisfaction Dashboard With Net Promoter Strategy SS V. It is the best one to establish the tone in your meetings. It is an excellent way to make your presentations highly effective. So, download this PPT today from Slidegeeks and see the positive impacts. Our easy-to-edit Marketing Growth Strategy Customer Satisfaction Dashboard With Net Promoter Strategy SS V can be your go-to option for all upcoming conferences and meetings. So, what are you waiting for Grab this template today.
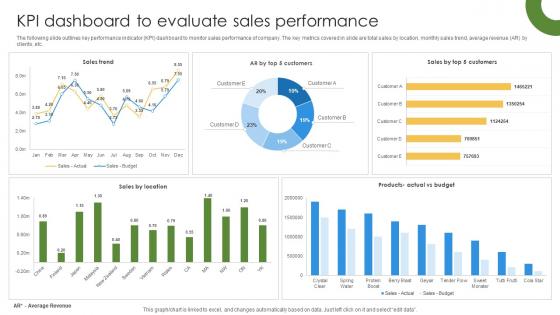
Marketing Growth Strategy KPI Dashboard To Evaluate Sales Performance Strategy SS V
The following slide outlines key performance indicator KPI dashboard to monitor sales performance of company. The key metrics covered in slide are total sales by location, monthly sales trend, average revenue AR by clients, etc. This Marketing Growth Strategy KPI Dashboard To Evaluate Sales Performance Strategy SS V is perfect for any presentation, be it in front of clients or colleagues. It is a versatile and stylish solution for organizing your meetings. The Marketing Growth Strategy KPI Dashboard To Evaluate Sales Performance Strategy SS V features a modern design for your presentation meetings. The adjustable and customizable slides provide unlimited possibilities for acing up your presentation. Slidegeeks has done all the homework before launching the product for you. So, do not wait, grab the presentation templates today

Marketing Growth Strategy Kpis To Measure Success Of Field Marketing Campaign Strategy SS V
The following slide outlines various key performance indicators KPIs that can assist marketers in evaluating efficiency of field marketing campaign. The success metrics mentioned in slide are total leads, customer conversion rate, cost per acquisition CPA, customer lifetime value CLV, etc. Welcome to our selection of the Marketing Growth Strategy Kpis To Measure Success Of Field Marketing Campaign Strategy SS V. These are designed to help you showcase your creativity and bring your sphere to life. Planning and Innovation are essential for any business that is just starting out. This collection contains the designs that you need for your everyday presentations. All of our PowerPoints are 100Percent editable, so you can customize them to suit your needs. This multi-purpose template can be used in various situations. Grab these presentation templates today.
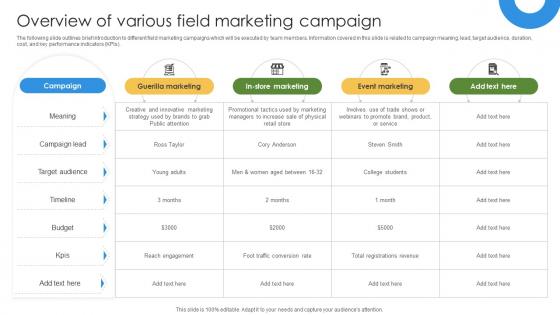
Marketing Growth Strategy Overview Of Various Field Marketing Campaign Strategy SS V
The following slide outlines brief introduction to different field marketing campaigns which will be executed by team members. Information covered in this slide is related to campaign meaning, lead, target audience, duration, cost, and key performance indicators KPIs. Here you can discover an assortment of the finest PowerPoint and Google Slides templates. With these templates, you can create presentations for a variety of purposes while simultaneously providing your audience with an eye-catching visual experience. Download Marketing Growth Strategy Overview Of Various Field Marketing Campaign Strategy SS V to deliver an impeccable presentation. These templates will make your job of preparing presentations much quicker, yet still, maintain a high level of quality. Slidegeeks has experienced researchers who prepare these templates and write high-quality content for you. Later on, you can personalize the content by editing the Marketing Growth Strategy Overview Of Various Field Marketing Campaign Strategy SS V.
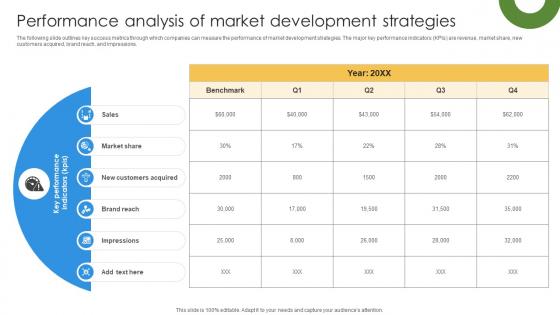
Marketing Growth Strategy Performance Analysis Of Market Development Strategy SS V
The following slide outlines key success metrics through which companies can measure the performance of market development strategies. The major key performance indicators KPIs are revenue, market share, new customers acquired, brand reach, and impressions. This Marketing Growth Strategy Performance Analysis Of Market Development Strategy SS V from Slidegeeks makes it easy to present information on your topic with precision. It provides customization options, so you can make changes to the colors, design, graphics, or any other component to create a unique layout. It is also available for immediate download, so you can begin using it right away. Slidegeeks has done good research to ensure that you have everything you need to make your presentation stand out. Make a name out there for a brilliant performance.
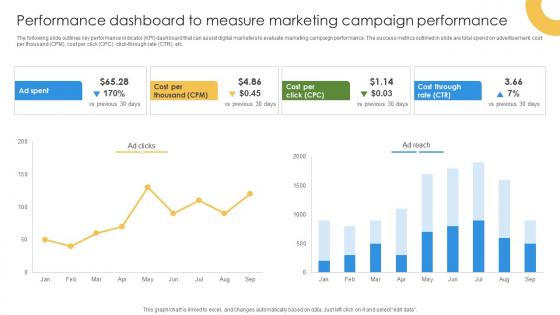
Marketing Growth Strategy Performance Dashboard To Measure Marketing Strategy SS V
The following slide outlines key performance indicator KPI dashboard that can assist digital marketers to evaluate marketing campaign performance. The success metrics outlined in slide are total spend on advertisement, cost per thousand CPM, cost per click CPC, click-through rate CTR, etc. Take your projects to the next level with our ultimate collection of Marketing Growth Strategy Performance Dashboard To Measure Marketing Strategy SS V. Slidegeeks has designed a range of layouts that are perfect for representing task or activity duration, keeping track of all your deadlines at a glance. Tailor these designs to your exact needs and give them a truly corporate look with your own brand colors they will make your projects stand out from the rest

Marketing Growth Strategy To Overview Of Various Influencer Marketing Campaign Strategy SS V
The following slide outlines brief introduction to different influencer marketing campaigns such as sponsored posts, social media giveaways, and product reviews. It covers information about campaign goals, influencer, social media channels, format, budget, timeline, and key performance indicators KPIs. Present like a pro with Marketing Growth Strategy To Overview Of Various Influencer Marketing Campaign Strategy SS V. Create beautiful presentations together with your team, using our easy-to-use presentation slides. Share your ideas in real-time and make changes on the fly by downloading our templates. So whether you are in the office, on the go, or in a remote location, you can stay in sync with your team and present your ideas with confidence. With Slidegeeks presentation got a whole lot easier. Grab these presentations today.
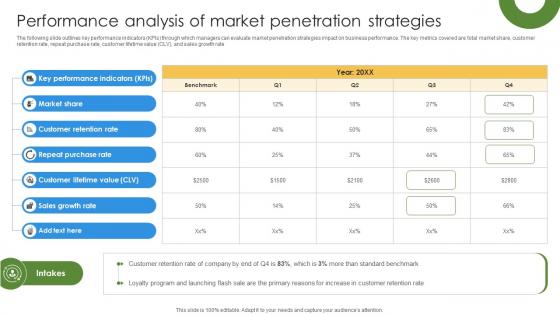
Marketing Growth Strategy To Performance Analysis Of Market Penetration Strategies Strategy SS V
The following slide outlines key performance indicators KPIs through which managers can evaluate market penetration strategies impact on business performance. The key metrics covered are total market share, customer retention rate, repeat purchase rate, customer lifetime value CLV, and sales growth rate. Slidegeeks is here to make your presentations a breeze with Marketing Growth Strategy To Performance Analysis Of Market Penetration Strategies Strategy SS V With our easy-to-use and customizable templates, you can focus on delivering your ideas rather than worrying about formatting. With a variety of designs to choose from, you are sure to find one that suits your needs. And with animations and unique photos, illustrations, and fonts, you can make your presentation pop. So whether you are giving a sales pitch or presenting to the board, make sure to check out Slidegeeks first

Marketing Growth Strategy To Strengthen Performance Analysis Of Product Strategy SS V
The following slide outlines various key performance indicators KPIs that can be used to evaluate the success of product diversification strategies. The key metrics outlined in slide are product revenue, total customers acquired, return on investment ROI, product adoption rate, and customer satisfaction rate. If you are looking for a format to display your unique thoughts, then the professionally designed Marketing Growth Strategy To Strengthen Performance Analysis Of Product Strategy SS V is the one for you. You can use it as a Google Slides template or a PowerPoint template. Incorporate impressive visuals, symbols, images, and other charts. Modify or reorganize the text boxes as you desire. Experiment with shade schemes and font pairings. Alter, share or cooperate with other people on your work. Download Marketing Growth Strategy To Strengthen Performance Analysis Of Product Strategy SS V and find out how to give a successful presentation. Present a perfect display to your team and make your presentation unforgettable.

Navigating B2B Sales Essential Kpis To Measure B2B Sales Strategy SA SS V
This slide presents the major key parameter indicators to measure B2B sales strategy performance. It include some the KPI such as conversion rate, customer acquisition cost, sales growth rate, average deal size, sales pipeline velocity, win rate, etc. Here you can discover an assortment of the finest PowerPoint and Google Slides templates. With these templates, you can create presentations for a variety of purposes while simultaneously providing your audience with an eye-catching visual experience. Download Navigating B2B Sales Essential Kpis To Measure B2B Sales Strategy SA SS V to deliver an impeccable presentation. These templates will make your job of preparing presentations much quicker, yet still, maintain a high level of quality. Slidegeeks has experienced researchers who prepare these templates and write high-quality content for you. Later on, you can personalize the content by editing the Navigating B2B Sales Essential Kpis To Measure B2B Sales Strategy SA SS V.
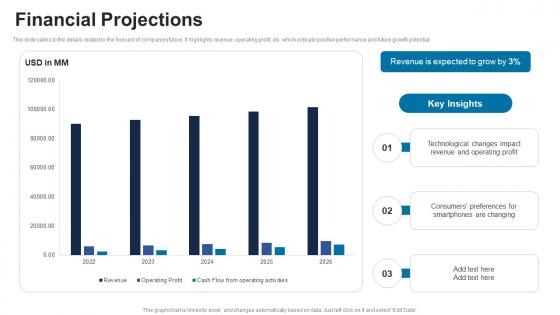
Financial Projections ICT Solutions Provider Investor Funding Elevator Pitch Deck
This slide caters to the details related to the forecast of companies future. It highlights revenue, operating profit, etc. which indicate positive performance and future growth potential. Slidegeeks is here to make your presentations a breeze with Financial Projections ICT Solutions Provider Investor Funding Elevator Pitch Deck With our easy-to-use and customizable templates, you can focus on delivering your ideas rather than worrying about formatting. With a variety of designs to choose from, you are sure to find one that suits your needs. And with animations and unique photos, illustrations, and fonts, you can make your presentation pop. So whether you are giving a sales pitch or presenting to the board, make sure to check out Slidegeeks first

Integrating AI With IoT Kpi Analytics Dashboard For Smart Home IoT SS V
The purpose of this slide is to showcase key performance indicators KPIs dashboard for smart homes. The metrics mentioned in slide are indoor temperature, humidity, light intensity, etc. Are you searching for a Integrating AI With IoT Kpi Analytics Dashboard For Smart Home IoT SS V that is uncluttered, straightforward, and original Its easy to edit, and you can change the colors to suit your personal or business branding. For a presentation that expresses how much effort you have put in, this template is ideal With all of its features, including tables, diagrams, statistics, and lists, its perfect for a business plan presentation. Make your ideas more appealing with these professional slides. Download Integrating AI With IoT Kpi Analytics Dashboard For Smart Home IoT SS V from Slidegeeks today.

Comprehensive Guide On Current Strategies Step 5 Check Product Labels As Per Standards Given By Codex
The slide showcases step five and the final step i.e. to check product labels indicating properties of the food product within the package. The slide contains elements such as product identity, ingredient listing, net quantity etc. Boost your pitch with our creative Comprehensive Guide On Current Strategies Step 5 Check Product Labels As Per Standards Given By Codex. Deliver an awe-inspiring pitch that will mesmerize everyone. Using these presentation templates you will surely catch everyones attention. You can browse the ppts collection on our website. We have researchers who are experts at creating the right content for the templates. So you do not have to invest time in any additional work. Just grab the template now and use them.
Guide To Building A Successful Kpis To Measure Effectiveness Of Content On Auto Dealer Strategy SS V
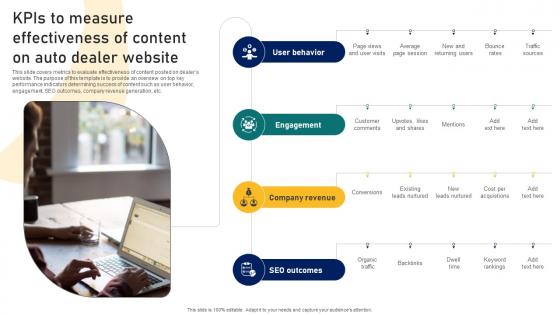
This slide covers metrics to evaluate effectiveness of content posted on dealers website. The purpose of this template is to provide an overview on top key performance indicators determining success of content such as user behavior, engagement, SEO outcomes, company revenue generation, etc. The Guide To Building A Successful Kpis To Measure Effectiveness Of Content On Auto Dealer Strategy SS V is a compilation of the most recent design trends as a series of slides. It is suitable for any subject or industry presentation, containing attractive visuals and photo spots for businesses to clearly express their messages. This template contains a variety of slides for the user to input data, such as structures to contrast two elements, bullet points, and slides for written information. Slidegeeks is prepared to create an impression.

Ultimate Guide To Developing Kpis To Measure Effectiveness Of Content On Auto Dealer Strategy SS V
This slide covers metrics to evaluate effectiveness of content posted on dealers website. The purpose of this template is to provide an overview on top key performance indicators determining success of content such as user behavior, engagement, SEO outcomes, company revenue generation, etc. The Ultimate Guide To Developing Kpis To Measure Effectiveness Of Content On Auto Dealer Strategy SS V is a compilation of the most recent design trends as a series of slides. It is suitable for any subject or industry presentation, containing attractive visuals and photo spots for businesses to clearly express their messages. This template contains a variety of slides for the user to input data, such as structures to contrast two elements, bullet points, and slides for written information. Slidegeeks is prepared to create an impression.

 Home
Home