Meter Gauge
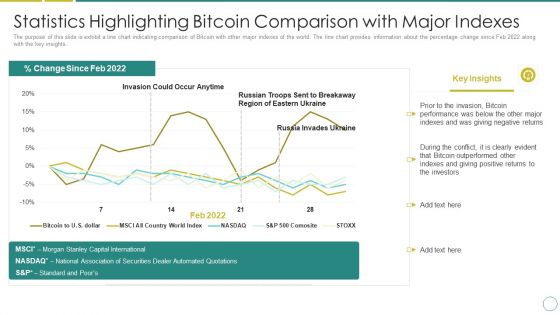
Russia Ukraine Statistics Highlighting Bitcoin Comparison With Major Indexes Mockup PDF
The purpose of this slide is exhibit a line chart indicating comparison of Bitcoin with other major indexes of the world. The line chart provides information about the percentage change since Feb 2022 along with the key insights. Deliver an awe inspiring pitch with this creative russia ukraine statistics highlighting bitcoin comparison with major indexes mockup pdf bundle. Topics like invasion could occur anytime, russia invades ukraine, bitcoin performance can be discussed with this completely editable template. It is available for immediate download depending on the needs and requirements of the user.
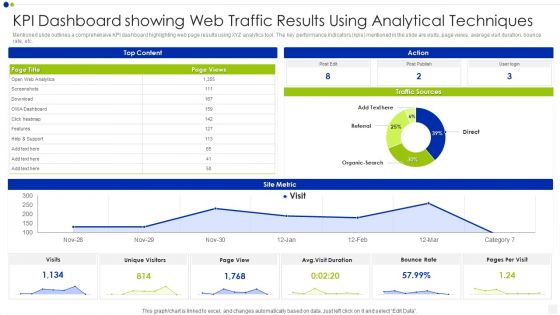
KPI Dashboard Showing Web Traffic Results Using Analytical Techniques Inspiration PDF
Mentioned slide outlines a comprehensive KPI dashboard highlighting web page results using XYZ analytics tool. The key performance indicators kpis mentioned in the slide are visits, page views, average visit duration, bounce rate, etc. Pitch your topic with ease and precision using this kpi dashboard showing web traffic results using analytical techniques inspiration pdf. This layout presents information on bounce rate, traffic sources, analytics. It is also available for immediate download and adjustment. So, changes can be made in the color, design, graphics or any other component to create a unique layout.

Project Management Professional Guide IT Key Facts And Figures About Active PMP Certificate Holders Brochure PDF
Following slide portrays key facts and figures of active project management professional PMP certificate holders. Here the graph indicates that there are currently 916,621 active PMP certificate holders.Deliver an awe inspiring pitch with this creative project management professional guide it key facts and figures about active pmp certificate holders brochure pdf bundle. Topics like key facts and figures about active pmp certificate holders can be discussed with this completely editable template. It is available for immediate download depending on the needs and requirements of the user.
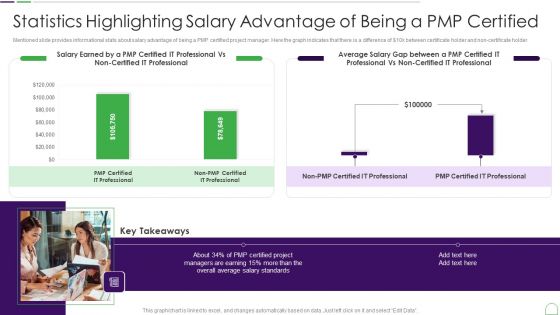
Project Management Professional Guide IT Statistics Highlighting Salary Advantage Portrait PDF
Mentioned slide provides informational stats about salary advantage of being a PMP certified project manager. Here the graph indicates that there is a difference of dollar10k between certificate holder and non certificate holder.Deliver and pitch your topic in the best possible manner with this project management professional guide it statistics highlighting salary advantage portrait pdf Use them to share invaluable insights on statistics highlighting salary advantage of being a pmp certified and impress your audience. This template can be altered and modified as per your expectations. So, grab it now.
Project Management Professional Guide IT Stats Showing Number Of Job Opportunities Icons PDF
This slide provides informational statistics about number of job opportunities for project manager roles by the year 2020. Here the graph indicates that most of the job opportunities for PM role will be in China.Deliver an awe inspiring pitch with this creative project management professional guide it stats showing number of job opportunities icons pdf bundle. Topics like stats showing number of job opportunities for project manager roles by 2020 can be discussed with this completely editable template. It is available for immediate download depending on the needs and requirements of the user.
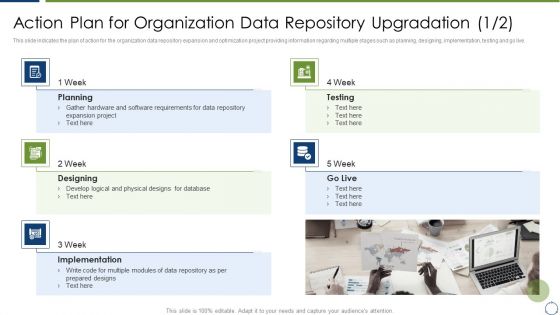
Action Plan For Organization Data Repository Upgradation Ideas PDF
This slide indicates the plan of action for the organization data repository expansion and optimization project providing information regarding multiple stages such as planning, designing, implementation, testing and go live.This is a Action Plan For Organization Data Repository Upgradation Ideas PDF template with various stages. Focus and dispense information on five stages using this creative set, that comes with editable features. It contains large content boxes to add your information on topics like Implementation, Designing, Planning You can also showcase facts, figures, and other relevant content using this PPT layout. Grab it now.

Horizontal Scaling Technique For Information Data Repository Expansion Strategy Selection Summary PDF
This slide indicates the merits of scaled out strategy for data repository expansion such as less costly, supports distributed computing, provides more flexibility etc.This is a Horizontal Scaling Technique For Information Data Repository Expansion Strategy Selection Summary PDF template with various stages. Focus and dispense information on four stages using this creative set, that comes with editable features. It contains large content boxes to add your information on topics like Supports Distributed Computing, Provides More Flexibility, Less Costly You can also showcase facts, figures, and other relevant content using this PPT layout. Grab it now.

Horizontal Scaling Technique For Information Data Repository Expansion Impact Demonstration PDF
This slide indicates the impact that data repository expansion will have on business operations such as more storage, faster query resolution, more transparency, improved predictions, etc.This is a Horizontal Scaling Technique For Information Data Repository Expansion Impact Demonstration PDF template with various stages. Focus and dispense information on five stages using this creative set, that comes with editable features. It contains large content boxes to add your information on topics like Faster Query Resolution, More Transparency, Improved Predictions You can also showcase facts, figures, and other relevant content using this PPT layout. Grab it now.
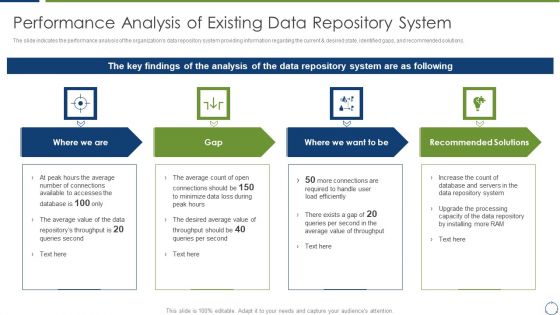
Horizontal Scaling Technique For Information Performance Analysis Of Existing Data Repository System Demonstration PDF
The slide indicates the performance analysis of the organizations data repository system providing information regarding the current and desired state, identified gaps, and recommended solutions.Presenting Horizontal Scaling Technique For Information Performance Analysis Of Existing Data Repository System Demonstration PDF to provide visual cues and insights. Share and navigate important information on five stages that need your due attention. This template can be used to pitch topics like Available To Accesses, Average Value Of Throughput, Recommended Solutions In addtion, this PPT design contains high resolution images, graphics, etc, that are easily editable and available for immediate download.

Five Year Comparison Of Registered Mobile Money Customers Spread By Region Graphics PDF
This slide shows the information statistics about region wise registered mobile money customers spread during last 5 years. It indicates that customers spread in South Asia recorded highest that is 28.4 percentage over the last five years. Deliver an awe inspiring pitch with this creative Five Year Comparison Of Registered Mobile Money Customers Spread By Region Graphics PDF bundle. Topics like Five Year Comparison Of Registered Mobile Money Customers Spread By Region can be discussed with this completely editable template. It is available for immediate download depending on the needs and requirements of the user.

Introducing A New Product To The Market Domestic Market Share Of The Firm Download PDF
This slide demonstrates companys market share in domestic market along with its competitors. It indicates that there is a decline of 5persent in the total share of the company in domestic market.Deliver an awe inspiring pitch with this creative Introducing A New Product To The Market Domestic Market Share Of The Firm Download PDF bundle. Topics like Domestic Market Share Of The Firm can be discussed with this completely editable template. It is available for immediate download depending on the needs and requirements of the user.
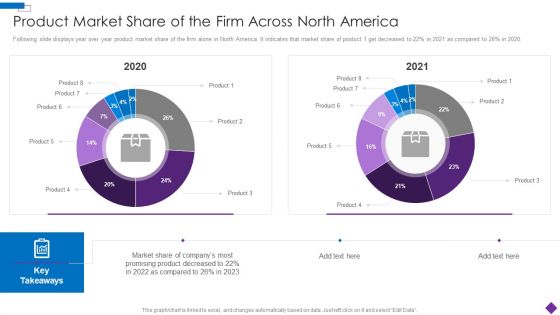
Introducing A New Product To The Market Product Market Share Of The Firm Across North America Structure PDF
Following slide displays year over year product market share of the firm alone in North America. It indicates that market share of product 1 get decreased to 22persent in 2021 as compared to 26persent in 2020.Deliver and pitch your topic in the best possible manner with this Introducing A New Product To The Market Product Market Share Of The Firm Across North America Structure PDF Use them to share invaluable insights on Product Market Share Of The Firm Across North America and impress your audience. This template can be altered and modified as per your expectations. So, grab it now.
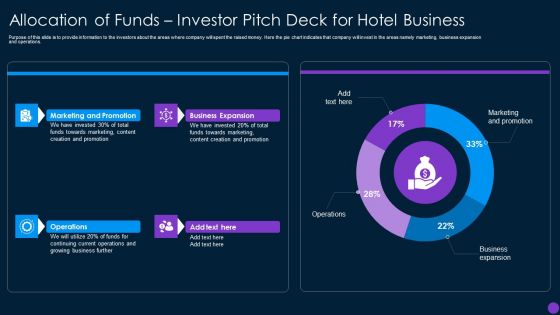
Allocation Of Funds Investor Pitch Deck For Hotel Business Graphics PDF
Purpose of this slide is to provide information to the investors about the areas where company will spent the raised money. Here the pie chart indicates that company will invest in the areas namely marketing, business expansion Deliver an awe inspiring pitch with this creative Allocation Of Funds Investor Pitch Deck For Hotel Business Graphics PDF bundle. Topics like Marketing And Promotion, Operations, Business Expansion can be discussed with this completely editable template. It is available for immediate download depending on the needs and requirements of the user.
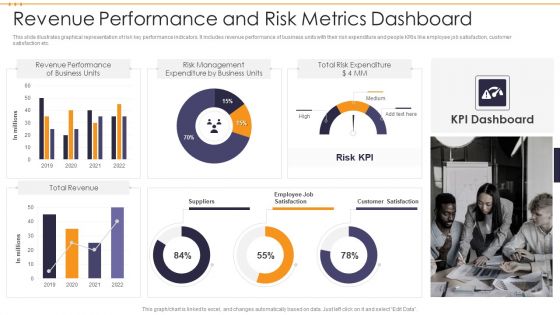
Revenue Performance And Risk Metrics Dashboard Demonstration PDF
This slide illustrates graphical representation of risk key performance indicators. It includes revenue performance of business units with their risk expenditure and people KRIs like employee job satisfaction, customer satisfaction etc. Showcasing this set of slides titled Revenue Performance And Risk Metrics Dashboard Demonstration PDF. The topics addressed in these templates are Total Risk Expenditure, Risk Management, Revenue Performance . All the content presented in this PPT design is completely editable. Download it and make adjustments in color, background, font etc. as per your unique business setting.
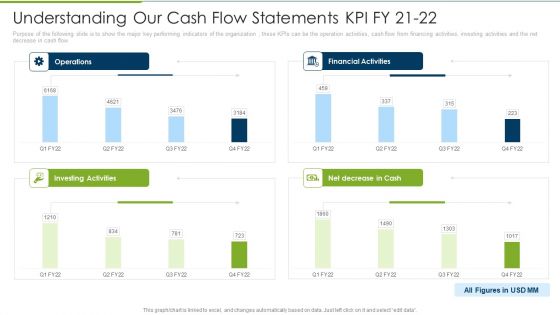
Debt Collection Improvement Plan Understanding Our Cash Flow Statements KPI Fy 21 To 22 Elements PDF
Purpose of the following slide is to show the major key performing indicators of the organization , these KPIs can be the operation activities, cash flow from financing activities, investing activities and the net decrease in cash flow. Deliver and pitch your topic in the best possible manner with this debt collection improvement plan understanding our cash flow statements kpi fy 21 to 22 elements pdf. Use them to share invaluable insights on operations, financial activities, investing activities, net decrease cash and impress your audience. This template can be altered and modified as per your expectations. So, grab it now.

Monthly Employee Performance Review Report Form Sample PDF
The following slide outlines a comprehensive report form which can be used by the manager to review the employee performance on a monthly basis. It covers information about key performance indicators KPIs, description, total and actual score, and action plan. Pitch your topic with ease and precision using this Monthly Employee Performance Review Report Form Sample PDF. This layout presents information on Teamwork, Work Ethics, Work Efficiency. It is also available for immediate download and adjustment. So, changes can be made in the color, design, graphics or any other component to create a unique layout.

Process For Setting A Cloud Migration Strategy Introduction PDF
This slide shows the flowchart for setting up a cloud migration strategy. It consists of steps like constructing a architect role, selecting the integration level for cloud, choosing the cloud vendor, setting up key performance indicators etc.Presenting Process For Setting A Cloud Migration Strategy Introduction PDF to dispense important information. This template comprises ten stages. It also presents valuable insights into the topics including Required, Application, Resources. This is a completely customizable PowerPoint theme that can be put to use immediately. So, download it and address the topic impactfully.
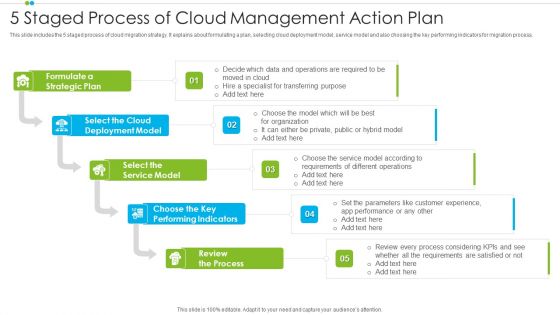
5 Staged Process Of Cloud Management Action Plan Formats PDF
This slide includes the 5 staged process of cloud migration strategy. It explains about formulating a plan, selecting cloud deployment model, service model and also choosing the key performing indicators for migration process.Persuade your audience using this 5 Staged Process Of Cloud Management Action Plan Formats PDF. This PPT design covers five stages, thus making it a great tool to use. It also caters to a variety of topics including Formulate A Strategic Plan, Select The Cloud Deployment Model, Select The Service Model . Download this PPT design now to present a convincing pitch that not only emphasizes the topic but also showcases your presentation skills.

KPI Dashboard To Measure Merchandising Product Plan Effectiveness Guidelines PDF
Mentioned slide outlines a comprehensive performance key performance indicator KPI dashboard which can be used to evaluate success rate of retail merchandising plan. It provides information about sales revenue, customers, average transaction price, average units per customer, sales by different cities, etc. Showcasing this set of slides titled KPI Dashboard To Measure Merchandising Product Plan Effectiveness Guidelines PDF. The topics addressed in these templates are Sales, Customers, Price. All the content presented in this PPT design is completely editable. Download it and make adjustments in color, background, font etc. as per your unique business setting.

Clinical Trials Phases With Discovery Science Themes PDF
This slide indicates the complete flow of the new drug testing process depicted via multiple steps. Also, the process steps are segmented into two categories i.e. discovery science and clinical trials for effective control over research.Presenting Clinical Trials Phases With Discovery Science Themes PDF to provide visual cues and insights. Share and navigate important information on six stages that need your due attention. This template can be used to pitch topics like Initial Research, Test Multiple Drug Doses On Animals, Increase Number Of Patients In addtion, this PPT design contains high resolution images, graphics, etc, that are easily editable and available for immediate download.
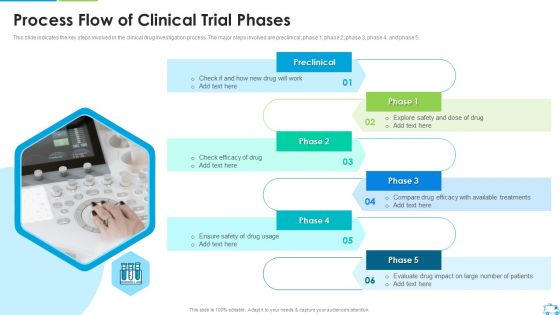
Process Flow Of Clinical Trial Phases Brochure PDF
This slide indicates the key steps involved in the clinical drug investigation process. The major steps involved are preclinical, phase 1, phase 2, phase 3, phase 4, and phase 5.Presenting Process Flow Of Clinical Trial Phases Brochure PDF to provide visual cues and insights. Share and navigate important information on six stages that need your due attention. This template can be used to pitch topics like Available Treatments, Evaluate Drug Impact, Compare Drug Efficacy In addtion, this PPT design contains high resolution images, graphics, etc, that are easily editable and available for immediate download.
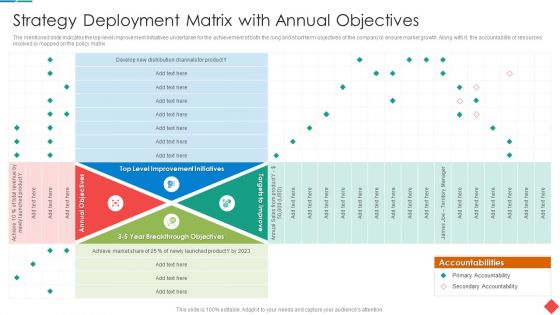
Strategy Deployment Matrix With Annual Objectives Professional PDF
The mentioned slide indicates the top level improvement initiatives undertaken for the achievement of both the long and short term objectives of the company to ensure market growth. Along with it, the accountability of resources involved is mapped on the policy matrix.Deliver an awe inspiring pitch with this creative Strategy Deployment Matrix With Annual Objectives Professional PDF bundle. Topics like Improvement Initiatives, Targets To Improve, Annual Objectives can be discussed with this completely editable template. It is available for immediate download depending on the needs and requirements of the user.
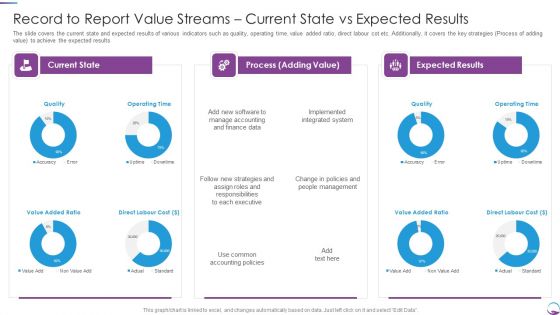
Record To Report Value Streams Current State Vs Expected Results Professional PDF
The slide covers the current state and expected results of various indicators such as quality, operating time, value added ratio, direct labour cot etc. Additionally, it covers the key strategies Process of adding value to achieve the expected results. Deliver and pitch your topic in the best possible manner with this Record To Report Value Streams Current State Vs Expected Results Professional PDF. Use them to share invaluable insights on Management, Strategies, Executive, Finance Data and impress your audience. This template can be altered and modified as per your expectations. So, grab it now.

Finance Transformation Program Checklist Related To Forecasting And Strategy Implementation Pictures PDF
The slide provides program checklist related to forecasting and strategy under finance transformation. The slide provides the key performance indicators revenue, operating profit, net profit, return on investment, data accuracy etc. and requirement of forecasting and strategy implementation for each KPI. Deliver and pitch your topic in the best possible manner with this Finance Transformation Program Checklist Related To Forecasting And Strategy Implementation Pictures PDF. Use them to share invaluable insights on Finance Transformation Program Checklist Related To Forecasting And Strategy Implementation and impress your audience. This template can be altered and modified as per your expectations. So, grab it now.

Summary Financial Record To Report Value Streams Current State Vs Expected Results Template PDF
The slide covers the current state and expected results of various indicators such as quality, operating time, value added ratio, direct labour cot etc. Additionally, it covers the key strategies Process of adding value to achieve the expected results. Deliver an awe inspiring pitch with this creative Summary Financial Record To Report Value Streams Current State Vs Expected Results Template PDF bundle. Topics like Current State, Process, Adding Value, Expected Results, Operating Time, Value Added Ratio can be discussed with this completely editable template. It is available for immediate download depending on the needs and requirements of the user.

Summary Financial Record To Report Value Streams Input Vs Output Guidelines PDF
The slide covers the current state and expected results of various indicators such as quality, operating time, value added ratio, direct labour cot etc. Additionally, it covers the key strategies Process of adding value to achieve the expected results. This is a Summary Financial Record To Report Value Streams Input Vs Output Guidelines PDF template with various stages. Focus and dispense information on three stages using this creative set, that comes with editable features. It contains large content boxes to add your information on topics like New System, Accounting Entries, Data Management, Assign Roles And Duties. You can also showcase facts, figures, and other relevant content using this PPT layout. Grab it now.

Summary Financial Sales And Profit Margin Analysis Dashboard Pictures PDF
This graph or chart is linked to excel, and changes automatically based on data. Just left click on it and select Edit Data. Deliver an awe inspiring pitch with this creative Summary Financial Sales And Profit Margin Analysis Dashboard Pictures PDF bundle. Topics like Net Profit, Past Year Vs Target Vs Actual, Net Profit Margin By Region, Channel, Expenses Breakdown, Costs And Expenses, Profitability Indicator Ratios can be discussed with this completely editable template. It is available for immediate download depending on the needs and requirements of the user.

Brand Development Manual Product Market Share Of The Firm Across North America Brochure PDF
Following slide displays year over year product market share of the firm alone in North America. It indicates that market share of product 1 get decreased to 22 persent in 2022 as compared to 26persent in 2021.Deliver and pitch your topic in the best possible manner with this Brand Development Manual Product Market Share Of The Firm Across North America Brochure PDF Use them to share invaluable insights on Product Market Share Of The Firm Across North America and impress your audience. This template can be altered and modified as per your expectations. So, grab it now.

Continuous Enhancement Strategy Kpis To Measure The Growth Of Operational Strategy Inspiration PDF
Purpose of the following slide is to show the KPIs or key performance indicators for measuring the progress of operational strategy. These KPIs can be customer satisfaction rate, net promoter score, Downtime etc. This is a Continuous Enhancement Strategy Kpis To Measure The Growth Of Operational Strategy Inspiration PDF template with various stages. Focus and dispense information on four stages using this creative set, that comes with editable features. It contains large content boxes to add your information on topics like Customer KPIs, Employee KPIs, Production KPIs, Customer Satisfaction rate. You can also showcase facts, figures, and other relevant content using this PPT layout. Grab it now.
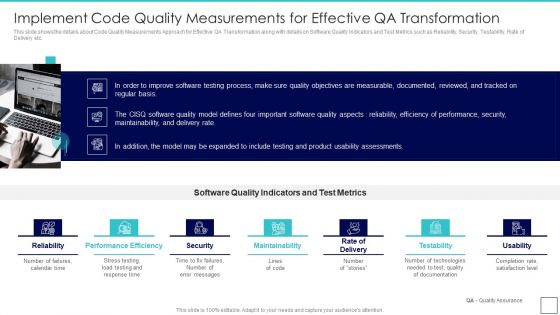
Deploying Quality Assurance QA Transformation Implement Code Quality Measurements Guidelines PDF
This slide shows the details about Code Quality Measurements Approach for Effective QA Transformation along with details on Software Quality Indicators and Test Metrics such as Reliability, Security, Testability, Rate of Delivery etc.This is a Deploying Quality Assurance QA Transformation Implement Code Quality Measurements Guidelines PDF template with various stages. Focus and dispense information on seven stages using this creative set, that comes with editable features. It contains large content boxes to add your information on topics like Performance Efficiency, Maintainability, Reliability You can also showcase facts, figures, and other relevant content using this PPT layout. Grab it now.
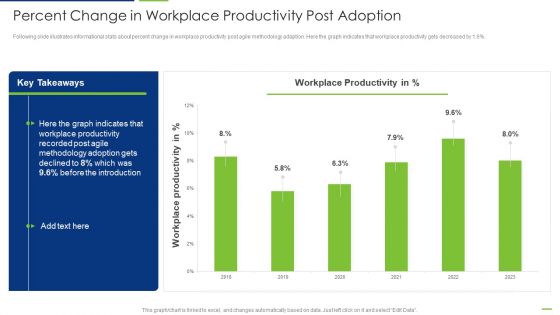
Professional Scrum Master Percent Change In Workplace Productivity Post Adoption Summary PDF
Following slide illustrates informational stats about percent change in workplace productivity post agile methodology adaption. Here the graph indicates that workplace productivity gets decreased by 1.6 percent. Deliver and pitch your topic in the best possible manner with this Professional Scrum Master Percent Change In Workplace Productivity Post Adoption Summary PDF. Use them to share invaluable insights on Workplace Productivity, 2018 To 2023, Agile Methodology and impress your audience. This template can be altered and modified as per your expectations. So, grab it now.
Change Management Plan For BI Solution Implementation BI Transformation Toolset Icons PDF
The following slide indicates the change management plan of business intelligence suite implementation. The plan is segmented into three phases i.e. prepare for change, manage the change and reinforce the change to ensure successful deployment of software. This is a Change Management Plan For BI Solution Implementation BI Transformation Toolset Icons PDF template with various stages. Focus and dispense information on three stages using this creative set, that comes with editable features. It contains large content boxes to add your information on topics like System, Potential, Risks, Sources. You can also showcase facts, figures, and other relevant content using this PPT layout. Grab it now.

Business Intelligence Solution Success Criteria BI Transformation Toolset Summary PDF
The following slide indicates the factors that ensure the worth of the BI suite in order to achieve business objectives. The key parameters are report relevance, data quality and speed of report delivery. Presenting Business Intelligence Solution Success Criteria BI Transformation Toolset Summary PDF to provide visual cues and insights. Share and navigate important information on five stages that need your due attention. This template can be used to pitch topics like Data Quality, Interactivity, Report Relevance, Speed Of Report Delivery, Security. In addtion, this PPT design contains high resolution images, graphics, etc, that are easily editable and available for immediate download.
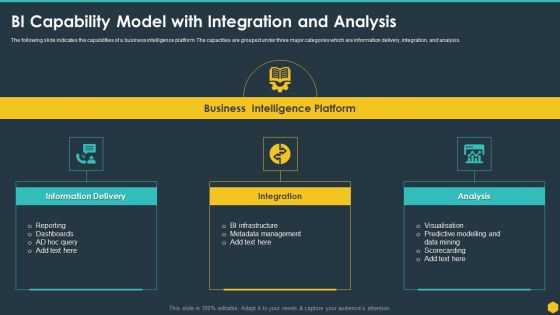
BI Capability Model With Integration And Analysis BI Transformation Toolset Background PDF
The following slide indicates the capabilities of a business intelligence platform. The capacities are grouped under three major categories which are information delivery, integration, and analysis. Presenting BI Capability Model With Integration And Analysis BI Transformation Toolset Background PDF to provide visual cues and insights. Share and navigate important information on three stages that need your due attention. This template can be used to pitch topics like Information Delivery, Integration, Analysis, Management. In addtion, this PPT design contains high resolution images, graphics, etc, that are easily editable and available for immediate download.

BI Capacity Model With Tools And Technologies BI Transformation Toolset Guidelines PDF
The following slide indicates the business intelligence capabilities along with key tools. It also provides information on vendor selection for maximum return on investment. This is a BI Capacity Model With Tools And Technologies BI Transformation Toolset Guidelines PDF template with various stages. Focus and dispense information on four stages using this creative set, that comes with editable features. It contains large content boxes to add your information on topics like Data Warehousing, Data Mining, Environmental Scanning, Digital Dashboards. You can also showcase facts, figures, and other relevant content using this PPT layout. Grab it now.

BI Project Plan With Activities Timeline BI Transformation Toolset Graphics PDF
The following slide indicates the weekly plan of the business intelligence project. It provides information pertaining to multiple activities along with time dedicated for the completion of each activity. Presenting BI Project Plan With Activities Timeline BI Transformation Toolset Graphics PDF to provide visual cues and insights. Share and navigate important information on four stages that need your due attention. This template can be used to pitch topics like Determine, Information, Implement, Warehouse. In addtion, this PPT design contains high resolution images, graphics, etc, that are easily editable and available for immediate download.

Multilayer Business Intelligence Capacity Model BI Transformation Toolset Inspiration PDF
This slide shows the capacity model to indicate the value obtained from the BI suite implementation in the organization. The key constituents of the model are data, analytics, collaboration, and dissemination. Deliver and pitch your topic in the best possible manner with this Multilayer Business Intelligence Capacity Model BI Transformation Toolset Inspiration PDF. Use them to share invaluable insights on Analysis, Data Cleansing, Big Data, Customers, Supply Chain and impress your audience. This template can be altered and modified as per your expectations. So, grab it now.
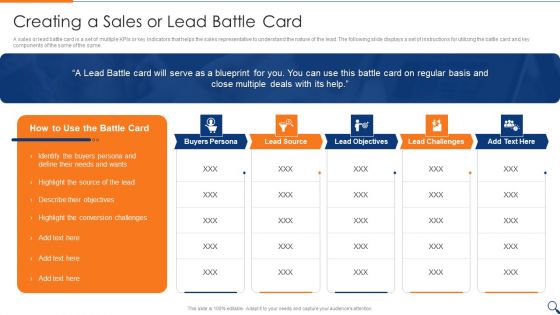
Sales Representative Onboarding Playbook Creating A Sales Or Lead Battle Card Clipart PDF
A sales or lead battle card is a set of multiple KPIs or key indicators that helps the sales representative to understand the nature of the lead. The following slide displays a set of instructions for utilizing the battle card and key components of the same of the same. Deliver an awe inspiring pitch with this creative Sales Representative Onboarding Playbook Creating A Sales Or Lead Battle Card Clipart PDF bundle. Topics like Creating A Sales Or Lead Battle Card can be discussed with this completely editable template. It is available for immediate download depending on the needs and requirements of the user.
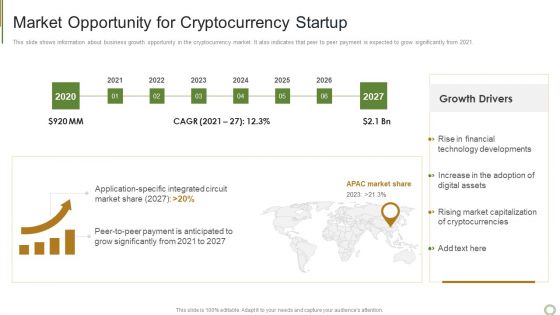
Market Opportunity For Cryptocurrency Startup Structure PDF
This slide shows information about business growth opportunity in the cryptocurrency market. It also indicates that peer to peer payment is expected to grow significantly from 2021.Presenting Market Opportunity For Cryptocurrency Startup Structure PDF to provide visual cues and insights. Share and navigate important information on one stage that need your due attention. This template can be used to pitch topics like Technology Developments, Increase In The Adoption, Capitalization Of Cryptocurrencies In addtion, this PPT design contains high resolution images, graphics, etc, that are easily editable and available for immediate download.
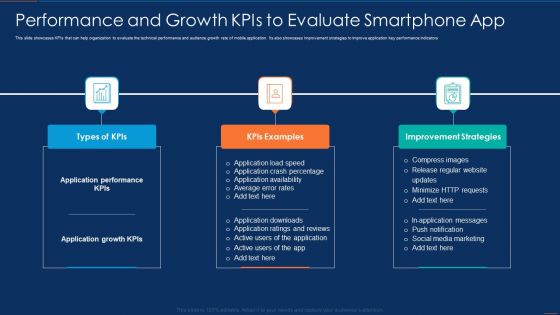
Performance And Growth Kpis To Evaluate Smartphone App Portrait PDF
This slide showcases KPIs that can help organization to evaluate the technical performance and audience growth rate of mobile application. Its also showcases improvement strategies to improve application key performance indicators Presenting Performance And Growth Kpis To Evaluate Smartphone App Portrait PDF to dispense important information. This template comprises three stages. It also presents valuable insights into the topics including Application, Average, Rates. This is a completely customizable PowerPoint theme that can be put to use immediately. So, download it and address the topic impactfully.

Bar Graph Representing Macroeconomic Analysis Employment Change By Industry Background PDF
This slide focuses on the graphical presentation of macroeconomic indicator such as employment rate of different industries which includes service providing and goods producing industries which includes healthcare and social assistance, construction, manufacturing industry, etc. Pitch your topic with ease and precision using this Bar Graph Representing Macroeconomic Analysis Employment Change By Industry Background PDF. This layout presents information on Goods Producing, Service Providing, Financial, Business. It is also available for immediate download and adjustment. So, changes can be made in the color, design, graphics or any other component to create a unique layout.

Playbook For Staff Wellbeing Health And Fitness Program Overall Performance Summary Clipart PDF
Following slide highlights an employees overall performance summary after completing health and fitness program. Performance indicators covered in the slide are physical activity, sleep, stress management, water intake and emotions. Presenting Playbook For Staff Wellbeing Health And Fitness Program Overall Performance Summary Clipart PDF to provide visual cues and insights. Share and navigate important information onone stage that need your due attention. This template can be used to pitch topics like Health And Fitness Program Overall Performance Summary. In addtion, this PPT design contains high resolution images, graphics, etc, that are easily editable and available for immediate download.
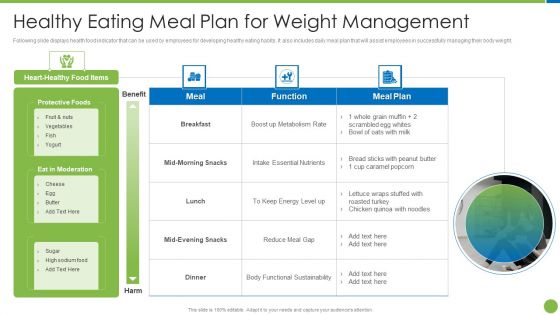
Playbook For Staff Wellbeing Healthy Eating Meal Plan For Weight Management Template PDF
Following slide displays health food indicator that can be used by employees for developing healthy eating habits. It also includes daily meal plan that will assist employees in successfully managing their body weight. Deliver and pitch your topic in the best possible manner with this Playbook For Staff Wellbeing Healthy Eating Meal Plan For Weight Management Template PDF Use them to share invaluable insights on Healthy Eating Meal Plan For Weight Management and impress your audience. This template can be altered and modified as per your expectations. So, grab it now.

Project QA Through Agile Methodology IT Forecasted Impact Of Adopting Agile Model Microsoft PDF
Mentioned slide portrays forecasted companys project success rate after adopting agile mode. Here the graph indicates that success rate will get increased to 73percent in 2023.Deliver an awe inspiring pitch with this creative Project QA Through Agile Methodology IT Forecasted Impact Of Adopting Agile Model Microsoft PDF bundle. Topics like Forecasted Impact Of Adopting Agile Model On The Success Rate Of Projects can be discussed with this completely editable template. It is available for immediate download depending on the needs and requirements of the user.
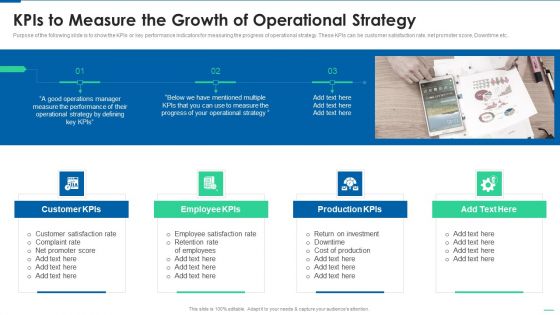
Six Sigma Continuous Process Kpis To Measure The Growth Of Operational Strategy Rules PDF
Purpose of the following slide is to show the KPIs or key performance indicators for measuring the progress of operational strategy. These KPIs can be customer satisfaction rate, net promoter score, Downtime etc. This is a Six Sigma Continuous Process Kpis To Measure The Growth Of Operational Strategy Rules PDF template with various stages. Focus and dispense information on four stages using this creative set, that comes with editable features. It contains large content boxes to add your information on topics like Customer KPIs, Employee KPIs, Production KPIs. You can also showcase facts, figures, and other relevant content using this PPT layout. Grab it now.
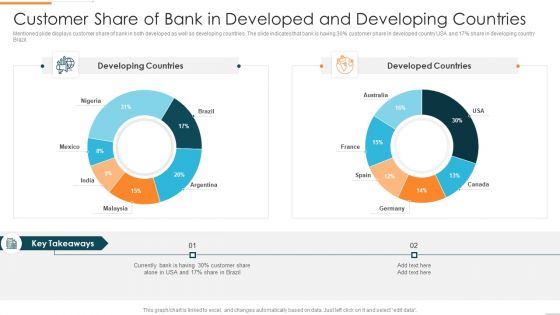
Enhanced Customer Banking Experience With Mobile Customer Share Of Bank In Developed Demonstration PDF
Mentioned slide displays customer share of bank in both developed as well as developing countries. The slide indicates that bank is having 30percent customer share in developed country USA and 17percent share in developing country Brazil.Deliver an awe inspiring pitch with this creative Enhanced Customer Banking Experience With Mobile Customer Share Of Bank In Developed Demonstration PDF bundle. Topics like Customer Share Of Bank In Developed And Developing Countries can be discussed with this completely editable template. It is available for immediate download depending on the needs and requirements of the user.

Enhanced Customer Banking Experience With Mobile Five Year Comparison Of Registered Mobile Background PDF
This slide shows the information statistics about region-wise registered mobile money customers spread during last 5 years. It indicates that customers spread in South Asia recorded highest that is 28.4percent over the last five years.Deliver an awe inspiring pitch with this creative Enhanced Customer Banking Experience With Mobile Five Year Comparison Of Registered Mobile Background PDF bundle. Topics like Five Year Comparison Of Registered Mobile Money Customers Spread By Region can be discussed with this completely editable template. It is available for immediate download depending on the needs and requirements of the user.
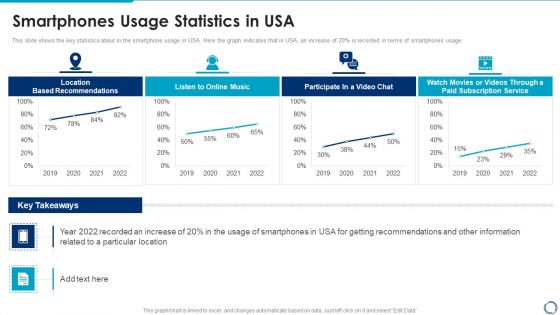
Location And Navigation Smartphones Usage Statistics In Usa Demonstration PDF
This slide shows the key statistics about in the smartphone usage in USA. Here the graph indicates that in USA, an increase of 20 percent is recorded in terms of smartphones usage. Deliver an awe inspiring pitch with this creative Location And Navigation Smartphones Usage Statistics In Usa Demonstration PDF bundle. Topics like Location Based Recommendations, Listen to Online Music, Participate In a Video Chat can be discussed with this completely editable template. It is available for immediate download depending on the needs and requirements of the user.
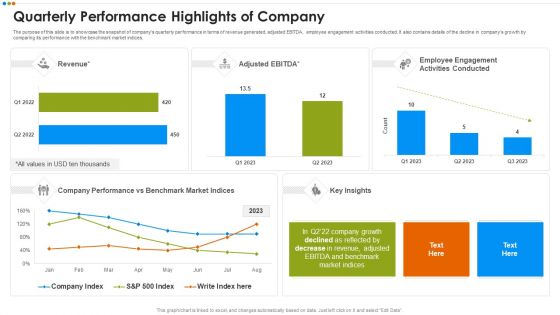
Quarterly Budget Analysis Of Business Organization Quarterly Performance Highlights Of Company Graphics PDF
The purpose of this slide is to showcase the snapshot of companys quarterly performance in terms of revenue generated, adjusted EBITDA, employee engagement activities conducted. It also contains details of the decline in companys growth by comparing its performance with the benchmark market indices.This is a Quarterly Budget Analysis Of Business Organization Quarterly Performance Highlights Of Company Graphics PDF template with various stages. Focus and dispense information on two stages using this creative set, that comes with editable features. It contains large content boxes to add your information on topics like Quarterly Performance Highlights Of Company You can also showcase facts, figures, and other relevant content using this PPT layout. Grab it now.

Utilisation Of Funds Restaurant Startup Pitch Deck Ideas PDF
Purpose of this slide is to provide information to the investors on how much money you have raised and spent. Here the pie chart indicates that company invested in marketing, technology and operations. Deliver and pitch your topic in the best possible manner with this Utilisation Of Funds Restaurant Startup Pitch Deck Ideas PDF. Use them to share invaluable insights on Marketing And Promotion, Tech Expansion, Operations and impress your audience. This template can be altered and modified as per your expectations. So, grab it now.
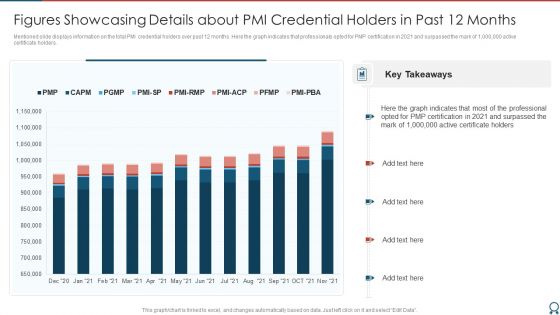
Agile Certified Professional Figures Showcasing Details About PMI Credential Holders Professional PDF
Mentioned slide displays information on the total PMI credential holders over past 12 months. Here the graph indicates that professionals opted for PMP certification in 2021 and surpassed the mark of 1,000,000 active certificate holders. Deliver an awe inspiring pitch with this creative Agile Certified Professional Figures Showcasing Details About PMI Credential Holders Professional PDF bundle. Topics like Certificate Holders, PMP Certification can be discussed with this completely editable template. It is available for immediate download depending on the needs and requirements of the user.

Agile Certified Professional Key Facts And Figures About PMI ACP Holders Ideas PDF
Following slide portrays key facts and figures of active PMI agile certified practitioner certificate holders. Here the slide indicates that average salary of PMI ACP certificate holders is dollar 123K per annum. Presenting Agile Certified Professional Key Facts And Figures About PMI ACP Holders Ideas PDF to provide visual cues and insights. Share and navigate important information on three stages that need your due attention. This template can be used to pitch topics like IT Agile Coach, Project Manager, Senior Project Manager. In addtion, this PPT design contains high resolution images, graphics, etc, that are easily editable and available for immediate download.
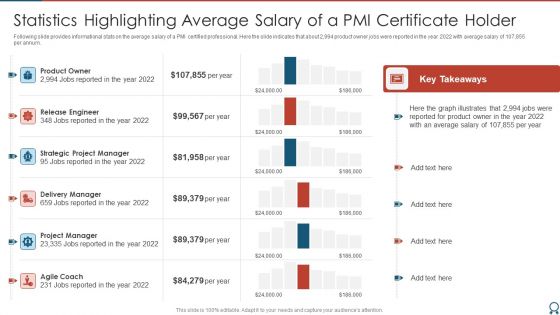
Agile Certified Professional Statistics Highlighting Average Salary Of A PMI Formats PDF
Following slide provides informational stats on the average salary of a PMI certified professional. Here the slide indicates that about 2,994 product owner jobs were reported in the year 2022 with average salary of 107,855 per annum. Deliver an awe inspiring pitch with this creative Agile Certified Professional Statistics Highlighting Average Salary Of A PMI Formats PDF bundle. Topics like Release Engineer, Product Owner, Strategic Project Manager can be discussed with this completely editable template. It is available for immediate download depending on the needs and requirements of the user.
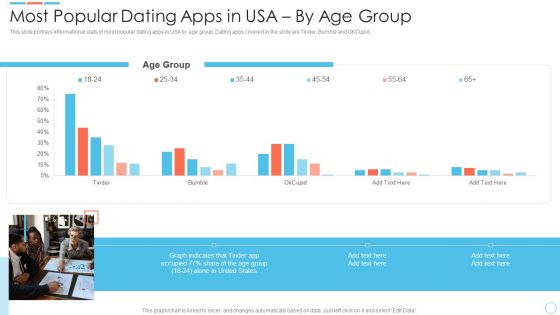
Elevator Online Dating Software Most Popular Dating Apps In USA By Age Group Introduction PDF
Elevator Online Dating Software Most Popular Dating Apps In USA By Audience Ideas PDFThis slide portrays informational stats of most popular dating apps in USA by age group. Dating apps covered in the slide are Tinder, Bumble and OKCupid. Deliver and pitch your topic in the best possible manner with this Elevator Online Dating Software Most Popular Dating Apps In USA By Age Group Introduction PDF. Use them to share invaluable insights on Age Group, Graph indicates and impress your audience. This template can be altered and modified as per your expectations. So, grab it now.

Smartwatch Firm Investment Pitch Deck Solutions Provided To The Customers By ABC Retail Business Rules PDF
This slide identifies the details of ABC retail companys smartwatch product. This includes details regarding ABC smartwatch and its features such as no radio frequencies, water resistant, type C charging cable, etc.Deliver an awe inspiring pitch with this creative Smartwatch Firm Investment Pitch Deck Solutions Provided To The Customers By ABC Retail Business Rules PDF bundle. Topics like Smartwatch Is Constructed, Provides A Precise Indicator, Features Three Replaceable can be discussed with this completely editable template. It is available for immediate download depending on the needs and requirements of the user.

Capital Raising Pitch Presentation Smartphones Usage Statistics In USA Pictures PDF
This slide shows the key statistics about in the smartphone usage in USA. Here the graph indicates that in USA, an increase of 20 percent is recorded in terms of smartphones usage. Deliver an awe inspiring pitch with this creative Capital Raising Pitch Presentation Smartphones Usage Statistics In USA Pictures PDF bundle. Topics like Location, Based Recommendations, Listen To Online Music, Participate Video Chat, 2018 To 2021 can be discussed with this completely editable template. It is available for immediate download depending on the needs and requirements of the user.

Why Is Agile Cost Effective IT Analyzing Current Otd Rate Of Projects Undertaken Brochure PDF
Following slide provides information about the on-time-delivery rate of the projects completed by the organization. Here the stats indicates that OTD rate of projects completed in H1 of 2020 was 75 Percent. Deliver and pitch your topic in the best possible manner with this Why Is Agile Cost Effective IT Analyzing Current Otd Rate Of Projects Undertaken Brochure PDF. Use them to share invaluable insights on Projects Undertaken, Delivery Date Promised, Actual Delivery Date and impress your audience. This template can be altered and modified as per your expectations. So, grab it now.
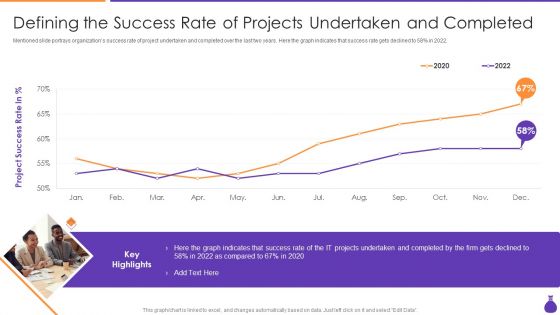
Why Is Agile Cost Effective IT Defining The Success Rate Of Projects Undertaken Mockup PDF
Mentioned slide portrays organizations success rate of project undertaken and completed over the last two years. Here the graph indicates that success rate gets declined to 58 percent in 2022. Deliver an awe inspiring pitch with this creative Why Is Agile Cost Effective IT Defining The Success Rate Of Projects Undertaken Mockup PDF bundle. Topics like Project Success Rate, IT Projects, 2020 To 2022 can be discussed with this completely editable template. It is available for immediate download depending on the needs and requirements of the user.
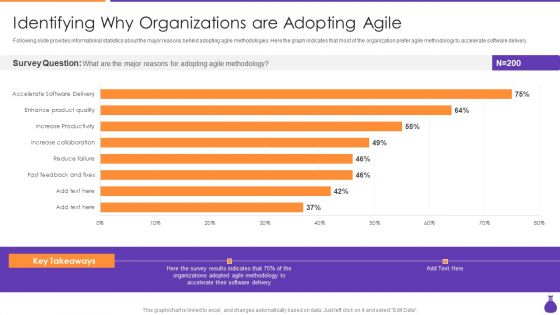
Why Is Agile Cost Effective IT Dentifying Why Organizations Are Adopting Agile Guidelines PDF
Following slide provides informational statistics about the major reasons behind adopting agile methodologies. Here the graph indicates that most of the organization prefer agile methodology to accelerate software delivery. Deliver an awe inspiring pitch with this creative Why Is Agile Cost Effective IT Dentifying Why Organizations Are Adopting Agile Guidelines PDF bundle. Topics like Survey Question, Adopting Agile Methodology, Fast Feedback And Fixes, Reduce Failure can be discussed with this completely editable template. It is available for immediate download depending on the needs and requirements of the user.

Why Is Agile Cost Effective IT Determining Current Resource Cost In Traditional Methodology Information PDF
This slide provide informational stats about the resource cost bear by the organization while using traditional methodology. Here the graph indicates that development stage is the most costlier among requirement, design and test stages. Deliver an awe inspiring pitch with this creative Why Is Agile Cost Effective IT Determining Current Resource Cost In Traditional Methodology Information PDF bundle. Topics like Requirement, Design, Development, Test can be discussed with this completely editable template. It is available for immediate download depending on the needs and requirements of the user.

 Home
Home