Matrix Chart
Dollar Note Icon With Chart Depicting Business Expenses Ppt PowerPoint Presentation Gallery Model PDF
Presenting dollar note icon with chart depicting business expenses ppt powerpoint presentation gallery model pdf to dispense important information. This template comprises three stages. It also presents valuable insights into the topics including dollar note icon with chart depicting business expenses. This is a completely customizable PowerPoint theme that can be put to use immediately. So, download it and address the topic impactfully.
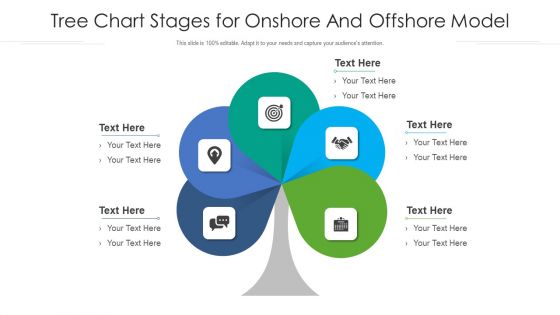
Tree Chart Stages For Onshore And Offshore Model Ppt PowerPoint Presentation File Show PDF
Presenting tree chart stages for onshore and offshore model ppt powerpoint presentation file show pdf to dispense important information. This template comprises five stages. It also presents valuable insights into the topics including tree chart stages for onshore and offshore model. This is a completely customizable PowerPoint theme that can be put to use immediately. So, download it and address the topic impactfully.

Benchmark Chart For Four Companies Ppt PowerPoint Presentation Layouts Model PDF
Pitch your topic with ease and precision using this benchmark chart for four companies ppt powerpoint presentation layouts model pdf. This layout presents information on benchmark chart for four companies. It is also available for immediate download and adjustment. So, changes can be made in the color, design, graphics or any other component to create a unique layout.
Data Analysis With Bar Chart In Magnifying Glass Vector Icon Ppt PowerPoint Presentation File Model PDF
Presenting this set of slides with name data analysis with bar chart in magnifying glass vector icon ppt powerpoint presentation file model pdf. This is a one stage process. The stages in this process is data analysis with bar chart in magnifying glass vector icon. This is a completely editable PowerPoint presentation and is available for immediate download. Download now and impress your audience.
Flow Chart With Circular Arrows Vector Icon Ppt PowerPoint Presentation File Model PDF
Presenting this set of slides with name flow chart with circular arrows vector icon ppt powerpoint presentation file model pdf. This is a two stage process. The stages in this process are flow chart with circular arrows vector icon. This is a completely editable PowerPoint presentation and is available for immediate download. Download now and impress your audience.
Data Assessment Chart With Arrow Vector Icon Ppt PowerPoint Presentation Model Design Inspiration PDF
Showcasing this set of slides titled data assessment chart with arrow vector icon ppt powerpoint presentation model design inspiration pdf. The topics addressed in these templates are data assessment chart with arrow vector icon. All the content presented in this PPT design is completely editable. Download it and make adjustments in color, background, font etc. as per your unique business setting.
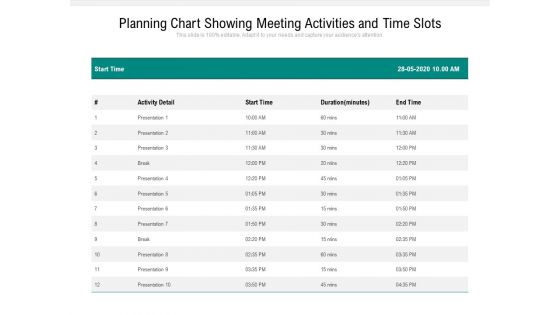
Planning Chart Showing Meeting Activities And Time Slots Ppt PowerPoint Presentation Slides Model PDF
Showcasing this set of slides titled planning chart showing meeting activities and time slots ppt powerpoint presentation slides model pdf. The topics addressed in these templates are activity detail, planning chart showing meeting activities and time. All the content presented in this PPT design is completely editable. Download it and make adjustments in color, background, font etc. as per your unique business setting.
Figure Chart Illustrating Monthly Customer Retention Data Ppt PowerPoint Presentation Icon Model PDF
Pitch your topic with ease and precision using this figure chart illustrating monthly customer retention data ppt powerpoint presentation icon model pdf. This layout presents information on figure chart illustrating monthly customer retention data. It is also available for immediate download and adjustment. So, changes can be made in the color, design, graphics or any other component to create a unique layout.

Prioritizing Project With A Scoring Model Project Prioritization Gantt Chart Ideas PDF
Presenting this set of slides with name prioritizing project with a scoring model project prioritization gantt chart ideas pdf. The topics discussed in these slide is project prioritization gantt chart. This is a completely editable PowerPoint presentation and is available for immediate download. Download now and impress your audience.
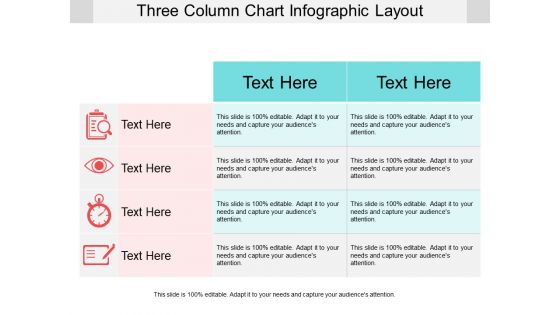
Three Column Chart Infographic Layout Ppt PowerPoint Presentation Model Portrait PDF
Presenting this set of slides with name three column chart infographic layout ppt powerpoint presentation model portrait pdf. The topics discussed in these slide is three column chart infographic layout. This is a completely editable PowerPoint presentation and is available for immediate download. Download now and impress your audience.
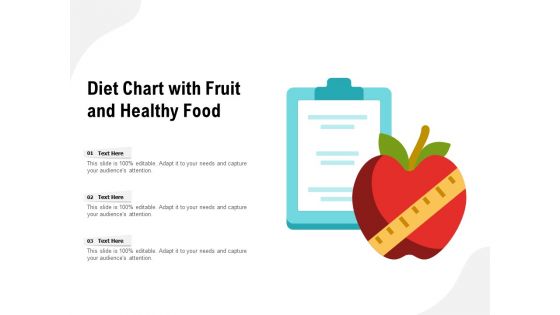
Diet Chart With Fruit And Healthy Food Ppt PowerPoint Presentation Infographic Template Model PDF
Showcasing this set of slides titled diet chart with fruit and healthy food ppt powerpoint presentation infographic template model pdf. The topics addressed in these templates are diet chart with fruit and healthy food. All the content presented in this PPT design is completely editable. Download it and make adjustments in color, background, font etc. as per your unique business setting.
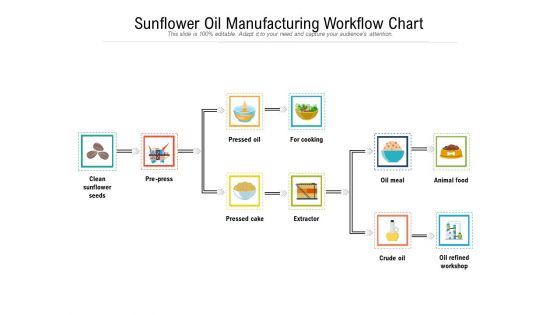
Sunflower Oil Manufacturing Workflow Chart Ppt PowerPoint Presentation Model Background Images PDF
Pitch your topic with ease and precision using this sunflower oil manufacturing workflow chart ppt powerpoint presentation model background images pdf. This layout presents information on sunflower oil manufacturing workflow chart. It is also available for immediate download and adjustment. So, changes can be made in the color, design, graphics or any other component to create a unique layout.
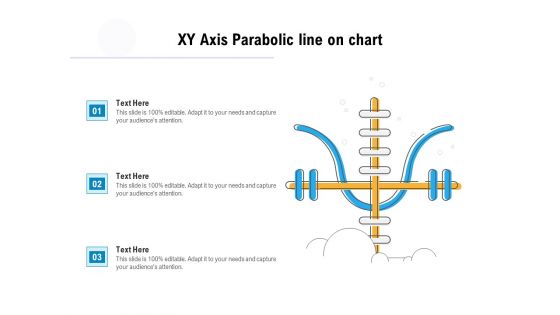
XY Axis Parabolic Line On Chart Ppt PowerPoint Presentation Model Background Image PDF
Pitch your topic with ease and precision using this xy axis parabolic line on chart ppt powerpoint presentation model background image pdf. This layout presents information on xy axis parabolic line on chart. It is also available for immediate download and adjustment. So, changes can be made in the color, design, graphics or any other component to create a unique layout.

Employee Presenting The Business Analytics Chart Ppt PowerPoint Presentation Model Layouts PDF
Pitch your topic with ease and precision using this employee presenting the business analytics chart ppt powerpoint presentation model layouts pdf. This layout presents information on employee presenting the business analytics chart. It is also available for immediate download and adjustment. So, changes can be made in the color, design, graphics or any other component to create a unique layout.

Consistent Way To Represent The Steps Tech Support Process Flow Chart PowerPoint Slides
We present our consistent way to represent the steps tech support process flow chart PowerPoint Slides.Use our Marketing PowerPoint Templates because, this slide can help to bullet point your views. Use our Success PowerPoint Templates because,Your quest has taken you well onto the path of success. Use our Business PowerPoint Templates because,You have secured a name for yourself in the domestic market. Now the time is right to spread your reach to other countries Use our Process and Flows PowerPoint Templates because, The plans are in your head, stage by stage, year by year. Use our Abstract PowerPoint Templates because,Your ideas are fundamentally stable with a broad base of workable possibilities.Use these PowerPoint slides for presentations relating to Abstract, Arrow, Arrows, Business, Chart, Design, Development, Diagram, Direction, Element, Flow, Flowchart, Graph, Linear, Management, Model, Motion, Organization, Plan, Process, Program, Section, Segment, Set, Sign, Solution, Strategy, Symbol, Technology. The prominent colors used in the PowerPoint template are Orange, Gray, White

Consistent Way To Represent The Steps Process Flow Chart PowerPoint Slides
We present our consistent way to represent the steps process flow chart PowerPoint Slides.Use our Marketing PowerPoint Templates because, Our Template designs are State of the Art. Use our Success PowerPoint Templates because,Your quest has taken you well onto the path of success. Use our Business PowerPoint Templates because, You can see clearly through to the bigger bowl ahead. Time your jump to perfection and hit the nail on the head Use our Process and Flows PowerPoint Templates because,There is a vision, a need you can meet. Use our Abstract PowerPoint Templates because,Honesty is the best policy has an ardent follower in you.Use these PowerPoint slides for presentations relating to Abstract, Arrow, Arrows, Business, Chart, Design, Development, Diagram, Direction, Element, Flow, Flowchart, Graph, Linear, Management, Model, Motion, Organization, Plan, Process, Program, Section, Segment, Set, Sign, Solution, Strategy, Symbol, Technology. The prominent colors used in the PowerPoint template are Red, Gray, White
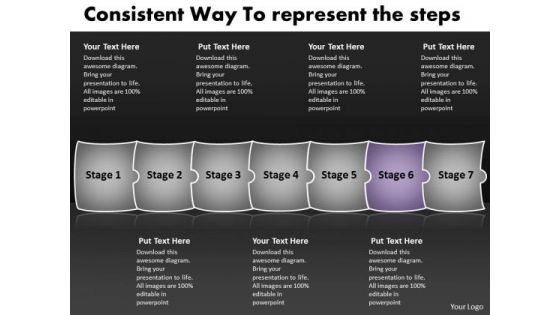
Consistent Way To Represent The Steps Flow Chart System PowerPoint Slides
We present our consistent way to represent the steps flow chart system PowerPoint Slides.Use our Marketing PowerPoint Templates because,This slide shows each path to the smallest detail. Use our Success PowerPoint Templates because,The fruit of your labour is about to ripen. Use our Business PowerPoint Templates because, Your ideas too are pinpointedly focused on you goals. Use our Process and Flows PowerPoint Templates because,you can Master them all and you have it made. Use our Abstract PowerPoint Templates because, It focuses the light on the path to sure shot success.Use these PowerPoint slides for presentations relating to Abstract, Arrow, Arrows, Business, Chart, Design, Development, Diagram, Direction, Element, Flow, Flowchart, Graph, Linear, Management, Model, Motion, Organization, Plan, Process, Program, Section, Segment, Set, Sign, Solution, Strategy, Symbol, Technology. The prominent colors used in the PowerPoint template are Purple, Gray, White
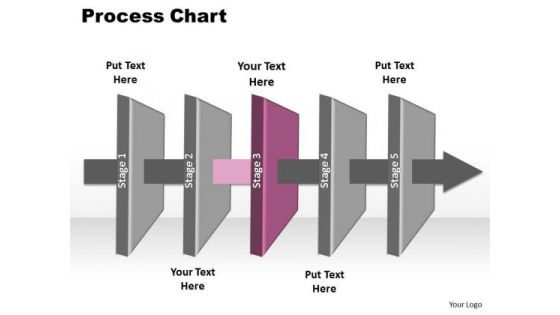
Ppt 5 Layers Internet Marketing PowerPoint Presentation Process Chart 3 Templates
PPT 5 layers internet marketing powerpoint presentation process chart 3 Templates-This PowerPoint Diagram shows you the 3d Horizontal Illustration to explain Internet Marketing. It consists of Five Layers explaining third here. It imitates advertise, barter, display, exchange, merchandise, offer for sale, retail, vend, wholesale etc.-PPT 5 layers internet marketing powerpoint presentation process chart 3 Templates-abstract, arrow, arrow chart, block, business, chart, color, connection, design, development, diagram, direction, element, flow, linear, management, model, motion, organization, plan, process, program, section, segment, set, sign, solution, strategy, symbol, technology, vector

Procedure To Establish Project Administration Program RACI Chart Showing Responsibilities Of Project Team Elements PDF
This slide covers the RACI chart that shows responsibilities of project team members such as initiation, planning, execution, controlling and closing respective to each role. Slidegeeks is here to make your presentations a breeze with Procedure To Establish Project Administration Program RACI Chart Showing Responsibilities Of Project Team Elements PDF With our easy to use and customizable templates, you can focus on delivering your ideas rather than worrying about formatting. With a variety of designs to choose from, you are sure to find one that suits your needs. And with animations and unique photos, illustrations, and fonts, you can make your presentation pop. So whether you are giving a sales pitch or presenting to the board, make sure to check out Slidegeeks first.

Business Model Diagram Examples 3d Man Presenting Chart PowerPoint Theme Slides
We present our business model diagram examples 3d man presenting chart powerpoint theme Slides.Download and present our Business PowerPoint Templates because They will bring a lot to the table. Their alluring flavours will make your audience salivate. Download our Finance PowerPoint Templates because Our PowerPoint Templates and Slides will bullet point your ideas. See them fall into place one by one. Use our People PowerPoint Templates because Our PowerPoint Templates and Slides will let your team Walk through your plans. See their energy levels rise as you show them the way. Use our Marketing PowerPoint Templates because You are well armed with penetrative ideas. Our PowerPoint Templates and Slides will provide the gunpowder you need. Download our Success PowerPoint Templates because Our PowerPoint Templates and Slides are Clear and concise. Use them and dispel any doubts your team may have.Use these PowerPoint slides for presentations relating to 3d, arrow, business, businessman, cartoon, character, chart, concept, corporate, data, development, diagram, display, figure, finance, financial, graph, graphic, green, growth, guy, human, icon, idea, illustration, information, investment, isolated, market, marketing, men, office, part, people, person, pie, presentation, professional, progress, red, reflection, report, shape, shiny, sign, slice, statistic, success, white. The prominent colors used in the PowerPoint template are Green, Red, Blue. Professionals tell us our business model diagram examples 3d man presenting chart powerpoint theme Slides are readymade to fit into any presentation structure. Use our concept PowerPoint templates and PPT Slides are designed by professionals Use our business model diagram examples 3d man presenting chart powerpoint theme Slides will impress their bosses and teams. Customers tell us our corporate PowerPoint templates and PPT Slides are topically designed to provide an attractive backdrop to any subject. Presenters tell us our business model diagram examples 3d man presenting chart powerpoint theme Slides look good visually. People tell us our concept PowerPoint templates and PPT Slides will save the presenter time.
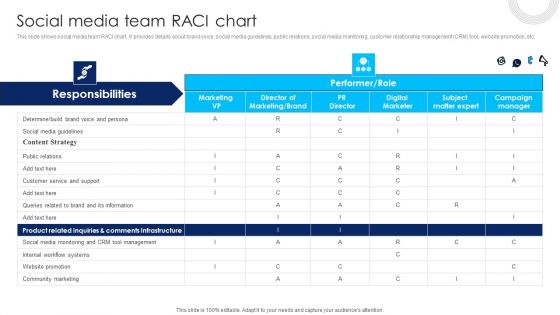
Using Social Media Platforms To Enhance Social Media Team Raci Chart Background PDF
This slide shows social media team RACI chart. It provides details about brand voice, social media guidelines, public relations, social media monitoring, customer relationship management CRM tool, website promotion, etc. Do you have to make sure that everyone on your team knows about any specific topic I yes, then you should give Using Social Media Platforms To Enhance Social Media Team Raci Chart Background PDF a try. Our experts have put a lot of knowledge and effort into creating this impeccable Using Social Media Platforms To Enhance Social Media Team Raci Chart Background PDF. You can use this template for your upcoming presentations, as the slides are perfect to represent even the tiniest detail. You can download these templates from the Slidegeeks website and these are easy to edit. So grab these today.
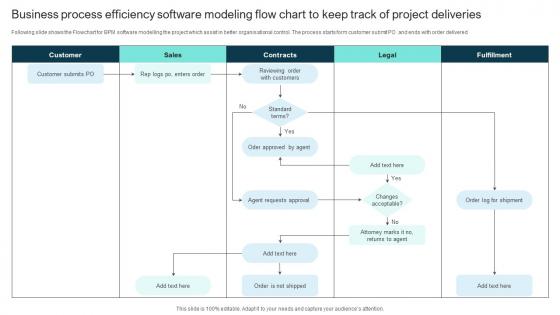
Business Process Efficiency Software Modeling Flow Chart To Keep Track Of Project Deliveries Template Pdf
Following slide shows the Flowchart for BPM software modelling the project which assist in better organisational control. The process starts form customer submit PO and ends with order delivered Showcasing this set of slides titled Business Process Efficiency Software Modeling Flow Chart To Keep Track Of Project Deliveries Template Pdf The topics addressed in these templates are Customer Submits, Business Process, Efficiency Software All the content presented in this PPT design is completely editable. Download it and make adjustments in color, background, font etc. as per your unique business setting.

Integrating Social Media Tactics Social Media Team Raci Chart Clipart PDF
This slide shows social media team RACI chart. It provides details about brand voice, social media guidelines, public relations, social media monitoring, customer relationship management CRM tool, website promotion, etc. Deliver and pitch your topic in the best possible manner with this Integrating Social Media Tactics Social Media Team Raci Chart Clipart PDF. Use them to share invaluable insights on Contents Strategy, Customer Service, Community Marketing and impress your audience. This template can be altered and modified as per your expectations. So, grab it now.
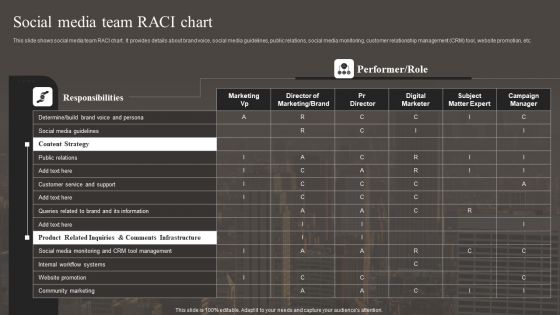
Social Media Team RACI Chart Implementing Social Media Marketing Strategy Clipart PDF
This slide shows social media team RACI chart. It provides details about brand voice, social media guidelines, public relations, social media monitoring, customer relationship management CRM tool, website promotion, etc. Deliver and pitch your topic in the best possible manner with this Social Media Team RACI Chart Implementing Social Media Marketing Strategy Clipart PDF. Use them to share invaluable insights on Content Strategy, Product Related Inquiries, Customer Service And Support and impress your audience. This template can be altered and modified as per your expectations. So, grab it now.
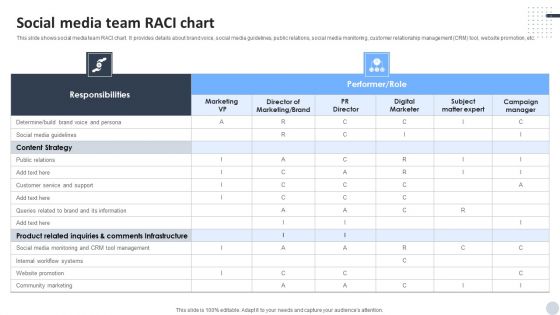
Social Media Marketing Strategies To Generate Lead Social Media Team Raci Chart Demonstration PDF
This slide shows social media team RACI chart. It provides details about brand voice, social media guidelines, public relations, social media monitoring, customer relationship management CRM tool, website promotion, etc. There are so many reasons you need a Social Media Marketing Strategies To Generate Lead Social Media Team Raci Chart Demonstration PDF. The first reason is you can not spend time making everything from scratch, Thus, Slidegeeks has made presentation templates for you too. You can easily download these templates from our website easily.

Figure Chart Illustrating Product Features Comparison Ppt PowerPoint Presentation Gallery Guidelines PDF
Pitch your topic with ease and precision using this figure chart illustrating monthly customer retention data ppt powerpoint presentation icon model pdf. This layout presents information on figure chart illustrating product features comparison. It is also available for immediate download and adjustment. So, changes can be made in the color, design, graphics or any other component to create a unique layout.

Business Model Strategy 3d Team Meeting Around Pie Chart Character Models
Touch Base With Our Business Model Strategy 3d Team Meeting Around Pie Chart Character Models Powerpoint Templates. Review Your Growth With Your Audience. Take A Deep Dive With Our leadership Powerpoint Templates. Get Into The Nitti Gritty Of It All.
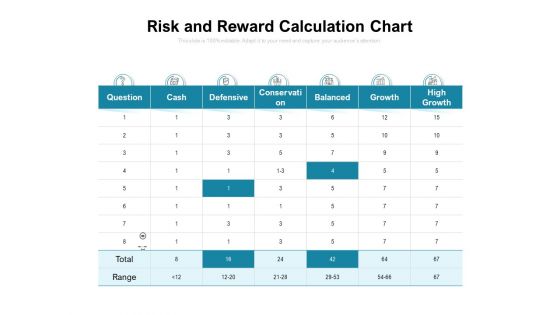
Risk And Reward Calculation Chart Ppt PowerPoint Presentation Styles Graphics Pictures PDF
Presenting this set of slides with name risk and reward calculation chart ppt powerpoint presentation styles graphics pictures pdf. The topics discussed in these slides are cash, defensive, conservative, balanced, growth, high growth. This is a completely editable PowerPoint presentation and is available for immediate download. Download now and impress your audience.
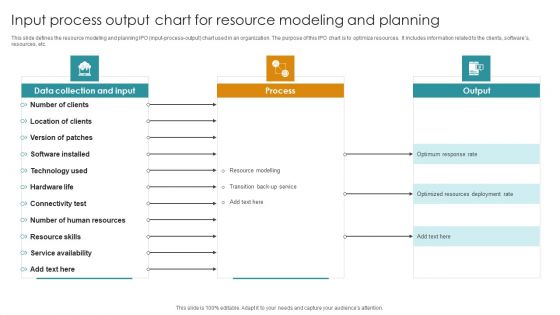
Input Process Output Chart For Resource Modeling And Planning Background PDF
This slide defines the resource modeling and planning IPO input-process-output chart used in an organization. The purpose of this IPO chart is to optimize resources. It includes information related to the clients, softwares, resources, etc. Showcasing this set of slides titled Input Process Output Chart For Resource Modeling And Planning Background PDF. The topics addressed in these templates are Data Collection And Input, Process, Output. All the content presented in this PPT design is completely editable. Download it and make adjustments in color, background, font etc. as per your unique business setting.
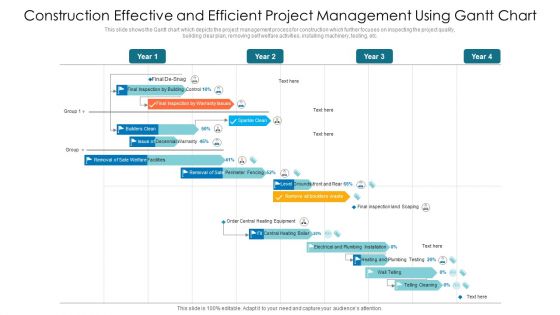
Construction Effective And Efficient Project Management Using Gantt Chart Ppt PowerPoint Presentation File Model PDF
This slide shows the Gantt chart which depicts the project management process for construction which further focuses on inspecting the project quality, building clear plan, removing self welfare activities, installing machinery, testing, etc. Showcasing this set of slides titled construction effective and efficient project management using gantt chart ppt powerpoint presentation file model pdf. The topics addressed in these templates are construction effective and efficient project management using gantt chart. All the content presented in this PPT design is completely editable. Download it and make adjustments in color, background, font etc. as per your unique business setting.
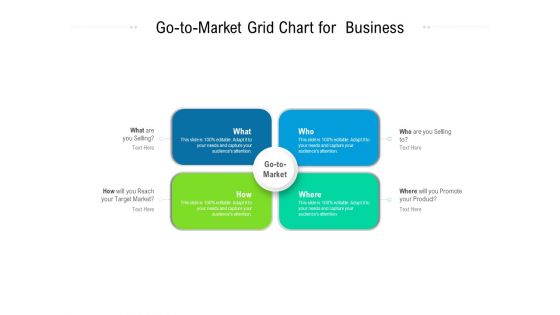
Go To Market Grid Chart For Business Ppt PowerPoint Presentation Gallery Template PDF
Persuade your audience using this go to market grid chart for business ppt powerpoint presentation gallery template pdf. This PPT design covers four stages, thus making it a great tool to use. It also caters to a variety of topics including go to market grid chart for business. Download this PPT design now to present a convincing pitch that not only emphasizes the topic but also showcases your presentation skills.
Statistical Analysis Icon With Chart And Gear On Computer Screen Ppt PowerPoint Presentation File Grid PDF
Presenting statistical analysis icon with chart and gear on computer screen ppt powerpoint presentation file grid pdf to dispense important information. This template comprises three stages. It also presents valuable insights into the topics including statistical analysis icon with chart and gear on computer screen. This is a completely customizable PowerPoint theme that can be put to use immediately. So, download it and address the topic impactfully.
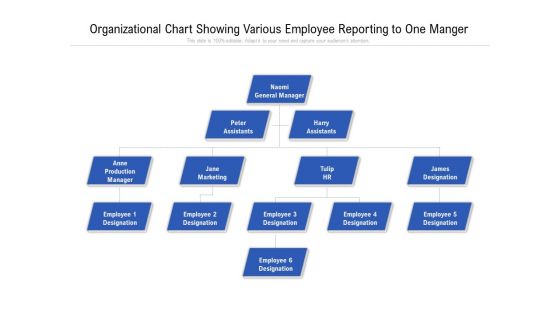
Organizational Chart Showing Various Employee Reporting To One Manger Ppt PowerPoint Presentation File Grid PDF
Persuade your audience using this organizational chart showing various employee reporting to one manger ppt powerpoint presentation file grid pdf. This PPT design covers four stages, thus making it a great tool to use. It also caters to a variety of topics including organizational chart showing various employee reporting to one manger. Download this PPT design now to present a convincing pitch that not only emphasizes the topic but also showcases your presentation skills.
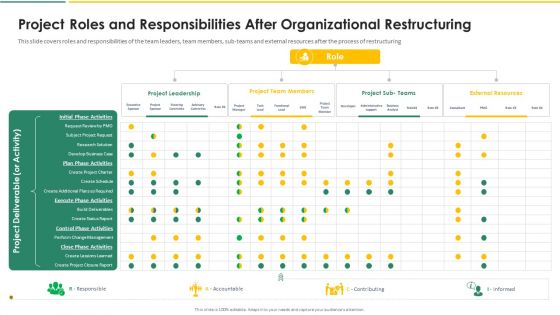
Organization Chart And Corporate Model Transformation Project Roles And Responsibilities After Pictures PDF
This slide covers roles and responsibilities of the team leaders, team members, sub-teams and external resources after the process of restructuring. Deliver an awe inspiring pitch with this creative organization chart and corporate model transformation project roles and responsibilities after pictures pdf bundle. Topics like project leadership, project team members, project sub teams, external resources can be discussed with this completely editable template. It is available for immediate download depending on the needs and requirements of the user.

Key Stakeholder Engagement RACI Chart For Project Management Ppt Outline Clipart PDF
Pitch your topic with ease and precision using this key stakeholder engagement raci chart for project management ppt outline clipart pdf. This layout presents information on planning, execution, initiation. It is also available for immediate download and adjustment. So, changes can be made in the color, design, graphics or any other component to create a unique layout.
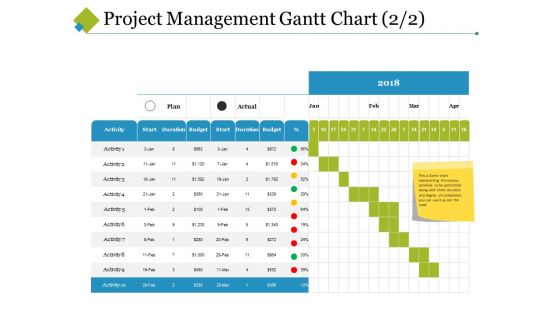
Project Management Gantt Chart Template 2 Ppt PowerPoint Presentation Model Slide Download
This is a project management gantt chart template 2 ppt powerpoint presentation model slide download. This is a nine stage process. The stages in this process are start, duration, budget, activity, plan.

Mba Models And Frameworks Arrows Pointing Inwards Chart 7 Stages Consulting Diagram
Our MBA Models And Frameworks Arrows Pointing Inwards Chart 7 Stages Consulting Diagram Powerpoint Templates Team Are A Dogged Lot. They Keep At It Till They Get It Right.
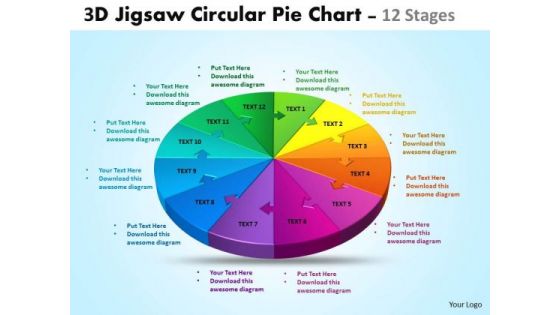
Mba Models And Frameworks 3d Jigsaw Circular Pie Chart 12 Stages Business Diagram
Our MBA Models And Frameworks 3D Jigsaw Circular Pie Chart 12 Stages Business Diagram Powerpoint Templates Team Are A Dogged Lot. They Keep At It Till They Get It Right.
Percentage Value Comparison Pie Chart Icon Ppt PowerPoint Presentation Model Clipart Images
This is a percentage value comparison pie chart icon ppt powerpoint presentation model clipart images. This is a three stage process. The stages in this process are percentage icon, dividend icon, portion icon.

Succession Planning Modelling Chart Ppt PowerPoint Presentation Visual Aids Background Images
This is a succession planning modelling chart ppt powerpoint presentation visual aids background images. This is a three stage process. The stages in this process are compare, marketing, business, management, planning.

Gantt Chart For Project Management And Process Mapping Ppt PowerPoint Presentation Model Styles
This is a gantt chart for project management and process mapping ppt powerpoint presentation model styles. This is a four stage process. The stages in this process are swim lane diagram, flowchart, management.
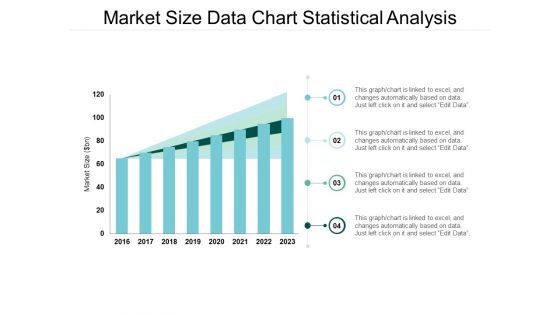
Market Size Data Chart Statistical Analysis Ppt Powerpoint Presentation Model Format
This is a market size data chart statistical analysis ppt powerpoint presentation model format. The topics discussed in this diagram are market growth, market opportunity, market profitability. This is a completely editable PowerPoint presentation, and is available for immediate download.
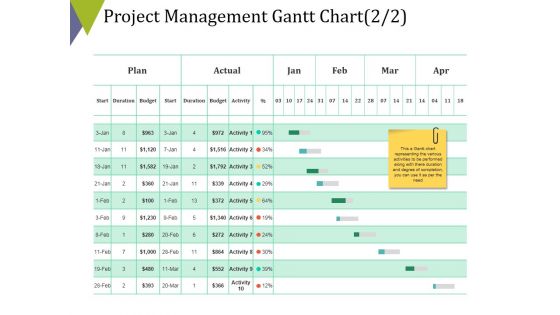
Project Management Gantt Chart Template 2 Ppt PowerPoint Presentation Pictures Model
This is a project management gantt chart template 2 ppt powerpoint presentation pictures model. This is a four stage process. The stages in this process are table, business, strategy, compare, marketing.

Data Collection And Analysis Control Chart Ppt PowerPoint Presentation Model Backgrounds
This is a data collection and analysis control chart ppt powerpoint presentation model backgrounds. This is a two stage process. The stages in this process are business, marketing, strategy, finance, analysis.
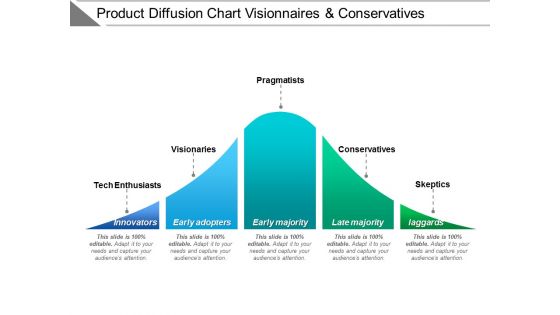
Product Diffusion Chart Visionaries And Conservatives Ppt PowerPoint Presentation Model Clipart
This is a product diffusion chart visionaries and conservatives ppt powerpoint presentation model clipart. This is a five stage process. The stages in this process are adoption curve, crossing the chasm, hype cycle.

Volume Open High Low Close Chart Ppt PowerPoint Presentation Model Inspiration
This is a volume open high low close chart ppt powerpoint presentation model inspiration. This is a three stage process. The stages in this process are business, management, strategy, marketing, sales.

3D Bar Chart For Data Representation Ppt PowerPoint Presentation Model Graphic Tips
This is a 3d bar chart for data representation ppt powerpoint presentation model graphic tips. This is a four stage process. The stages in this process are art, colouring, paint brush.

3D Pie Chart For Data Comparison Ppt PowerPoint Presentation Model Design Ideas
This is a 3d pie chart for data comparison ppt powerpoint presentation model design ideas. This is a six stage process. The stages in this process are art, colouring, paint brush.
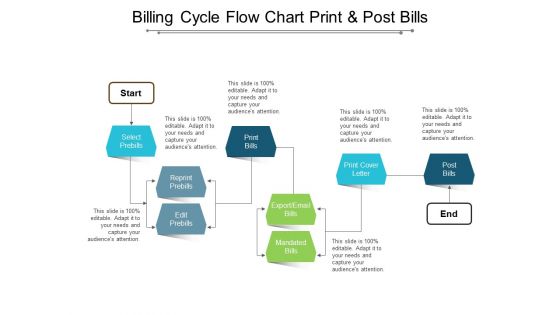
Billing Cycle Flow Chart Print And Post Bills Ppt Powerpoint Presentation Model Portfolio
This is a billing cycle flow chart print and post bills ppt powerpoint presentation model portfolio. This is a six stage process. The stages in this process are billing process, billing procedure, billing cycle.
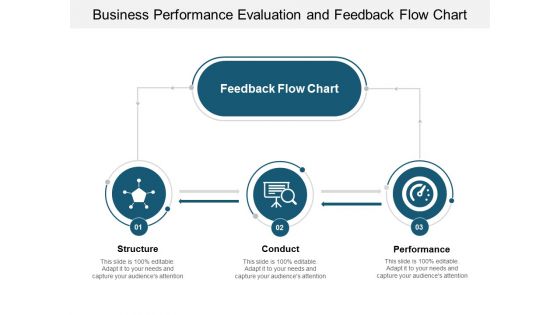
Business Performance Evaluation And Feedback Flow Chart Ppt Powerpoint Presentation Model Example Topics
This is a business performance evaluation and feedback flow chart ppt powerpoint presentation model example topics. This is a three stage process. The stages in this process are performance management, structure conduct performance, performance review and analysis.
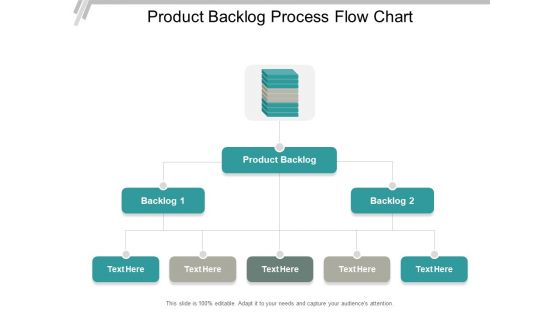
Product Backlog Process Flow Chart Ppt PowerPoint Presentation Model Design Templates
This is a product backlog process flow chart ppt powerpoint presentation model design templates. This is a two stage process. The stages in this process are backlog, uncompleted work, pending work.
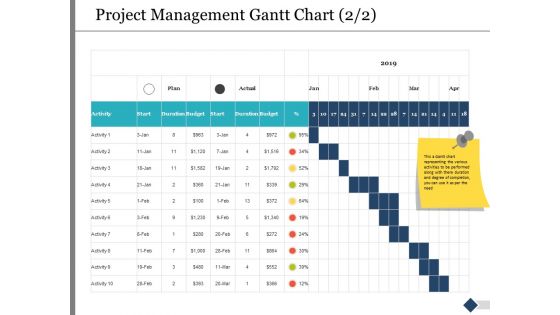
Project Management Gantt Chart Activity Ppt PowerPoint Presentation Model Background Designs
This is a project management gantt chart activity ppt powerpoint presentation model background designs. This is a three stage process. The stages in this process are marketing, business, management, compare.
Manager Analyzing Trends From Financial Modelling Chart Vector Icon Portrait PDF
Persuade your audience using this manager analyzing trends from financial modelling chart vector icon portrait pdf. This PPT design covers three stages, thus making it a great tool to use. It also caters to a variety of topics including manager analyzing trends from financial modelling chart vector icon. Download this PPT design now to present a convincing pitch that not only emphasizes the topic but also showcases your presentation skills.
Hierarchy Chart Icon With Key Decision Makers Ppt Model Elements PDF
Persuade your audience using this hierarchy chart icon with key decision makers ppt model elements pdf. This PPT design covers three stages, thus making it a great tool to use. It also caters to a variety of topics including hierarchy chart icon with key decision makers. Download this PPT design now to present a convincing pitch that not only emphasizes the topic but also showcases your presentation skills.
Equity Stock Market Chart On Laptop Vector Icon Ppt PowerPoint Presentation Model Portrait PDF
Persuade your audience using this equity stock market chart on laptop vector icon ppt powerpoint presentation model portrait pdf. This PPT design covers three stages, thus making it a great tool to use. It also caters to a variety of topics including equity stock market chart on laptop vector icon. Download this PPT design now to present a convincing pitch that not only emphasizes the topic but also showcases your presentation skills.
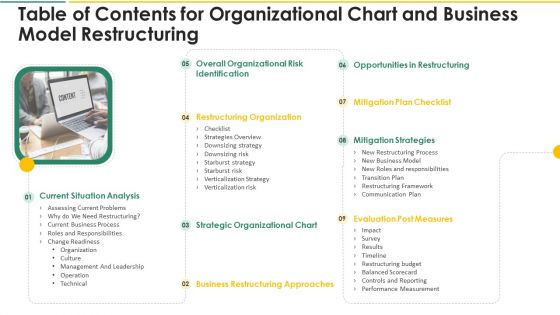
Table Of Contents For Organizational Chart And Business Model Restructuring Designs PDF
This is atable of contents for organizational chart and business model restructuring designs pdf template with various stages. Focus and dispense information on nine stages using this creative set, that comes with editable features. It contains large content boxes to add your information on topics like strategic organizational chart, business restructuring approaches, evaluation post measures, mitigation strategies, mitigation plan checklist. You can also showcase facts, figures, and other relevant content using this PPT layout. Grab it now.
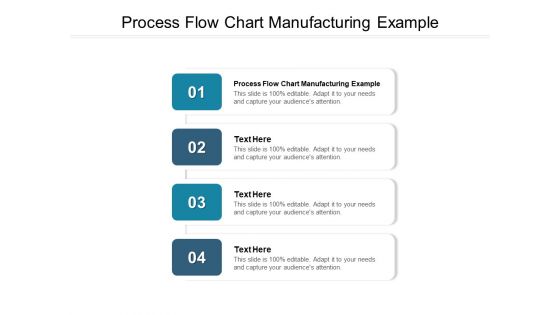
Process Flow Chart Manufacturing Example Ppt PowerPoint Presentation Model Design Ideas Cpb
Presenting this set of slides with name process flow chart manufacturing example ppt powerpoint presentation model design ideas cpb. This is an editable Powerpoint four stages graphic that deals with topics like process flow chart manufacturing example to help convey your message better graphically. This product is a premium product available for immediate download and is 100 percent editable in Powerpoint. Download this now and use it in your presentations to impress your audience.
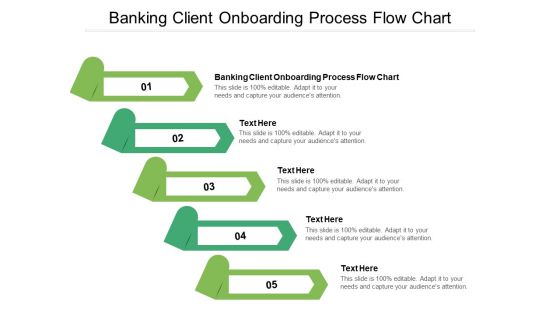
Banking Client Onboarding Process Flow Chart Ppt PowerPoint Presentation Model Clipart Cpb Pdf
Presenting this set of slides with name banking client onboarding process flow chart ppt powerpoint presentation model clipart cpb pdf. This is an editable Powerpoint five stages graphic that deals with topics like banking client onboarding process flow chart to help convey your message better graphically. This product is a premium product available for immediate download and is 100 percent editable in Powerpoint. Download this now and use it in your presentations to impress your audience.

Vector Showing Flow Chart For Process Control Ppt PowerPoint Presentation Model Graphics Example PDF
Persuade your audience using this vector showing flow chart for process control ppt powerpoint presentation model graphics example pdf. This PPT design covers three stages, thus making it a great tool to use. It also caters to a variety of topics including vector showing flow chart for process control. Download this PPT design now to present a convincing pitch that not only emphasizes the topic but also showcases your presentation skills.
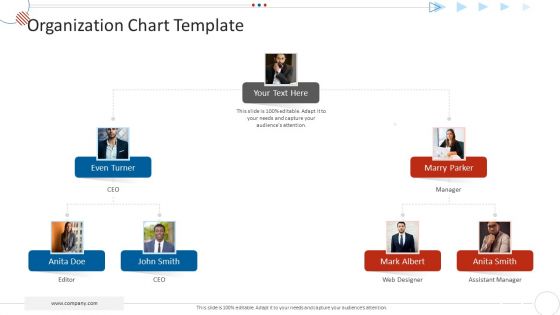
Mckinsey 7S Strategy Model For Project Management Organization Chart Template Guidelines PDF
This is a mckinsey 7s strategy model for project management organization chart template guidelines pdf template with various stages. Focus and dispense information on two stages using this creative set, that comes with editable features. It contains large content boxes to add your information on topics like organization chart template. You can also showcase facts, figures, and other relevant content using this PPT layout. Grab it now.

 Home
Home