Mathematics
Icons Slide For Role Of Reinforcement In Learning Algorithms Topics Pdf
Help your business to create an attention-grabbing presentation using our Icons Slide For Role Of Reinforcement In Learning Algorithms Topics Pdf set of slides. The slide contains innovative icons that can be flexibly edited. Choose this Icons Slide For Role Of Reinforcement In Learning Algorithms Topics Pdf template to create a satisfactory experience for your customers. Go ahead and click the download button.

Sustainability Calculation With KPI Customer Satisfaction Dashboard Customer Ppt PowerPoint Presentation Gallery Smartart PDF
Following slide shows customer satisfaction dashboard covering net promoter score. It also includes customer retention metrics with a 12 month format. Deliver and pitch your topic in the best possible manner with this sustainability calculation with kpi customer satisfaction dashboard customer ppt powerpoint presentation gallery smartart pdf. Use them to share invaluable insights on customer satisfaction dashboard and impress your audience. This template can be altered and modified as per your expectations. So, grab it now.

Hybrid Algorithms Bandit And Casual Interference Use Cases Of Filtering Methods Diagrams Pdf
This slide talks about the hybrid algorithms used by Amazons recommender system. The purpose of this slide is to represent the working of Amazons hybrid algorithms. These algorithms are Bandit inference and casual inference. The Hybrid Algorithms Bandit And Casual Interference Use Cases Of Filtering Methods Diagrams Pdf is a compilation of the most recent design trends as a series of slides. It is suitable for any subject or industry presentation, containing attractive visuals and photo spots for businesses to clearly express their messages. This template contains a variety of slides for the user to input data, such as structures to contrast two elements, bullet points, and slides for written information. Slidegeeks is prepared to create an impression.

Data Warehousing And Types Of Machine Algorithms In Data Mining AI SS V
This slide showcases various types of machine learning algorithms often used by experts in the field of data mining. It provides information about supervised and un-supervised machine learning ML algorithms. Crafting an eye-catching presentation has never been more straightforward. Let your presentation shine with this tasteful yet straightforward Data Warehousing And Types Of Machine Algorithms In Data Mining AI SS V template. It offers a minimalistic and classy look that is great for making a statement. The colors have been employed intelligently to add a bit of playfulness while still remaining professional. Construct the ideal Data Warehousing And Types Of Machine Algorithms In Data Mining AI SS V that effortlessly grabs the attention of your audience Begin now and be certain to wow your customers
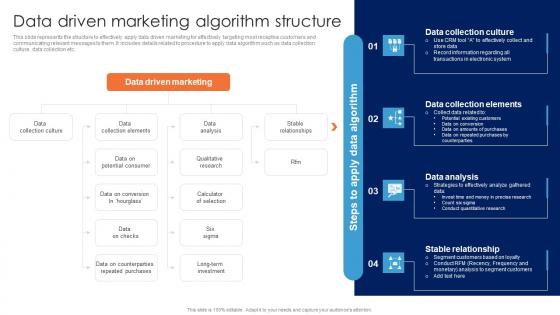
Data Driven Marketing Algorithm Structure Guide For Data Driven Advertising Brochure Pdf
This slide represents the structure to effectively apply data driven marketing for effectively targeting most receptive customers and communicating relevant messages to them. It includes details related to procedure to apply data algorithm such as data collection culture, data collection etc.Explore a selection of the finest Data Driven Marketing Algorithm Structure Guide For Data Driven Advertising Brochure Pdf here. With a plethora of professionally designed and pre-made slide templates, you can quickly and easily find the right one for your upcoming presentation. You can use our Data Driven Marketing Algorithm Structure Guide For Data Driven Advertising Brochure Pdf to effectively convey your message to a wider audience. Slidegeeks has done a lot of research before preparing these presentation templates. The content can be personalized and the slides are highly editable. Grab templates today from Slidegeeks.
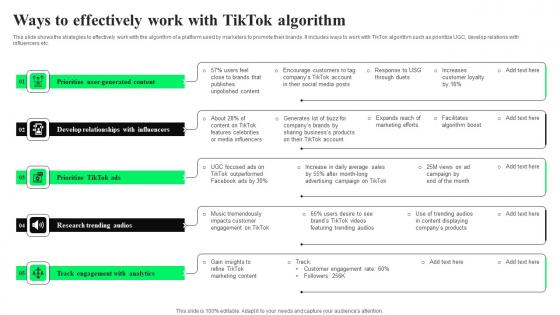
Ways Effectively Work With TikTok Algorithm TikTok Advertising Strategies To Provide Effective Grid Pdf
This slide shows the strategies to effectively work with the algorithm of a platform used by marketers to promote their brands. It includes ways to work with TikTok algorithm such as prioritize UGC, develop relations with influencers etc. Boost your pitch with our creative Ways Effectively Work With TikTok Algorithm TikTok Advertising Strategies To Provide Effective Grid Pdf. Deliver an awe inspiring pitch that will mesmerize everyone. Using these presentation templates you will surely catch everyones attention. You can browse the ppts collection on our website. We have researchers who are experts at creating the right content for the templates. So you do not have to invest time in any additional work. Just grab the template now and use them.
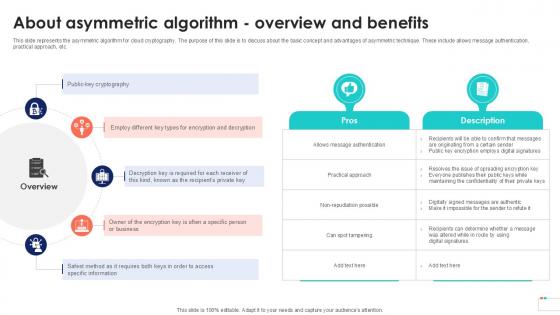
About Asymmetric Algorithm Overview Data Security In Cloud Computing Ppt Template
This slide represents the asymmetric algorithm for cloud cryptography. The purpose of this slide is to discuss about the basic concept and advantages of asymmetric technique. These include allows message authentication, practical approach, etc. Boost your pitch with our creative About Asymmetric Algorithm Overview Data Security In Cloud Computing Ppt Template. Deliver an awe-inspiring pitch that will mesmerize everyone. Using these presentation templates you will surely catch everyones attention. You can browse the ppts collection on our website. We have researchers who are experts at creating the right content for the templates. So you do not have to invest time in any additional work. Just grab the template now and use them.

Instagram Algorithm For Explore Tab Content Online Advertising Solutions Topics Pdf
This slide shows criteria guide for the content which pops up on users explore tab. It includes description regarding post information, author information, activity on platform and interaction history. If you are looking for a format to display your unique thoughts, then the professionally designed Instagram Algorithm For Explore Tab Content Online Advertising Solutions Topics Pdf is the one for you. You can use it as a Google Slides template or a PowerPoint template. Incorporate impressive visuals, symbols, images, and other charts. Modify or reorganize the text boxes as you desire. Experiment with shade schemes and font pairings. Alter, share or cooperate with other people on your work. Download Instagram Algorithm For Explore Tab Content Online Advertising Solutions Topics Pdf and find out how to give a successful presentation. Present a perfect display to your team and make your presentation unforgettable.
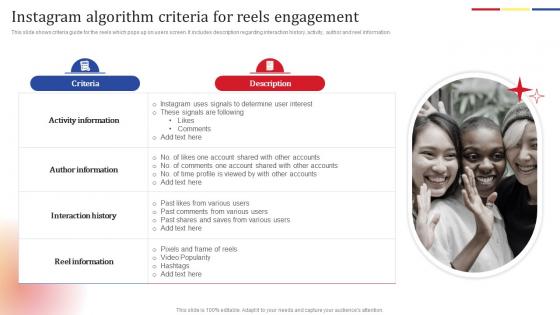
Instagram Algorithm Criteria Social Media Platform Advertising To Enhance Brand Awareness Background Pdf
This slide shows criteria guide for the reels which pops up on users screen. It includes description regarding interaction history, activity, author and reel information. Find highly impressive Instagram Algorithm Criteria Social Media Platform Advertising To Enhance Brand Awareness Background Pdf on Slidegeeks to deliver a meaningful presentation. You can save an ample amount of time using these presentation templates. No need to worry to prepare everything from scratch because Slidegeeks experts have already done a huge research and work for you. You need to download Instagram Algorithm Criteria Social Media Platform Advertising To Enhance Brand Awareness Background Pdf for your upcoming presentation. All the presentation templates are 100 percent editable and you can change the color and personalize the content accordingly. Download now

Reinforcement Learning Unveiled How Does Q Learning Algorithm Works AI SS V
This slide showcases how Q-learning process works along with its key use cases referable by businessmen and industrial experts. It provides details about episodes, new actions, temporal difference, bellmans equation, etc. Formulating a presentation can take up a lot of effort and time, so the content and message should always be the primary focus. The visuals of the PowerPoint can enhance the presenters message, so our Reinforcement Learning Unveiled How Does Q Learning Algorithm Works AI SS V was created to help save time. Instead of worrying about the design, the presenter can concentrate on the message while our designers work on creating the ideal templates for whatever situation is needed. Slidegeeks has experts for everything from amazing designs to valuable content, we have put everything into Reinforcement Learning Unveiled How Does Q Learning Algorithm Works AI SS V.
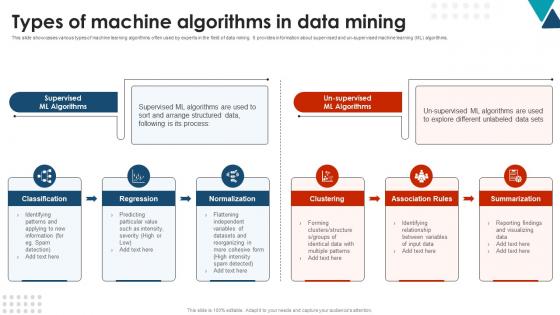
Types Of Machine Algorithms In Data Mining Using Data Mining Tools To Optimize Processes AI SS V
This slide showcases various types of machine learning algorithms often used by experts in the field of data mining. It provides information about supervised and un-supervised machine learning ML algorithms. Do you know about Slidesgeeks Types Of Machine Algorithms In Data Mining Using Data Mining Tools To Optimize Processes AI SS V These are perfect for delivering any kind od presentation. Using it, create PowerPoint presentations that communicate your ideas and engage audiences. Save time and effort by using our pre-designed presentation templates that are perfect for a wide range of topic. Our vast selection of designs covers a range of styles, from creative to business, and are all highly customizable and easy to edit. Download as a PowerPoint template or use them as Google Slides themes.
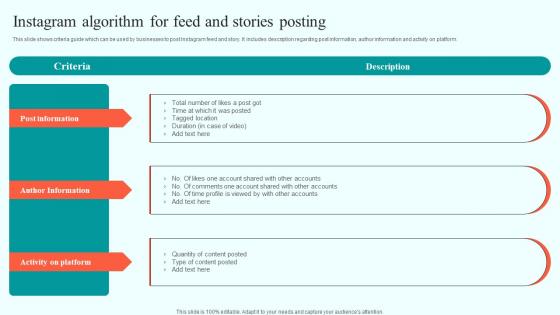
Instagram Algorithm For Feed And Stories Posting Online Advertising Solutions Guidelines Pdf
This slide shows criteria guide which can be used by businesses to post Instagram feed and story. It includes description regarding post information, author information and activity on platform. Are you in need of a template that can accommodate all of your creative concepts This one is crafted professionally and can be altered to fit any style. Use it with Google Slides or PowerPoint. Include striking photographs, symbols, depictions, and other visuals. Fill, move around, or remove text boxes as desired. Test out color palettes and font mixtures. Edit and save your work, or work with colleagues. Download Instagram Algorithm For Feed And Stories Posting Online Advertising Solutions Guidelines Pdf and observe how to make your presentation outstanding. Give an impeccable presentation to your group and make your presentation unforgettable.
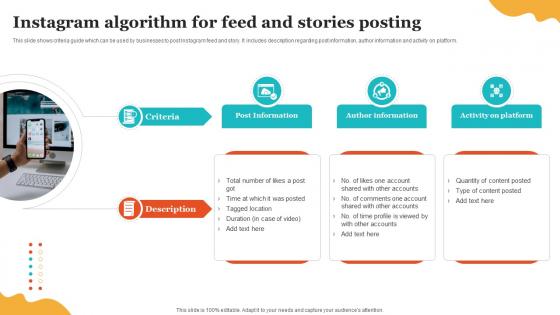
Social Media Marketing To Enhance Instagram Algorithm For Feed And Stories Posting MKT SS V
This slide shows criteria guide which can be used by businesses to post Instagram feed and story. It includes description regarding post information, author information and activity on platform. Are you in need of a template that can accommodate all of your creative concepts This one is crafted professionally and can be altered to fit any style. Use it with Google Slides or PowerPoint. Include striking photographs, symbols, depictions, and other visuals. Fill, move around, or remove text boxes as desired. Test out color palettes and font mixtures. Edit and save your work, or work with colleagues. Download Social Media Marketing To Enhance Instagram Algorithm For Feed And Stories Posting MKT SS V and observe how to make your presentation outstanding. Give an impeccable presentation to your group and make your presentation unforgettable.

Venn Diagram Showing Four Aspects Cycle Chart PowerPoint Slides
We present our venn diagram showing four aspects Cycle Chart PowerPoint Slides.Download our Venn Diagrams PowerPoint Templates because analyse your plans with equal sincerity. Use our Business PowerPoint Templates because the NASA Space programme took mankind to the moon and so much more. Like them you too can look far beyond normal boundaries. Show them that in your mind the sky is certainly not the limit. Present our Signs PowerPoint Templates because you can outline your targets to your team. Use our Leadership PowerPoint Templates because Our PowerPoint Templates and Slides will help you be quick off the draw. Just enter your specific text and see your points hit home. Download our Symbol PowerPoint Templates because this is the unerring accuracy in reaching the target. the effortless ability to launch into flight.Use these PowerPoint slides for presentations relating to Background, Business, Chart, Circle, Colorful, Concept, Diagram, Financial, Geometry, Horizontal, Math, Overlap, Process, Round, Shadow, Shape, Transparency, Venn Diagram. The prominent colors used in the PowerPoint template are Yellow, Red, Blue. We assure you our venn diagram showing four aspects Cycle Chart PowerPoint Slides are topically designed to provide an attractive backdrop to any subject. Customers tell us our Circle PowerPoint templates and PPT Slides are Pleasant. The feedback we get is that our venn diagram showing four aspects Cycle Chart PowerPoint Slides are One-of-a-kind. We assure you our Concept PowerPoint templates and PPT Slides are Elevated. People tell us our venn diagram showing four aspects Cycle Chart PowerPoint Slides are Tasteful. We assure you our Colorful PowerPoint templates and PPT Slides are Quaint.
Compass For Geometry Tools Vector Icon Ppt PowerPoint Presentation Gallery Show PDF
Showcasing this set of slides titled compass for geometry tools vector icon ppt powerpoint presentation gallery show pdf. The topics addressed in these templates are compass for geometry tools vector icon. All the content presented in this PPT design is completely editable. Download it and make adjustments in color, background, font etc. as per your unique business setting.
Sustainability Calculation With KPI Effective Rate Metrics By Customer And Offering Ppt PowerPoint Presentation Icon Files PDF
This slide covers effective rate metrics. It shows over year over comparison of effective rate per customer as well as effective rate per offering. Deliver an awe inspiring pitch with this creative sustainability calculation with kpi effective rate metrics by customer and offering ppt powerpoint presentation icon files pdf bundle. Topics like effective rate metrics by customer and offering can be discussed with this completely editable template. It is available for immediate download depending on the needs and requirements of the user.

Calculation Of Revenue From Subscription Internet Based Trade Structure Ppt Example
This slide show various calculation metrics for measuring revenue under revenue subscription model. It include metrics such as annual recurring revenue ARR, monthly recurring revenue MRR and customer lifetime value CLV , etc. Get a simple yet stunning designed Calculation Of Revenue From Subscription Internet Based Trade Structure Ppt Example. It is the best one to establish the tone in your meetings. It is an excellent way to make your presentations highly effective. So, download this PPT today from Slidegeeks and see the positive impacts. Our easy-to-edit Calculation Of Revenue From Subscription Internet Based Trade Structure Ppt Example can be your go-to option for all upcoming conferences and meetings. So, what are you waiting for Grab this template today.
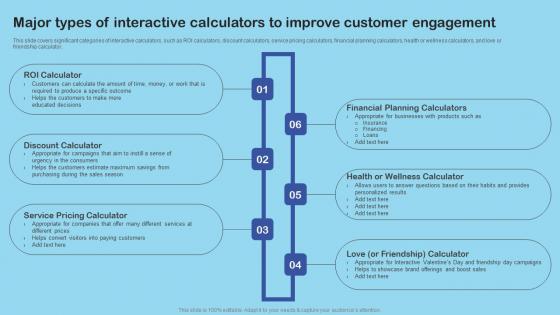
Major Types Of Interactive Calculators Enhance Client Engagement With Interactive Advertising Diagrams Pdf
This slide covers significant categories of interactive calculators, such as ROI calculators, discount calculators, service pricing calculators, financial planning calculators, health or wellness calculators, and love or friendship calculator. Slidegeeks has constructed Major Types Of Interactive Calculators Enhance Client Engagement With Interactive Advertising Diagrams Pdf after conducting extensive research and examination. These presentation templates are constantly being generated and modified based on user preferences and critiques from editors. Here, you will find the most attractive templates for a range of purposes while taking into account ratings and remarks from users regarding the content. This is an excellent jumping off point to explore our content and will give new users an insight into our top notch PowerPoint Templates.
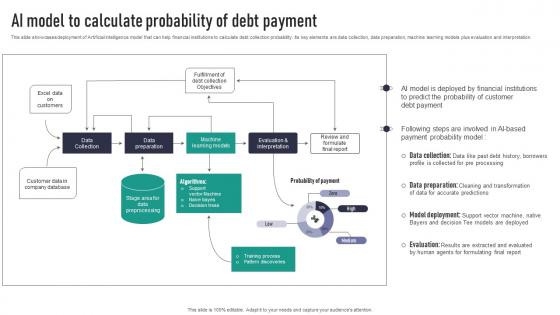
AI Model To Calculate Probability Of Debt Payment Rules Pdf
This slide showcases deployment of Artificial intelligence model that can help financial institutions to calculate debt collection probability. Its key elements are data collection, data preparation, machine learning models plus evaluation and interpretation. Crafting an eye-catching presentation has never been more straightforward. Let your presentation shine with this tasteful yet straightforward AI Model To Calculate Probability Of Debt Payment Rules Pdf template. It offers a minimalistic and classy look that is great for making a statement. The colors have been employed intelligently to add a bit of playfulness while still remaining professional. Construct the ideal AI Model To Calculate Probability Of Debt Payment Rules Pdf that effortlessly grabs the attention of your audience Begin now and be certain to wow your customers

Calculate Respiratory Rate In Powerpoint And Google Slides Cpb
Introducing our well-designed Calculate Respiratory Rate In Powerpoint And Google Slides Cpb. This PowerPoint design presents information on topics like Calculate Respiratory Rate. As it is predesigned it helps boost your confidence level. It also makes you a better presenter because of its high-quality content and graphics. This PPT layout can be downloaded and used in different formats like PDF, PNG, and JPG. Not only this, it is available in both Standard Screen and Widescreen aspect ratios for your convenience. Therefore, click on the download button now to persuade and impress your audience.
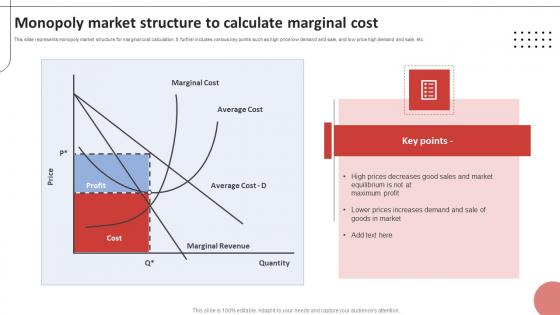
Monopoly Market Structure To Calculate Marginal Cost Information Pdf
This slide represents monopoly market structure for marginal cost calculation. It further includes various key points such as high price low demand and sale, and low price high demand and sale, etc.Pitch your topic with ease and precision using this Monopoly Market Structure To Calculate Marginal Cost Information Pdf This layout presents information on Goods Market, Increases Demand, High Decreases It is also available for immediate download and adjustment. So, changes can be made in the color, design, graphics or any other component to create a unique layout.

Date Difference Calculator In Powerpoint And Google Slides Cpb
Presenting our innovatively-designed set of slides titled Date Difference Calculator In Powerpoint And Google Slides Cpb. This completely editable PowerPoint graphic exhibits Date Difference Calculator that will help you convey the message impactfully. It can be accessed with Google Slides and is available in both standard screen and widescreen aspect ratios. Apart from this, you can download this well-structured PowerPoint template design in different formats like PDF, JPG, and PNG. So, click the download button now to gain full access to this PPT design.
Steroid Conversion Calculator In Powerpoint And Google Slides Cpb
Introducing our well designed Steroid Conversion Calculator In Powerpoint And Google Slides Cpb. This PowerPoint design presents information on topics like Steroid Conversion Calculator. As it is predesigned it helps boost your confidence level. It also makes you a better presenter because of its high quality content and graphics. This PPT layout can be downloaded and used in different formats like PDF, PNG, and JPG. Not only this, it is available in both Standard Screen and Widescreen aspect ratios for your convenience. Therefore, click on the download button now to persuade and impress your audience.

Daily Water Intake Calculator In Powerpoint And Google Slides Cpb
Introducing our well designed Daily Water Intake Calculator In Powerpoint And Google Slides Cpb. This PowerPoint design presents information on topics like Daily Water Intake Calculator. As it is predesigned it helps boost your confidence level. It also makes you a better presenter because of its high quality content and graphics. This PPT layout can be downloaded and used in different formats like PDF, PNG, and JPG. Not only this, it is available in both Standard Screen and Widescreen aspect ratios for your convenience. Therefore, click on the download button now to persuade and impress your audience.
Calories Calculator Weight Gain In Powerpoint And Google Slides Cpb
Presenting our innovatively designed set of slides titled Calories Calculator Weight Gain In Powerpoint And Google Slides Cpb. This completely editable PowerPoint graphic exhibits Calories Calculator Weight Gain that will help you convey the message impactfully. It can be accessed with Google Slides and is available in both standard screen and widescreen aspect ratios. Apart from this, you can download this well structured PowerPoint template design in different formats like PDF, JPG, and PNG. So, click the download button now to gain full access to this PPT design.
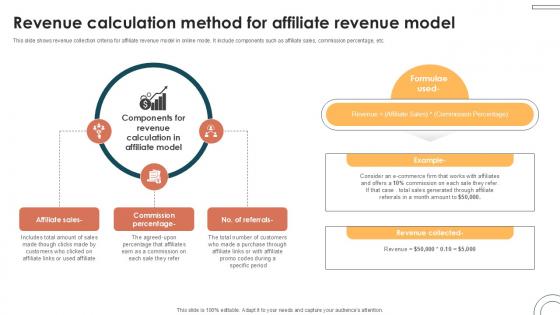
Revenue Calculation Method For Internet Based Trade Structure Ppt Presentation
This slide shows revenue collection criteria for affiliate revenue model in online mode. It include components such as affiliate sales, commission percentage, etc. Crafting an eye-catching presentation has never been more straightforward. Let your presentation shine with this tasteful yet straightforward Revenue Calculation Method For Internet Based Trade Structure Ppt Presentation template. It offers a minimalistic and classy look that is great for making a statement. The colors have been employed intelligently to add a bit of playfulness while still remaining professional. Construct the ideal Revenue Calculation Method For Internet Based Trade Structure Ppt Presentation that effortlessly grabs the attention of your audience Begin now and be certain to wow your customers
Derivative Calculator Steps In Powerpoint And Google Slides Cpb
Presenting our innovatively-designed set of slides titled Derivative Calculator Steps In Powerpoint And Google Slides Cpb. This completely editable PowerPoint graphic exhibits Dance Benefits Increased Creativity that will help you convey the message impactfully. It can be accessed with Google Slides and is available in both standard screen and widescreen aspect ratios. Apart from this, you can download this well-structured PowerPoint template design in different formats like PDF, JPG, and PNG. So, click the download button now to gain full access to this PPT design.

Process To Calculate Inflation Rate Using GDP Comprehensive Guide On Inflation Control CM SS V
This slide shows step by step process which can be used to calculate inflation rate by using GDP deflator. It includes stages such as select year, calculate nominal and real GPD, calculate GDP deflator and interpret results. Want to ace your presentation in front of a live audience Our Process To Calculate Inflation Rate Using GDP Comprehensive Guide On Inflation Control CM SS V can help you do that by engaging all the users towards you. Slidegeeks experts have put their efforts and expertise into creating these impeccable powerpoint presentations so that you can communicate your ideas clearly. Moreover, all the templates are customizable, and easy-to-edit and downloadable. Use these for both personal and commercial use.
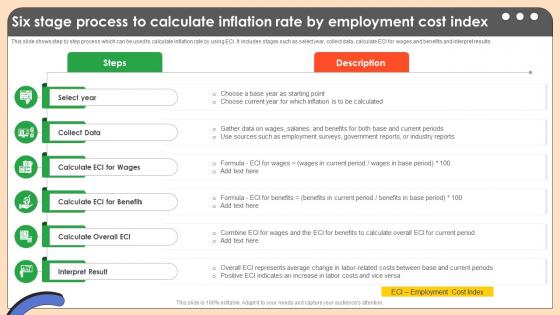
Six Stage Process To Calculate Inflation Rate Comprehensive Guide On Inflation Control CM SS V
This slide shows step by step process which can be used to calculate inflation rate by using ECI. It includes stages such as select year, collect data, calculate ECI for wages and benefits and interpret results. Do you have to make sure that everyone on your team knows about any specific topic I yes, then you should give Six Stage Process To Calculate Inflation Rate Comprehensive Guide On Inflation Control CM SS V a try. Our experts have put a lot of knowledge and effort into creating this impeccable Six Stage Process To Calculate Inflation Rate Comprehensive Guide On Inflation Control CM SS V. You can use this template for your upcoming presentations, as the slides are perfect to represent even the tiniest detail. You can download these templates from the Slidegeeks website and these are easy to edit. So grab these today

Process To Calculate Inflation Rate Using GDP Deflator Strategies For Inflation A Tactical Guide Fin SS V
This slide shows step by step process which can be used to calculate inflation rate by using GDP deflator. It includes stages such as select year, calculate nominal and real GPD, calculate GDP deflator and interpret results. There are so many reasons you need a Process To Calculate Inflation Rate Using GDP Deflator Strategies For Inflation A Tactical Guide Fin SS V. The first reason is you can not spend time making everything from scratch, Thus, Slidegeeks has made presentation templates for you too. You can easily download these templates from our website easily.
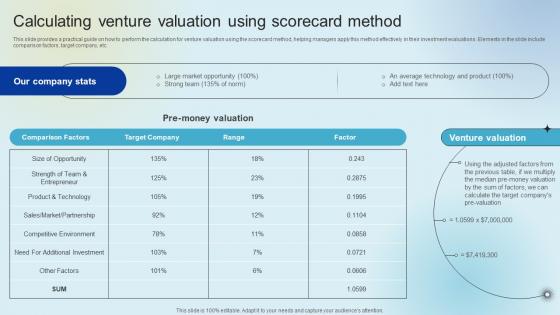
Calculating Venture Valuation Using Scorecard Raising Venture Capital A Holistic Approach Fin SS V
This slide provides a practical guide on how to perform the calculation for venture valuation using the scorecard method, helping managers apply this method effectively in their investment evaluations. Elements in the slide include comparison factors, target company, etc. Get a simple yet stunning designed Calculating Venture Valuation Using Scorecard Raising Venture Capital A Holistic Approach Fin SS V. It is the best one to establish the tone in your meetings. It is an excellent way to make your presentations highly effective. So, download this PPT today from Slidegeeks and see the positive impacts. Our easy-to-edit Calculating Venture Valuation Using Scorecard Raising Venture Capital A Holistic Approach Fin SS V can be your go-to option for all upcoming conferences and meetings. So, what are you waiting for. Grab this template today.

Example To Calculate Inflation Rate By Consumer Strategies For Inflation A Tactical Guide Fin SS V
This slide shows example which can be used by individuals or businesses to get practical insights for using consumer price index to calculate inflation rate in an economy. Find highly impressive Example To Calculate Inflation Rate By Consumer Strategies For Inflation A Tactical Guide Fin SS V on Slidegeeks to deliver a meaningful presentation. You can save an ample amount of time using these presentation templates. No need to worry to prepare everything from scratch because Slidegeeks experts have already done a huge research and work for you. You need to download Example To Calculate Inflation Rate By Consumer Strategies For Inflation A Tactical Guide Fin SS V for your upcoming presentation. All the presentation templates are 100 percent editable and you can change the color and personalize the content accordingly. Download now

Example To Calculate Inflation Rate By Comprehensive Guide On Inflation Control CM SS V
This slide shows example which can be used by individuals or businesses to get practical insights for using consumer price index to calculate inflation rate in an economy. Find highly impressive Example To Calculate Inflation Rate By Comprehensive Guide On Inflation Control CM SS V on Slidegeeks to deliver a meaningful presentation. You can save an ample amount of time using these presentation templates. No need to worry to prepare everything from scratch because Slidegeeks experts have already done a huge research and work for you. You need to download Example To Calculate Inflation Rate By Comprehensive Guide On Inflation Control CM SS V for your upcoming presentation. All the presentation templates are 100 percent editable and you can change the color and personalize the content accordingly. Download now

Steps To Calculate Inflation Using Producer Comprehensive Guide On Inflation Control CM SS V
This slide shows step by step process which can be used to calculate inflation rate by using producer price index. It includes stages such as select year, determine goods, gather price data, calculate price index, etc. Present like a pro with Steps To Calculate Inflation Using Producer Comprehensive Guide On Inflation Control CM SS V. Create beautiful presentations together with your team, using our easy-to-use presentation slides. Share your ideas in real-time and make changes on the fly by downloading our templates. So whether you are in the office, on the go, or in a remote location, you can stay in sync with your team and present your ideas with confidence. With Slidegeeks presentation got a whole lot easier. Grab these presentations today.

Process To Calculate Inflation Rate Using Cost Comprehensive Guide On Inflation Control CM SS V
This slide shows detailed information regarding redistribution of wealth and income inequality as a result inflation. It also includes details about other effects such as social unrest and policy responses. Slidegeeks is one of the best resources for PowerPoint templates. You can download easily and regulate Process To Calculate Inflation Rate Using Cost Comprehensive Guide On Inflation Control CM SS V for your personal presentations from our wonderful collection. A few clicks is all it takes to discover and get the most relevant and appropriate templates. Use our Templates to add a unique zing and appeal to your presentation and meetings. All the slides are easy to edit and you can use them even for advertisement purposes.
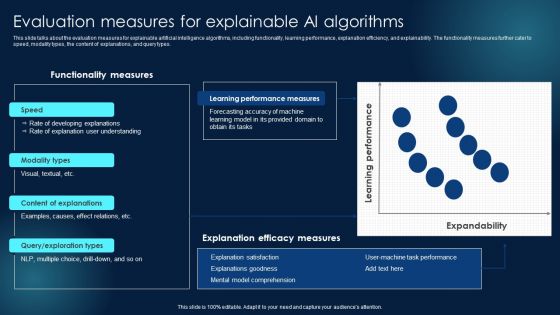
Evaluation Measures For Explainable AI Algorithms Ideas PDF
This slide talks about the evaluation measures for explainable artificial intelligence algorithms, including functionality, learning performance, explanation efficiency, and explainability. The functionality measures further cater to speed, modality types, the content of explanations, and query types. Slidegeeks is one of the best resources for PowerPoint templates. You can download easily and regulate Evaluation Measures For Explainable AI Algorithms Ideas PDF for your personal presentations from our wonderful collection. A few clicks is all it takes to discover and get the most relevant and appropriate templates. Use our Templates to add a unique zing and appeal to your presentation and meetings. All the slides are easy to edit and you can use them even for advertisement purposes.

Blackboard Showing Simplification Tricks In Maths Ppt PowerPoint Presentation Gallery Microsoft PDF
Presenting this set of slides with name blackboard showing simplification tricks in maths ppt powerpoint presentation gallery microsoft pdf. The topics discussed in these slide is blackboard showing simplification tricks in maths. This is a completely editable PowerPoint presentation and is available for immediate download. Download now and impress your audience.
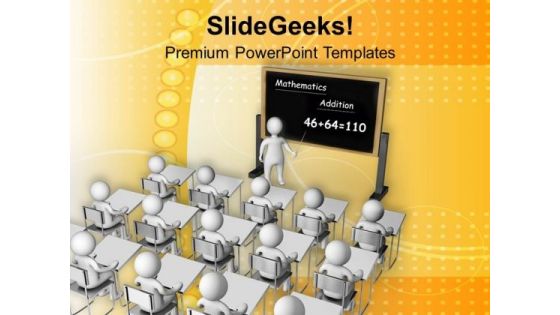
Teach The Math To Student PowerPoint Templates Ppt Backgrounds For Slides 0513
Dreams generate thoughts, thoughts generate ideas. Give them life with our Teach The Math To Student PowerPoint Templates PPT Backgrounds For Slides 0513. Dreams are the start of many a journey. Pave the way with our People PowerPoint Templates PowerPoint Templates. Your thoughts will be the main course. Provide the dressing with our Education PowerPoint Templates.

Decision Tree Algorithm PowerPoint Slides
Decision Tree Algorithm PowerPoint Slides-These high quality powerpoint pre-designed slides and powerpoint templates have been carefully created by our professional team to help you impress your audience. All slides have been created and are 100% editable in powerpoint. Each and every property of any graphic - color, size, orientation, shading, outline etc. can be modified to help you build an effective powerpoint presentation. Any text can be entered at any point in the powerpoint template or slide. Simply DOWNLOAD, TYPE and PRESENT!

Measuring The Experience Of Customer Strategic Brand Management Infographics Pdf
Mentioned slide shows customer effort score that can be used to measure the ease of service experienced by the customer with an organization. Based on survey results, 28 percentage said that it took a lot of effort in searching the desired product. Crafting an eye catching presentation has never been more straightforward. Let your presentation shine with this tasteful yet straightforward Measuring The Experience Of Customer Strategic Brand Management Infographics Pdf template. It offers a minimalistic and classy look that is great for making a statement. The colors have been employed intelligently to add a bit of playfulness while still remaining professional. Construct the ideal Measuring The Experience Of Customer Strategic Brand Management Infographics Pdf that effortlessly grabs the attention of your audience. Begin now and be certain to wow your customers.

Measuring The Experience Of Strategic Brand Management Themes Pdf
Following slide provides information about companys net promoter score that can be used to measure customer satisfaction. Company scored poorly in FY22 as compared to its FY21 score. Make sure to capture your audiences attention in your business displays with our gratis customizable Measuring The Experience Of Strategic Brand Management Themes Pdf. These are great for business strategies, office conferences, capital raising or task suggestions. If you desire to acquire more customers for your tech business and ensure they stay satisfied, create your own sales presentation with these plain slides.
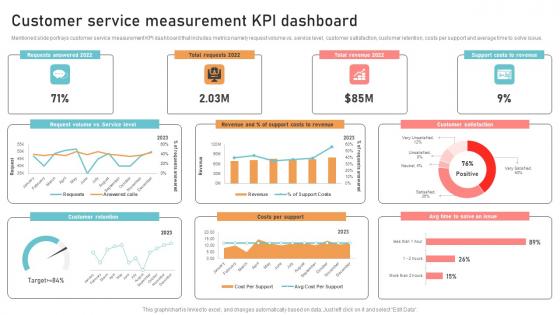
Optimizing Business Integration Customer Service Measurement KPI Template Pdf
Mentioned slide portrays customer service measurement KPI dashboard that includes metrics namely request volume vs. service level, customer satisfaction, customer retention, costs per support and average time to solve issue. Slidegeeks is here to make your presentations a breeze with Optimizing Business Integration Customer Service Measurement KPI Template Pdf With our easy to use and customizable templates, you can focus on delivering your ideas rather than worrying about formatting. With a variety of designs to choose from, you are sure to find one that suits your needs. And with animations and unique photos, illustrations, and fonts, you can make your presentation pop. So whether you are giving a sales pitch or presenting to the board, make sure to check out Slidegeeks first.
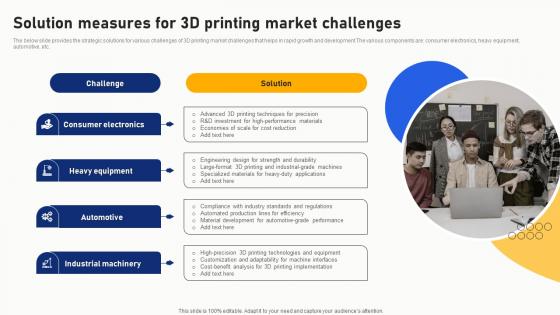
Solution Measures For 3D Printing Market Challenges Slides Pdf
The below slide provides the strategic solutions for various challenges of 3D printing market challenges that helps in rapid growth and development The various components are consumer electronics, heavy equipment, automotive, etc. Showcasing this set of slides titled Solution Measures For 3D Printing Market Challenges Slides Pdf. The topics addressed in these templates are Consumer Electronics, Heavy Equipment, Automotive. All the content presented in this PPT design is completely editable. Download it and make adjustments in color, background, font etc. as per your unique business setting.

Measure Sales Performance With Business Sales Enhancement Campaign Inspiration Pdf
This slide provides glimpse about dashboard analysis that can help the business to track the performance of the sales team. It includes KPIs such as sales, sales target, target achievement, sales last year, sales by channel, etc. The Measure Sales Performance With Business Sales Enhancement Campaign Inspiration Pdf is a compilation of the most recent design trends as a series of slides. It is suitable for any subject or industry presentation, containing attractive visuals and photo spots for businesses to clearly express their messages. This template contains a variety of slides for the user to input data, such as structures to contrast two elements, bullet points, and slides for written information. Slidegeeks is prepared to create an impression.

KPI Dashboard To Measure Conversion Of Customer Support Services Graphics Pdf
This slide represents dashboard to measure customer service performance. It includes number of issues, average time to close, average response time etc. Welcome to our selection of the KPI Dashboard To Measure Conversion Of Customer Support Services Graphics Pdf. These are designed to help you showcase your creativity and bring your sphere to life. Planning and Innovation are essential for any business that is just starting out. This collection contains the designs that you need for your everyday presentations. All of our PowerPoints are 100 percent editable, so you can customize them to suit your needs. This multi purpose template can be used in various situations. Grab these presentation templates today.
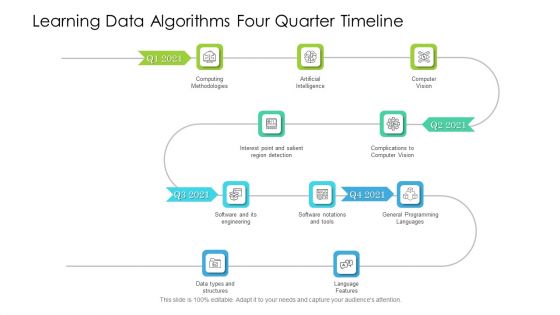
Learning Data Algorithms Four Quarter Timeline Brochure
Presenting our innovatively structured learning data algorithms four quarter timeline brochure Template. Showcase your roadmap process in different formats like PDF, PNG, and JPG by clicking the download button below. This PPT design is available in both Standard Screen and Widescreen aspect ratios. It can also be easily personalized and presented with modified font size, font type, color, and shapes to measure your progress in a clear way.

Learning Data Algorithms Half Yearly Timeline Ideas
Introducing our learning data algorithms half yearly timeline ideas. This PPT presentation is Google Slides compatible, therefore, you can share it easily with the collaborators for measuring the progress. Also, the presentation is available in both standard screen and widescreen aspect ratios. So edit the template design by modifying the font size, font type, color, and shapes as per your requirements. As this PPT design is fully editable it can be presented in PDF, JPG and PNG formats.
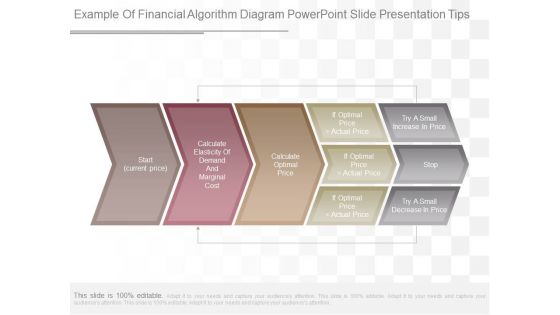
Example Of Financial Algorithm Diagram Powerpoint Slide Presentation Tips
This is a example of financial algorithm diagram powerpoint slide presentation tips. This is a five stage process. The stages in this process are start, current price, calculate elasticity of demand and marginal cost, calculate optimal price, if optimal price actual price, if optimal price actual price, if optimal price actual price, try a small increase in price, stop, try a small decrease in price.

Teacher Education PowerPoint Template 0810
llustration of a teacher in a classroom teaching maths
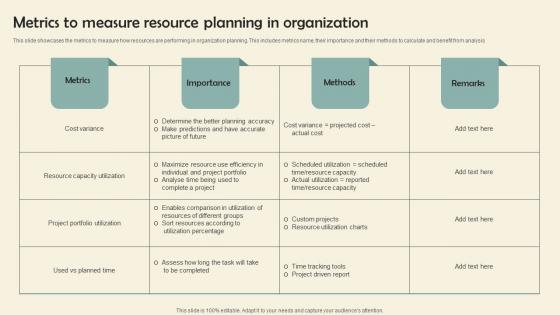
Metrics To Measure Resource Planning In Organization Elements Pdf
This slide showcases the metrics to measure how resources are performing in organization planning. This includes metrics name, their importance and their methods to calculate and benefit from analysis.Showcasing this set of slides titled Metrics To Measure Resource Planning In Organization Elements Pdf The topics addressed in these templates are Resource Capacity Utilization, Project Portfolio Utilization, Custom Projects All the content presented in this PPT design is completely editable. Download it and make adjustments in color, background, font etc. as per your unique business setting.

Lead Metrics To Track And Measure Product Success Ppt Visual Aids Ideas Pdf
This slide highlights various key performance indicators to track and calculate product success in market. It includes key metrics such as net promoter score, client retention rate, active user percentage, customer lifetime value and churn rate. Showcasing this set of slides titled Lead Metrics To Track And Measure Product Success Ppt Visual Aids Ideas Pdf. The topics addressed in these templates are Client Retention Rate, Active User Percentage, Customer Lifetime. All the content presented in this PPT design is completely editable. Download it and make adjustments in color, background, font etc. as per your unique business setting.

Methods To Measure Customer Willingness To Pay Ppt Show Layout Pdf
This slide presents methods to estimate and calculate customers willingness to pay for business products or services. Some of the methods include market research, experiments, direct surveys, auctions, and indirect surveys. Showcasing this set of slides titled Methods To Measure Customer Willingness To Pay Ppt Show Layout Pdf. The topics addressed in these templates are Market Research,Experiments, Direct Surveys. All the content presented in this PPT design is completely editable. Download it and make adjustments in color, background, font etc. as per your unique business setting.
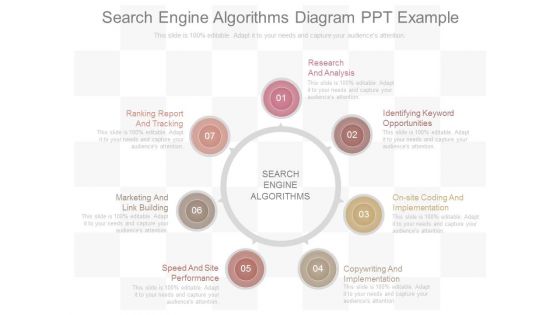
Search Engine Algorithms Diagram Ppt Example
This is a search engine algorithms diagram ppt example. This is a seven stage process. The stages in this process are ranking report and tracking, marketing and link building, speed and site performance, copywriting and implementation, on site coding and implementation, identifying keyword opportunities, research and analysis, search engine algorithms.

Learning Data Algorithms Five Year Timeline Structure
We present our learning data algorithms five year timeline structure. This PowerPoint layout is easy to edit so you can change the font size, font type, color, and shape conveniently. In addition to this, the PowerPoint layout is Google Slides compatible, so you can share it with your audience and give them access to edit it. Therefore, download and save this well researched learning data algorithms five year timeline structure in different formats like PDF, PNG, and JPG to smoothly execute your business plan.
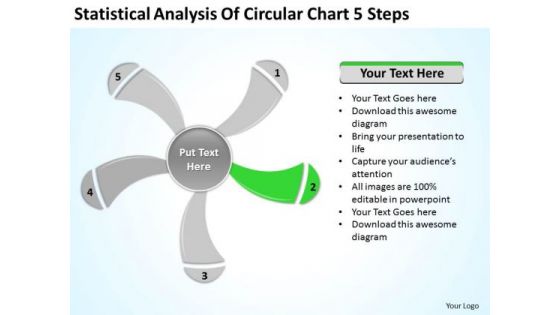
Statistical Analysis Of Circular Chart 5 Steps Ppt Business Plan PowerPoint Slide
We present our statistical analysis of circular chart 5 steps ppt business plan PowerPoint Slide.Download and present our Business PowerPoint Templates because Our PowerPoint Templates and Slides will definately Enhance the stature of your presentation. Adorn the beauty of your thoughts with their colourful backgrounds. Use our Signs PowerPoint Templates because Our PowerPoint Templates and Slides will give good value for money. They also have respect for the value of your time. Download our Shapes PowerPoint Templates because Our PowerPoint Templates and Slides team portray an attitude of elegance. Personify this quality by using them regularly. Use our Metaphors-Visual Concepts PowerPoint Templates because Our PowerPoint Templates and Slides will effectively help you save your valuable time. They are readymade to fit into any presentation structure. Use our Process and Flows PowerPoint Templates because our PowerPoint Templates and Slides are the string of your bow. Fire of your ideas and conquer the podium.Use these PowerPoint slides for presentations relating to graphically, graphic, vector, layout, business, computation, sign, infochart, visual, symbol, template, diagram, calculations, sector, data, revenue, schedule, element, analysis, drawing, report, technology, contour, classification, graph, modern, illustration, icon, comparison, object, chart, collection, science, color, growth, composition, professional, set, education, math, profits, information, symmetry, statistic, structure, infographics, button. The prominent colors used in the PowerPoint template are Green, Gray, White.
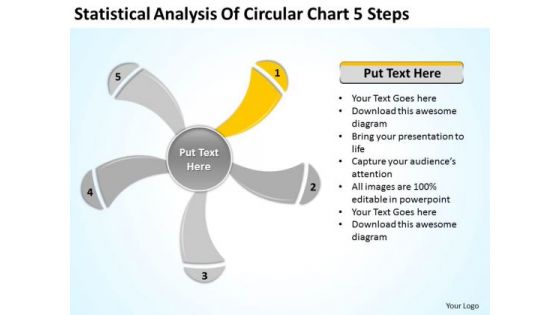
Statistical Analysis Of Circular Chart 5 Steps Ppt Business Plan PowerPoint Slides
We present our statistical analysis of circular chart 5 steps ppt business plan PowerPoint Slides.Download and present our Business PowerPoint Templates because Timeline crunches are a fact of life. Meet all deadlines using our PowerPoint Templates and Slides. Present our Signs PowerPoint Templates because You can Zap them with our PowerPoint Templates and Slides. See them reel under the impact. Use our Shapes PowerPoint Templates because It can Bubble and burst with your ideas. Download our Metaphors-Visual Concepts PowerPoint Templates because You can Create a matrix with our PowerPoint Templates and Slides. Feel the strength of your ideas click into place. Present our Process and Flows PowerPoint Templates because Our PowerPoint Templates and Slides has conjured up a web of all you need with the help of our great team. Use them to string together your glistening ideas.Use these PowerPoint slides for presentations relating to graphically, graphic, vector, layout, business, computation, sign, infochart, visual, symbol, template, diagram, calculations, sector, data, revenue, schedule, element, analysis, drawing, report, technology, contour, classification, graph, modern, illustration, icon, comparison, object, chart, collection, science, color, growth, composition, professional, set, education, math, profits, information, symmetry, statistic, structure, infographics, button. The prominent colors used in the PowerPoint template are Yellow, Gray, White.

Statistical Analysis Of Circular Chart 5 Steps Ppt Outline For Business Plan PowerPoint Slides
We present our statistical analysis of circular chart 5 steps ppt outline for business plan PowerPoint Slides.Present our Business PowerPoint Templates because Our PowerPoint Templates and Slides will definately Enhance the stature of your presentation. Adorn the beauty of your thoughts with their colourful backgrounds. Download our Signs PowerPoint Templates because They will Put the wind in your sails. Skim smoothly over the choppy waters of the market. Download our Shapes PowerPoint Templates because Our PowerPoint Templates and Slides come in all colours, shades and hues. They help highlight every nuance of your views. Download and present our Metaphors-Visual Concepts PowerPoint Templates because Our PowerPoint Templates and Slides will let your words and thoughts hit bullseye everytime. Download and present our Process and Flows PowerPoint Templates because Our PowerPoint Templates and Slides will help you be quick off the draw. Just enter your specific text and see your points hit home.Use these PowerPoint slides for presentations relating to graphically, graphic, vector, layout, business, computation, sign, infochart, visual, symbol, template, diagram, calculations, sector, data, revenue, schedule, element, analysis, drawing, report, technology, contour, classification, graph, modern, illustration, icon, comparison, object, chart, collection, science, color, growth, composition, professional, set, education, math, profits, information, symmetry, statistic, structure, infographics, button. The prominent colors used in the PowerPoint template are Pink, Gray, White.
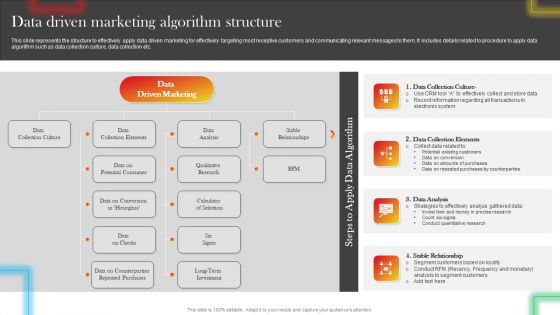
Data Driven Marketing Algorithm Structure Topics PDF
This slide represents the structure to effectively apply data driven marketing for effectively targeting most receptive customers and communicating relevant messages to them. It includes details related to procedure to apply data algorithm such as data collection culture, data collection etc. This Data Driven Marketing Algorithm Structure Topics PDF from Slidegeeks makes it easy to present information on your topic with precision. It provides customization options, so you can make changes to the colors, design, graphics, or any other component to create a unique layout. It is also available for immediate download, so you can begin using it right away. Slidegeeks has done good research to ensure that you have everything you need to make your presentation stand out. Make a name out there for a brilliant performance.

Learning Data Algorithms Three Months Timeline Mockup
Presenting our jaw dropping learning data algorithms three months timeline mockup. You can alternate the color, font size, font type, and shapes of this PPT layout according to your strategic process. This PPT presentation is compatible with Google Slides and is available in both standard screen and widescreen aspect ratios. You can also download this well researched PowerPoint template design in different formats like PDF, JPG, and PNG. So utilize this visually appealing design by clicking the download button given below.
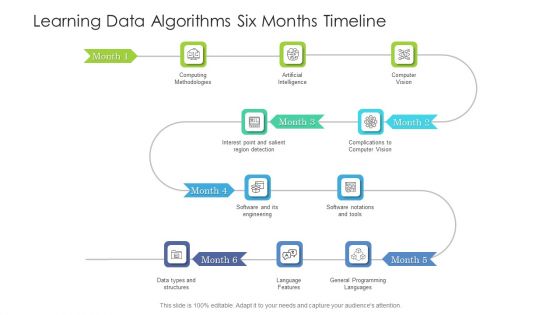
Learning Data Algorithms Six Months Timeline Infographics
Presenting the learning data algorithms six months timeline infographics. The template includes a roadmap that can be used to initiate a strategic plan. Not only this, the PowerPoint slideshow is completely editable and you can effortlessly modify the font size, font type, and shapes according to your needs. This PPT slide can be easily reached in standard screen and widescreen aspect ratios. The set is also available in various formats like PDF, PNG, and JPG. So download and use it multiple times as per your knowledge.

 Home
Home