Math Template
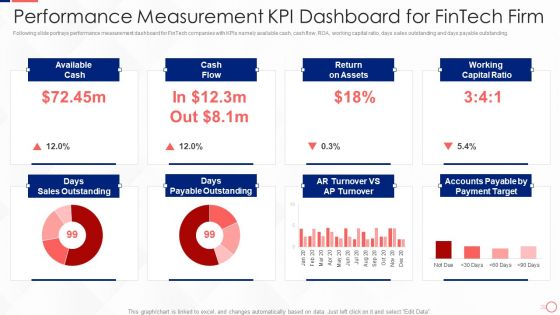
Investing In Tech Innovation Performance Measurement Kpi Dashboard For Fintech Firm Mockup PDF
Following slide portrays performance measurement dashboard for FinTech companies with KPIs namely available cash, cash flow, ROA, working capital ratio, days sales outstanding and days payable outstanding. Deliver and pitch your topic in the best possible manner with this Investing In Tech Innovation Performance Measurement Kpi Dashboard For Fintech Firm Mockup PDF. Use them to share invaluable insights on Available Cash, Cash Flow, Return on Assets, Working Capital Ratio and impress your audience. This template can be altered and modified as per your expectations. So, grab it now.
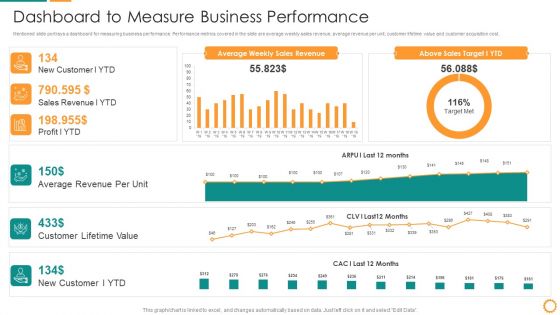
IT Consolidation Post Mergers And Acquisition Dashboard To Measure Business Performance Clipart PDF
Mentioned slide portrays a dashboard for measuring business performance. Performance metrics covered in the slide are average weekly sales revenue, average revenue per unit, customer lifetime value and customer acquisition cost. Deliver and pitch your topic in the best possible manner with this IT Consolidation Post Mergers And Acquisition Dashboard To Measure Business Performance Clipart PDF. Use them to share invaluable insights on Average Revenue, Customer Lifetime Value, Sales Revenue, Sales Target and impress your audience. This template can be altered and modified as per your expectations. So, grab it now.
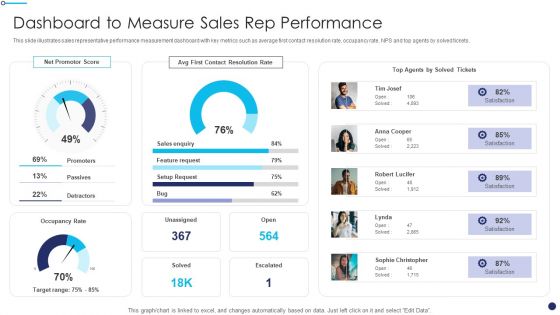
Effective Sales Technique For New Product Launch Dashboard To Measure Sales Rep Performance Themes PDF
This slide illustrates sales representative performance measurement dashboard with key metrics such as average first contact resolution rate, occupancy rate, NPS and top agents by solved tickets.Deliver and pitch your topic in the best possible manner with this Effective Sales Technique For New Product Launch Dashboard To Measure Sales Rep Performance Themes PDF Use them to share invaluable insights on Contact Resolution, Feature Request, Promoters and impress your audience. This template can be altered and modified as per your expectations. So, grab it now.

Effective Sales Technique For New Product Launch Touchpoints To Measure Campaign Microsoft PDF
Mentioned slide illustrates the performance comparison of companys touchpoint with respect to its competitor. Performance measurement is based on the feelings about touchpoint Vs impact on likelihood of purchase.Deliver and pitch your topic in the best possible manner with this Effective Sales Technique For New Product Launch Touchpoints To Measure Campaign Microsoft PDF Use them to share invaluable insights on Invests Heavily, Increase Conversion, Leading Negative and impress your audience. This template can be altered and modified as per your expectations. So, grab it now.
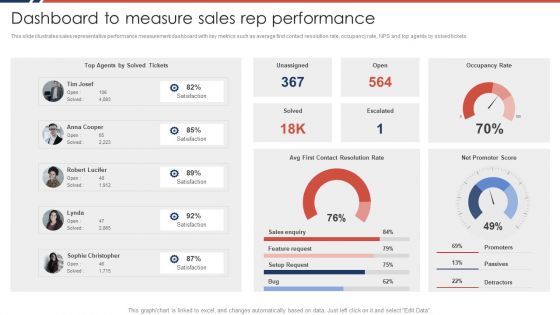
Effective Sales Plan For New Product Introduction In Market Dashboard To Measure Sales Download PDF
This slide illustrates sales representative performance measurement dashboard with key metrics such as average first contact resolution rate, occupancy rate, NPS and top agents by solved tickets.Deliver and pitch your topic in the best possible manner with this Effective Sales Plan For New Product Introduction In Market Dashboard To Measure Sales Download PDF Use them to share invaluable insights on Sales Enquiry, Feature Request, Setup Request and impress your audience. This template can be altered and modified as per your expectations. So, grab it now.
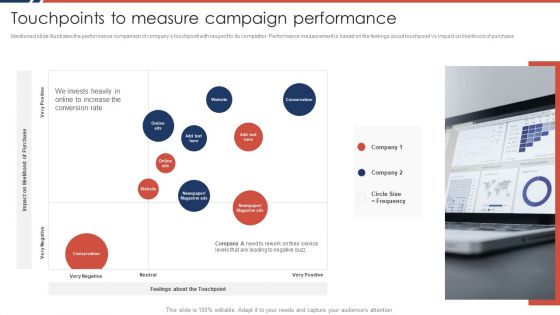
Effective Sales Plan For New Product Introduction In Market Touchpoints To Measure Rules PDF
Mentioned slide illustrates the performance comparison of companys touchpoint with respect to its competitor. Performance measurement is based on the feelings about touchpoint Vs impact on likelihood of purchase.Deliver and pitch your topic in the best possible manner with this Effective Sales Plan For New Product Introduction In Market Touchpoints To Measure Rules PDF Use them to share invaluable insights on Impact Likelihood, Invests Heavily, Increase Conversion and impress your audience. This template can be altered and modified as per your expectations. So, grab it now.
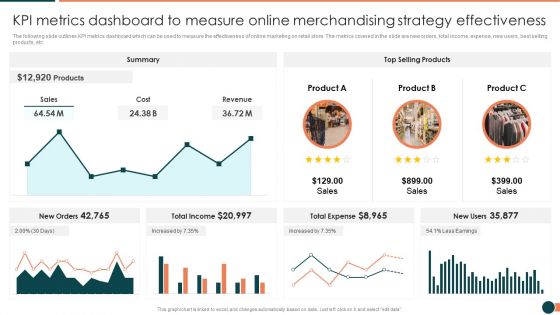
Developing Retail Marketing Strategies To Increase Revenue KPI Metrics Dashboard To Measure Online Portrait PDF
The following slide outlines KPI metrics dashboard which can be used to measure the effectiveness of online marketing on retail store. The metrics covered in the slide are new orders, total income, expense, new users, best selling products, etc.Deliver and pitch your topic in the best possible manner with this Developing Retail Marketing Strategies To Increase Revenue KPI Metrics Dashboard To Measure Online Portrait PDF Use them to share invaluable insights on Total Income, Total Expense, Summary and impress your audience. This template can be altered and modified as per your expectations. So, grab it now.
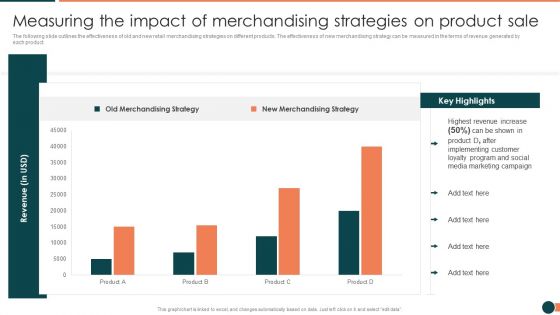
Developing Retail Marketing Strategies To Increase Revenue Measuring The Impact Background PDF
The following slide outlines the effectiveness of old and new retail merchandising strategies on different products. The effectiveness of new merchandising strategy can be measured in the terms of revenue generated by each product.Deliver and pitch your topic in the best possible manner with this Developing Retail Marketing Strategies To Increase Revenue Measuring The Impact Background PDF Use them to share invaluable insights on Revenue Increase, Implementing Customer, Marketing Campaign and impress your audience. This template can be altered and modified as per your expectations. So, grab it now.
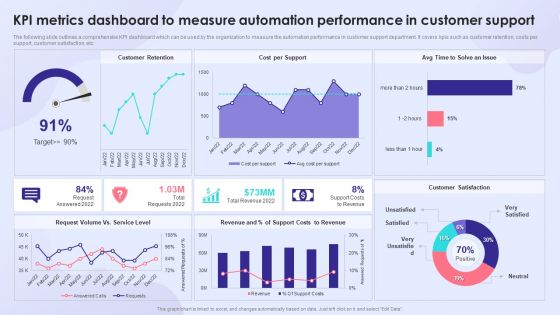
KPI Metrics Dashboard To Measure Automation Performance In Customer Support Professional PDF
The following slide outlines a comprehensive KPI dashboard which can be used by the organization to measure the automation performance in customer support department. It covers kpis such as customer retention, costs per support, customer satisfaction, etc. Deliver and pitch your topic in the best possible manner with this KPI Metrics Dashboard To Measure Automation Performance In Customer Support Professional PDF. Use them to share invaluable insights on Customer Retention, Cost Per Support, Support Costs To Revenue and impress your audience. This template can be altered and modified as per your expectations. So, grab it now.
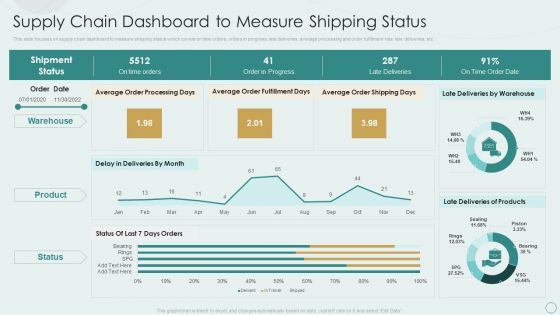
Learning Various Supply Chain Models Supply Chain Dashboard To Measure Shipping Status Graphics PDF
This slide focuses on supply chain dashboard to measure shipping status which covers on time orders, orders in progress, late deliveries, average processing and order fulfillment rate, late deliveries, etc. Deliver and pitch your topic in the best possible manner with this Learning Various Supply Chain Models Supply Chain Dashboard To Measure Shipping Status Graphics PDF. Use them to share invaluable insights on Warehouse, Product, Late Deliveries, On Time Orders and impress your audience. This template can be altered and modified as per your expectations. So, grab it now.
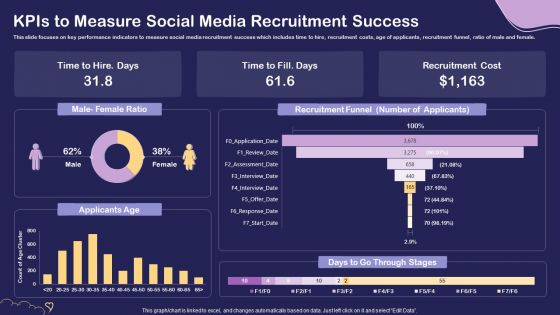
Social Media Hiring For Potential Candidate Kpis To Measure Social Media Recruitment Success Clipart PDF
This slide focuses on key performance indicators to measure social media recruitment success which includes time to hire, recruitment costs, age of applicants, recruitment funnel, ratio of male and female. Deliver and pitch your topic in the best possible manner with this Social Media Hiring For Potential Candidate Kpis To Measure Social Media Recruitment Success Clipart PDF. Use them to share invaluable insights on Recruitment Cost, Applicants Age, Recruitment Funnel and impress your audience. This template can be altered and modified as per your expectations. So, grab it now.
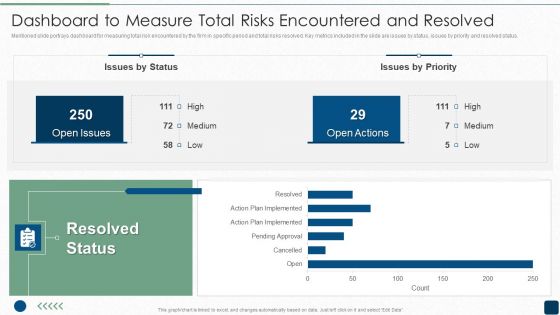
ISO 27001 Certification Procedure Dashboard To Measure Total Risks Encountered And Resolved Topics PDF
Mentioned slide portrays dashboard for measuring total risk encountered by the firm in specific period and total risks resolved. Key metrics included in the slide are issues by status, issues by priority and resolved status.Deliver and pitch your topic in the best possible manner with this ISO 27001 Certification Procedure Dashboard To Measure Total Risks Encountered And Resolved Topics PDF. Use them to share invaluable insights on Resolved Status, Open Issues, Open Actions and impress your audience. This template can be altered and modified as per your expectations. So, grab it now.
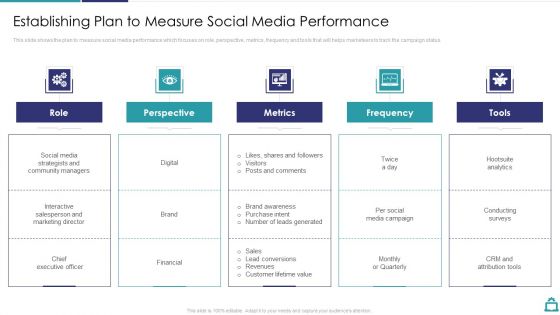
Deploying B2C Social Media Establishing Plan To Measure Social Media Performance Portrait PDF
This slide shows the plan to measure social media performance which focuses on role, perspective, metrics, frequency and tools that will helps marketeers to track the campaign status.Deliver and pitch your topic in the best possible manner with this Deploying B2C Social Media Establishing Plan To Measure Social Media Performance Portrait PDF. Use them to share invaluable insights on Community Managers, Marketing Director, Executive Officer and impress your audience. This template can be altered and modified as per your expectations. So, grab it now.
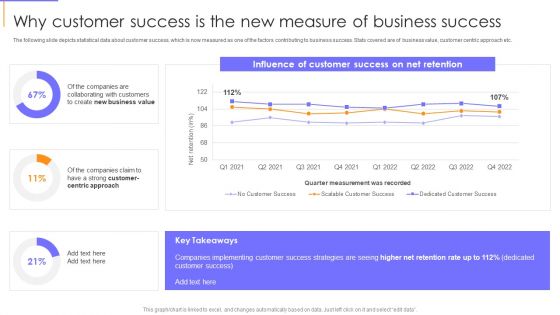
Guide To Client Success Why Customer Success Is The New Measure Of Business Success Slides PDF
The following slide depicts statistical data about customer success, which is now measured as one of the factors contributing to business success. Stats covered are of business value, customer centric approach etc. Deliver and pitch your topic in the best possible manner with this Guide To Client Success Why Customer Success Is The New Measure Of Business Success Slides PDF. Use them to share invaluable insights on Customers, Business Value, Net Retention Rate and impress your audience. This template can be altered and modified as per your expectations. So, grab it now.

Metrics To Measure Business Performance Employee Engagement And Company Culture Demonstration PDF
Following slide shows employee engagement and company culture dashboard. It includes employee details, engagement score, total given recognition, previous seven days performance and radar chart to measure employee performance. Deliver and pitch your topic in the best possible manner with this Metrics To Measure Business Performance Employee Engagement And Company Culture Demonstration PDF. Use them to share invaluable insights on Employee Details, Total Given Recognition, Engagement Score and impress your audience. This template can be altered and modified as per your expectations. So, grab it now.

Client Success Playbook Why Customer Success Is The New Measure Of Business Success Mockup PDF
The following slide depicts statistical data about customer success, which is now measured as one of the factors contributing to business success. Stats covered are of business value, customer centric approach etc. Deliver and pitch your topic in the best possible manner with this Client Success Playbook Why Customer Success Is The New Measure Of Business Success Mockup PDF. Use them to share invaluable insights on Companies Implementing, Customer Success Strategies, Customer Success and impress your audience. This template can be altered and modified as per your expectations. So, grab it now.
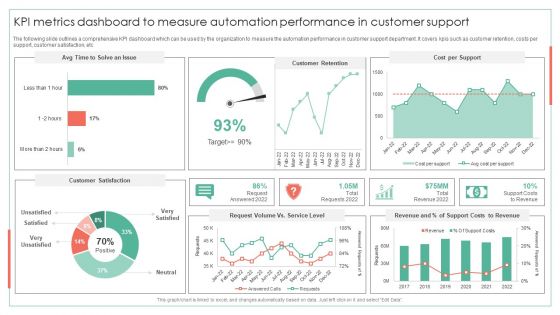
KPI Metrics Dashboard To Measure Automation Performance Achieving Operational Efficiency Guidelines PDF
The following slide outlines a comprehensive KPI dashboard which can be used by the organization to measure the automation performance in customer support department. It covers kpis such as customer retention, costs per support, customer satisfaction, etcDeliver and pitch your topic in the best possible manner with this KPI Metrics Dashboard To Measure Automation Performance Achieving Operational Efficiency Guidelines PDF. Use them to share invaluable insights on Customer Retention, Cost Per Support, Request Volume and impress your audience. This template can be altered and modified as per your expectations. So, grab it now.
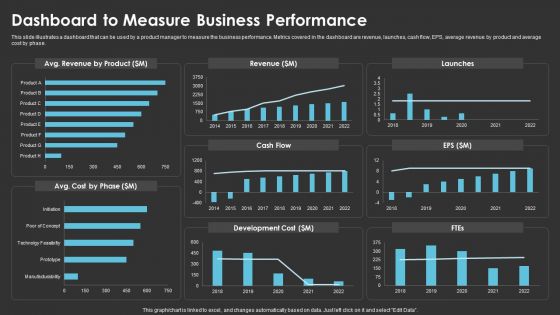
Method To Introduce New Product Offerings In The Industry Dashboard To Measure Business Performance Pictures PDF
This slide illustrates a dashboard that can be used by a product manager to measure the business performance. Metrics covered in the dashboard are revenue, launches, cash flow, EPS, average revenue by product and average cost by phase. Deliver and pitch your topic in the best possible manner with this Method To Introduce New Product Offerings In The Industry Dashboard To Measure Business Performance Pictures PDF. Use them to share invaluable insights on Revenue, Cash Flow, Development Cost and impress your audience. This template can be altered and modified as per your expectations. So, grab it now.
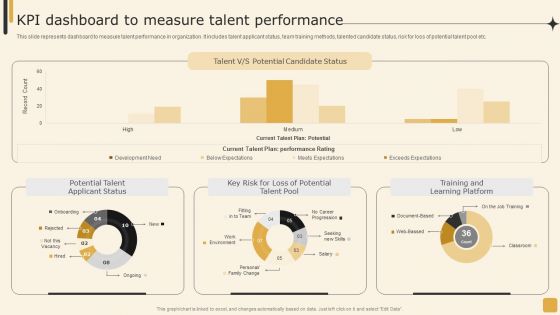
Kpi Dashboard To Measure Talent Performance Employee Performance Management Tactics Professional PDF
This slide represents dashboard to measure talent performance in organization. It includes talent applicant status, team training methods, talented candidate status, risk for loss of potential talent pool etc.The Kpi Dashboard To Measure Talent Performance Employee Performance Management Tactics Professional PDF is a compilation of the most recent design trends as a series of slides. It is suitable for any subject or industry presentation, containing attractive visuals and photo spots for businesses to clearly express their messages. This template contains a variety of slides for the user to input data, such as structures to contrast two elements, bullet points, and slides for written information. Slidegeeks is prepared to create an impression.
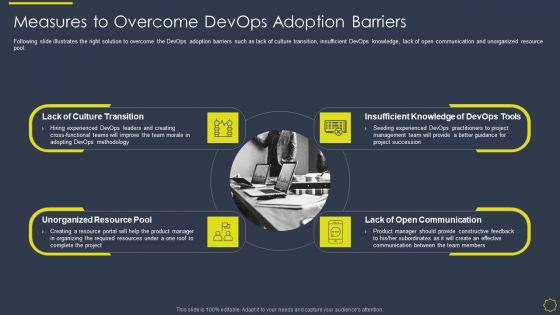
Implementing Development And Operations Platforms For In Time Product Launch IT Measures To Overcome Devops Topics PDF
Following slide illustrates the right solution to overcome the DevOps adoption barriers such as lack of culture transition, insufficient DevOps knowledge, lack of open communication and unorganized resource pool. This is a implementing development and operations platforms for in time product launch it measures to overcome devops topics pdf template with various stages. Focus and dispense information on four stages using this creative set, that comes with editable features. It contains large content boxes to add your information on topics like methodology, resource, product, required, organizing. You can also showcase facts, figures, and other relevant content using this PPT layout. Grab it now.

Key Parameters To Establish Overall Devops Value IT Various Metrics To Measure Effectiveness Of Devops System Portrait PDF
This slide provides information regarding the various metrics that considered essential in determine the effectiveness of DevOps systems in terms of DevOps performance, speed and quality and other metrics. This is a key parameters to establish overall devops value it various metrics to measure effectiveness of devops system portrait pdf template with various stages. Focus and dispense information on three stages using this creative set, that comes with editable features. It contains large content boxes to add your information on topics like metrics, speed, quality, pre devops optimization, post optimizing devops . You can also showcase facts, figures, and other relevant content using this PPT layout. Grab it now.
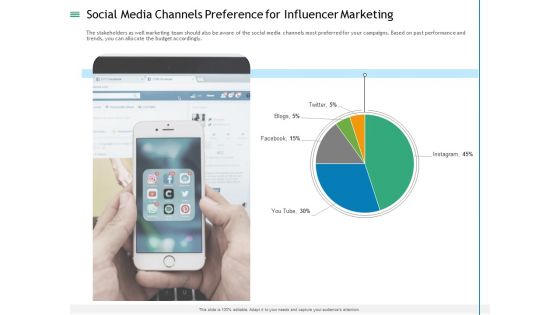
Measuring Influencer Marketing ROI Social Media Channels Preference For Influencer Marketing Sample PDF
The stakeholders as well marketing team should also be aware of the social media channels most preferred for your campaigns. Based on past performance and trends, you can allocate the budget accordingly. Deliver and pitch your topic in the best possible manner with this measuring influencer marketing roi social media channels preference for influencer marketing sample pdf. Use them to share invaluable insights on social media channels preference for influencer marketing and impress your audience. This template can be altered and modified as per your expectations. So, grab it now.

Partnership Management Strategies Kpi Dashboard To Measure Sales Performance Introduction PDF
Following slide illustrates sales performance monitoring dashboard. KPIs included in the dashboard are sales revenue, sales growth, average revenue per unit, customer lifetime value and customer acquisition cost.Deliver and pitch your topic in the best possible manner with this partnership management strategies kpi dashboard to measure sales performance introduction pdf Use them to share invaluable insights on average revenue, monthly sales growth, customer acquisition cost and impress your audience. This template can be altered and modified as per your expectations. So, grab it now.

Agile Software Development And Management IT Various Metrics To Measure Effectiveness Of Project Information PDF
This slide provides information regarding various metrics that considered essential in determine the effectiveness of project management for software development in terms of lead and cycle time, throughput and work in progress WIP and other metrics. Deliver and pitch your topic in the best possible manner with this agile software development and management it various metrics to measure effectiveness of project information pdf. Use them to share invaluable insights on lead and cycle time, throughput, work in progress and impress your audience. This template can be altered and modified as per your expectations. So, grab it now.

Satisfying Consumers Through Strategic Product Building Plan Measuring Affect Of Development Strategy Slides PDF
This slide covers the impact of product development strategies on product volume, revenues, sales, time to market, process and product quality with difference in relative profit growth. Deliver and pitch your topic in the best possible manner with this satisfying consumers through strategic product building plan measuring affect of development strategy slides pdf. Use them to share invaluable insights on product volumes, product revenues, product sales, time to market, process quality and impress your audience. This template can be altered and modified as per your expectations. So, grab it now.
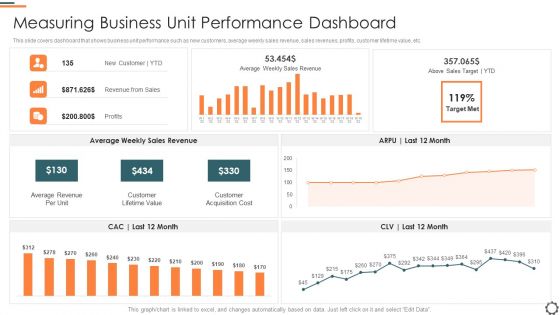
Agile Group For Product Development Measuring Business Unit Performance Dashboard Pictures PDF
This slide covers dashboard that shows business unit performance such as new customers, average weekly sales revenue, sales revenues, profits, customer lifetime value, etc. Deliver and pitch your topic in the best possible manner with this agile group for product development measuring business unit performance dashboard pictures pdf. Use them to share invaluable insights on average revenue per unit, customer lifetime value, customer acquisition cost and impress your audience. This template can be altered and modified as per your expectations. So, grab it now.

Maintaining Partner Relationships KPI Dashboard To Measure Sales Performance Rules PDF
Following slide illustrates sales performance monitoring dashboard. KPIs included in the dashboard are sales revenue, sales growth, average revenue per unit, customer lifetime value and customer acquisition cost. Deliver and pitch your topic in the best possible manner with this Maintaining Partner Relationships KPI Dashboard To Measure Sales Performance Rules PDF. Use them to share invaluable insights on Sales Country Performance, Above Sales Target, YTD, Customer Lifetime Value, Customer Acquisition Cost and impress your audience. This template can be altered and modified as per your expectations. So, grab it now.
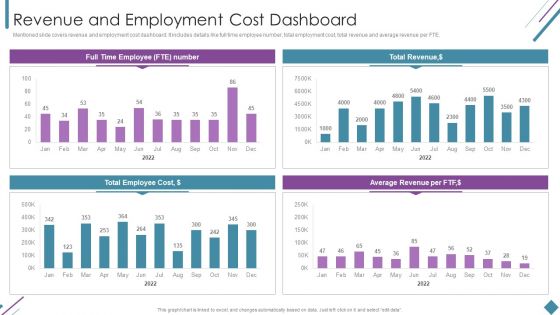
Metrics To Measure Business Performance Revenue And Employment Cost Dashboard Clipart PDF
Mentioned slide covers revenue and employment cost dashboard. It includes details like full time employee number, total employment cost, total revenue and average revenue per FTE. Deliver and pitch your topic in the best possible manner with this Metrics To Measure Business Performance Revenue And Employment Cost Dashboard Clipart PDF. Use them to share invaluable insights on Total Revenue, Average Revenue Per, Total Employee Cost and impress your audience. This template can be altered and modified as per your expectations. So, grab it now.

How To Measure Organic Growth Strategic Playbook For Internal Sales Advancement Slides PDF
Purpose of the following slide is to show multiple metrics that the organization can use to track performance of their organic growth strategies, these can be revenues generated, market penetration, increase in referral rate etc.Deliver and pitch your topic in the best possible manner with this How To Measure Organic Growth Strategic Playbook For Internal Sales Advancement Slides PDF. Use them to share invaluable insights on Expected Increase, Entering Geographies, Increase Percentage and impress your audience. This template can be altered and modified as per your expectations. So, grab it now.
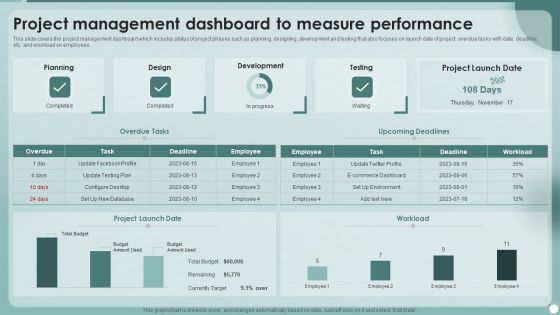
Strategies To Enhance Project Management Process Project Management Dashboard To Measure Performance Ideas PDF
This slide covers the project management dashboard which includes status of project phases such as planning, designing, development and testing that also focuses on launch date of project, overdue tasks with date, deadline, etc. and workload on employees. Deliver and pitch your topic in the best possible manner with this Strategies To Enhance Project Management Process Project Management Dashboard To Measure Performance Ideas PDF. Use them to share invaluable insights on Employee, Project Launch, Development, Design and impress your audience. This template can be altered and modified as per your expectations. So, grab it now.
IT System Risk Management Guide Security Criteria And Control Measures For IT System Vulnerabilities Icons PDF
This slide highlights the security criteria for information technology system vulnerabilities with security area which includes management security, operational security and technical security. The IT System Risk Management Guide Security Criteria And Control Measures For IT System Vulnerabilities Icons PDF is a compilation of the most recent design trends as a series of slides. It is suitable for any subject or industry presentation, containing attractive visuals and photo spots for businesses to clearly express their messages. This template contains a variety of slides for the user to input data, such as structures to contrast two elements, bullet points, and slides for written information. Slidegeeks is prepared to create an impression.
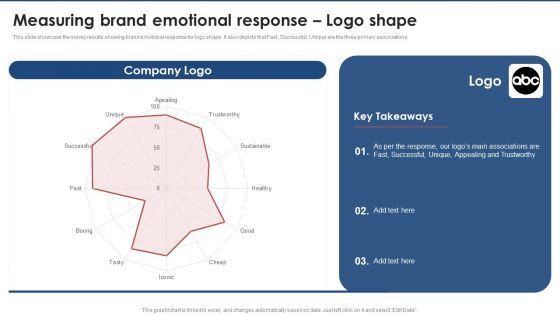
Measuring Brand Emotional Response Logo Shape Brand Value Estimation Guide Sample PDF
This slide showcase the survey results showing brand emotional response for logo shape. It also depicts that Fast, Successful, Unique are the three primary associations. The Measuring Brand Emotional Response Logo Shape Brand Value Estimation Guide Sample PDF is a compilation of the most recent design trends as a series of slides. It is suitable for any subject or industry presentation, containing attractive visuals and photo spots for businesses to clearly express their messages. This template contains a variety of slides for the user to input data, such as structures to contrast two elements, bullet points, and slides for written information. Slidegeeks is prepared to create an impression.
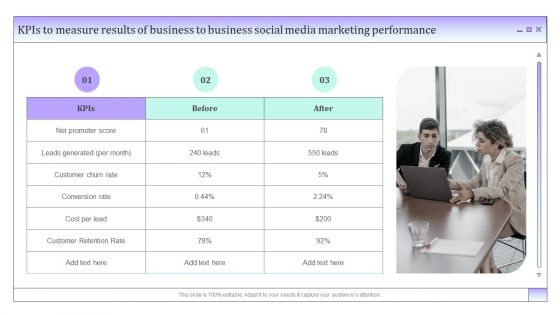
Kpis To Measure Results Of Business To Business Social Media Marketing Performance Clipart PDF
The Kpis To Measure Results Of Business To Business Social Media Marketing Performance Clipart PDF is a compilation of the most recent design trends as a series of slides. It is suitable for any subject or industry presentation, containing attractive visuals and photo spots for businesses to clearly express their messages. This template contains a variety of slides for the user to input data, such as structures to contrast two elements, bullet points, and slides for written information. Slidegeeks is prepared to create an impression.
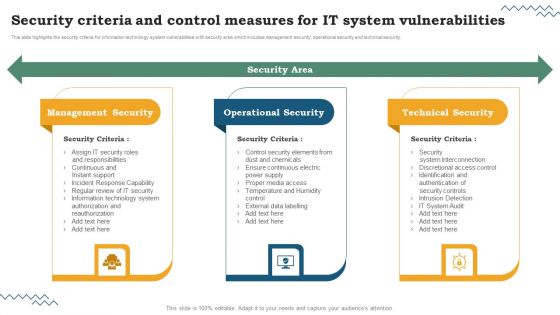
Software Development Life Cycle Planning Security Criteria And Control Measures For IT System Vulnerabilities Brochure PDF
This slide highlights the security criteria for information technology system vulnerabilities with security area which includes management security, operational security and technical security. The Software Development Life Cycle Planning Security Criteria And Control Measures For IT System Vulnerabilities Brochure PDF is a compilation of the most recent design trends as a series of slides. It is suitable for any subject or industry presentation, containing attractive visuals and photo spots for businesses to clearly express their messages. This template contains a variety of slides for the user to input data, such as structures to contrast two elements, bullet points, and slides for written information. Slidegeeks is prepared to create an impression.
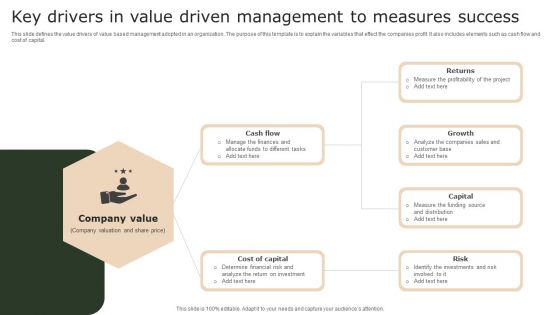
Key Drivers In Value Driven Management To Measures Success Rules PDF
This slide defines the value drivers of value based management adopted in an organization. The purpose of this template is to explain the variables that effect the companies profit. It also includes elements such as cash flow and cost of capital. Pitch your topic with ease and precision using this Key Drivers In Value Driven Management To Measures Success Rules PDF. This layout presents information on Cash Flow, Growth, Capital. It is also available for immediate download and adjustment. So, changes can be made in the color, design, graphics or any other component to create a unique layout.
Recruitment Marketing Strategies For NPO Business Kpis For Recruitment Performance Measurement In NPO Icons PDF
The Recruitment Marketing Strategies For NPO Business Kpis For Recruitment Performance Measurement In NPO Icons PDF is a compilation of the most recent design trends as a series of slides. It is suitable for any subject or industry presentation, containing attractive visuals and photo spots for businesses to clearly express their messages. This template contains a variety of slides for the user to input data, such as structures to contrast two elements, bullet points, and slides for written information. Slidegeeks is prepared to create an impression.

Identifying Potential Customer Segments Across Apples Brand Promotional Measures Sample Pdf
This slide provides information regarding customer segmentation that highlights the division of apple target customers in specified market into distinct groups such as teenager, college and university students, business professionals, and adults.The Identifying Potential Customer Segments Across Apples Brand Promotional Measures Sample Pdf is a compilation of the most recent design trends as a series of slides. It is suitable for any subject or industry presentation, containing attractive visuals and photo spots for businesses to clearly express their messages. This template contains a variety of slides for the user to input data, such as structures to contrast two elements, bullet points, and slides for written information. Slidegeeks is prepared to create an impression.
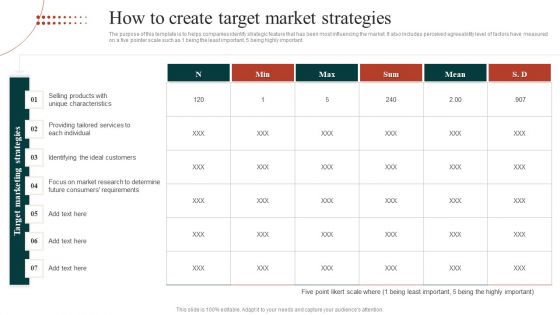
Target Marketing Techniques How To Create Target Market Strategies Clipart PDF
The purpose of this template is to helps companies identify strategic feature that has been most influencing the market. It also includes perceived agreeability level of factors have measured on a five pointer scale such as 1 being the least important, 5 being highly important. Slidegeeks is one of the best resources for PowerPoint templates. You can download easily and regulate Target Marketing Techniques How To Create Target Market Strategies Clipart PDF for your personal presentations from our wonderful collection. A few clicks is all it takes to discover and get the most relevant and appropriate templates. Use our Templates to add a unique zing and appeal to your presentation and meetings. All the slides are easy to edit and you can use them even for advertisement purposes.

Circular Network Diagram 6 Stages Business Plan For PowerPoint Slides
We present our circular network diagram 6 stages business plan for PowerPoint Slides.Download and present our Process and Flows PowerPoint Templates because Our PowerPoint Templates and Slides will definately Enhance the stature of your presentation. Adorn the beauty of your thoughts with their colourful backgrounds. Download and present our Business PowerPoint Templates because our PowerPoint Templates and Slides are the string of your bow. Fire of your ideas and conquer the podium. Use our Flow Charts PowerPoint Templates because You are well armed with penetrative ideas. Our PowerPoint Templates and Slides will provide the gunpowder you need. Use our Business PowerPoint Templates because Our PowerPoint Templates and Slides are designed to help you succeed. They have all the ingredients you need. Present our Shapes PowerPoint Templates because Our PowerPoint Templates and Slides ensures Effective communication. They help you put across your views with precision and clarity.Use these PowerPoint slides for presentations relating to Pie, chart, business, concept, success, icon, account, market, isolated, slice, economy, presentation, diagram, circle, wealth, percentage, graphic,finance, data, report, marketing, analyzing, accounting, partition, management, graph, illustration, earnings, piece, strategy, money, planning, growth, progress,profit, part, information, investment, improvement, statistic, financial, measure, six, savings, performance. The prominent colors used in the PowerPoint template are Red, Gray, White.
Circular Network Diagram 6 Stages Business Plan PowerPoint Slides
We present our circular network diagram 6 stages business plan PowerPoint Slides.Download our Circle Charts PowerPoint Templates because You have a driving passion to excel in your field. Our PowerPoint Templates and Slides will prove ideal vehicles for your ideas. Download our Business PowerPoint Templates because Our PowerPoint Templates and Slides are created with admirable insight. Use them and give your group a sense of your logical mind. Download and present our Process and Flows PowerPoint Templates because Our PowerPoint Templates and Slides will provide you the cutting edge. Slice through the doubts in the minds of your listeners. Present our Marketing PowerPoint Templates because Our PowerPoint Templates and Slides will fulfill your every need. Use them and effectively satisfy the desires of your audience. Present our Success PowerPoint Templates because Our PowerPoint Templates and Slides has conjured up a web of all you need with the help of our great team. Use them to string together your glistening ideas.Use these PowerPoint slides for presentations relating to Pie, chart, business, concept, success, icon, account, market, isolated, slice, economy, presentation, diagram, circle, wealth, percentage, graphic,finance, data, report, marketing, analyzing, accounting, partition, management, graph, illustration, earnings, piece, strategy, money, planning, growth, progress,profit, part, information, investment, improvement, statistic, financial, measure, six, savings, performance. The prominent colors used in the PowerPoint template are Gray, Purple, White.
3 Levels For Business Planning Process PowerPoint Slides
We present our 3 levels for business planning process PowerPoint Slides.Use our Business PowerPoint Templates because Our PowerPoint Templates and Slides help you pinpoint your timelines. Highlight the reasons for your deadlines with their use. Download and present our Process and Flows PowerPoint Templates because Our PowerPoint Templates and Slides will let your team Walk through your plans. See their energy levels rise as you show them the way. Download and present our Marketing PowerPoint Templates because Our PowerPoint Templates and Slides will let you Hit the target. Go the full distance with ease and elan. Use our Shapes PowerPoint Templates because You have a driving passion to excel in your field. Our PowerPoint Templates and Slides will prove ideal vehicles for your ideas. Use our Finance PowerPoint Templates because You are working at that stage with an air of royalty. Let our PowerPoint Templates and Slides be the jewels in your crown.Use these PowerPoint slides for presentations relating to Mission, statement, responsibility, plan, business, operation, vision, executive, process, priority, tactics, strategic, model, target, framework, success,representation, competitor, marketing, management, manage, project, objective, prioritize, summary, prioritizing, pyramid, competition, decision, commerce,successful,resource, financial, organizations, measure, action, product, performance. The prominent colors used in the PowerPoint template are Blue, Gray, White.
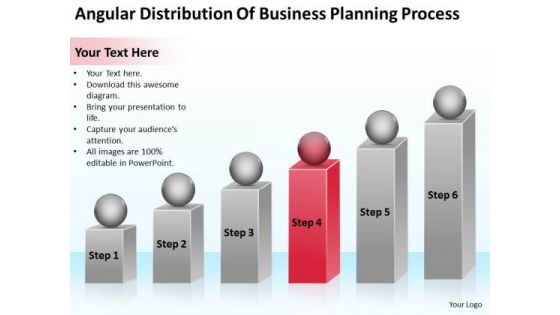
Distribution Of Business Planning Process Sample Plans Free PowerPoint Slides
We present our distribution of business planning process sample plans free PowerPoint Slides.Use our Process and Flows PowerPoint Templates because Our PowerPoint Templates and Slides will steer your racing mind. Hit the right buttons and spur on your audience. Use our Flow Charts PowerPoint Templates because You can Create a matrix with our PowerPoint Templates and Slides. Feel the strength of your ideas click into place. Use our Marketing PowerPoint Templates because Our PowerPoint Templates and Slides will let you Leave a lasting impression to your audiences. They possess an inherent longstanding recall factor. Present our Spheres PowerPoint Templates because You can Bask in the warmth of our PowerPoint Templates and Slides. Enjoy the heartfelt glowing response of your listeners. Use our Shapes PowerPoint Templates because Our PowerPoint Templates and Slides will give you great value for your money. Be assured of finding the best projection to highlight your words. Use these PowerPoint slides for presentations relating to Diagram, chart, market, statistics, square, grow, infograph, bar, corporate, red, business, vector, success, presentation, growing, circle, finance,analyst, goal, report, marketing, different, accounting, management, graph, illustration, geometric, sphere, design, growth, infographic, progress, profit,information, increase, aim, analyze, financial, rising, measure, block. The prominent colors used in the PowerPoint template are Red, Gray, White.

Top Business People 3d Man On Blue Bar Graph PowerPoint Slides
We present our top business people 3d man on blue bar graph PowerPoint Slides.Download our People PowerPoint Templates because You can Zap them with our PowerPoint Templates and Slides. See them reel under the impact. Use our Business PowerPoint Templates because you can Add colour to your speech with our PowerPoint Templates and Slides. Your presentation will leave your audience speechless. Download our Process and Flows PowerPoint Templates because Our PowerPoint Templates and Slides will Activate the energies of your audience. Get their creative juices flowing with your words. Download our Arrows PowerPoint Templates because Our PowerPoint Templates and Slides provide you with a vast range of viable options. Select the appropriate ones and just fill in your text. Download and present our Computer PowerPoint Templates because It is Aesthetically crafted by artistic young minds. Our PowerPoint Templates and Slides are designed to display your dexterity.Use these PowerPoint slides for presentations relating to 3d, achievement, analyst, arrow, background, bar, business, businessman, chart,communication, computer, comunication, concept, diagram, equipment, finance,financial, future, graph, graphic, grow, growth, human, icon, improve, income,increase, internet, isolated, laptop, man, market, measure, people, professional,profit, progress, rate, sales, sign, siting, statistic, success, symbol, technology, up,win, winner, work, worker. The prominent colors used in the PowerPoint template are Red, Blue, White.
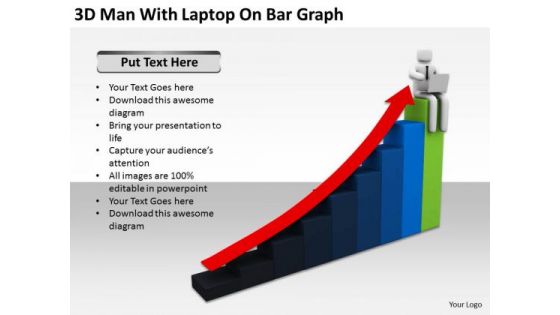
Business People Pictures 3d Man With Laptop On Bar Graph PowerPoint Slides
We present our business people pictures 3d man with laptop on bar graph PowerPoint Slides.Use our Arrows PowerPoint Templates because Our PowerPoint Templates and Slides are created by a hardworking bunch of busybees. Always flitting around with solutions gauranteed to please. Download our Business PowerPoint Templates because Our PowerPoint Templates and Slides are created with admirable insight. Use them and give your group a sense of your logical mind. Download and present our Success PowerPoint Templates because our PowerPoint Templates and Slides will give your ideas the shape. Use our Shapes PowerPoint Templates because Our PowerPoint Templates and Slides will let Your superior ideas hit the target always and everytime. Present our Technology PowerPoint Templates because Our PowerPoint Templates and Slides offer you the needful to organise your thoughts. Use them to list out your views in a logical sequence.Use these PowerPoint slides for presentations relating to 3d, Achievement, Analyst, Arrow, Background, Bar, Business, Businessman, Chart, Communication, Computer, Comunication, Concept, Diagram, Equipment, Finance, Financial, Future, Graph, Graphic, Grow, Growth, Human, Icon, Improve, Income, Increase, Internet, Isolated, Laptop, Man, Market, Measure, People, Professional, Profit, Progress, Rate, Sales, Sign, Siting, Statistic, Success, Symbol, Technology, Up, Win, Winner, Work, Worker. The prominent colors used in the PowerPoint template are Red, Green, Gray.

Circular Network Diagram 6 Stages Sales Business Plan Outline PowerPoint Slides
We present our circular network diagram 6 stages sales business plan outline PowerPoint Slides.Download our Process and Flows PowerPoint Templates because You can Zap them with our PowerPoint Templates and Slides. See them reel under the impact. Download and present our Business PowerPoint Templates because You have the co-ordinates for your destination of success. Let our PowerPoint Templates and Slides map out your journey. Present our Marketing PowerPoint Templates because Our PowerPoint Templates and Slides are aesthetically designed to attract attention. We gaurantee that they will grab all the eyeballs you need. Use our Business PowerPoint Templates because You can Be the star of the show with our PowerPoint Templates and Slides. Rock the stage with your ideas. Use our Success PowerPoint Templates because You are an avid believer in ethical practices. Highlight the benefits that accrue with our PowerPoint Templates and Slides.Use these PowerPoint slides for presentations relating to Pie, chart, business, concept, success, icon, account, market, isolated, slice, economy, presentation, diagram, circle, wealth, percentage, graphic,finance, data, report, marketing, analyzing, accounting, partition, management, graph, illustration, earnings, piece, strategy, money, planning, growth, progress,profit, part, information, investment, improvement, statistic, financial, measure, six, savings, performance. The prominent colors used in the PowerPoint template are Green lime, White, Gray.
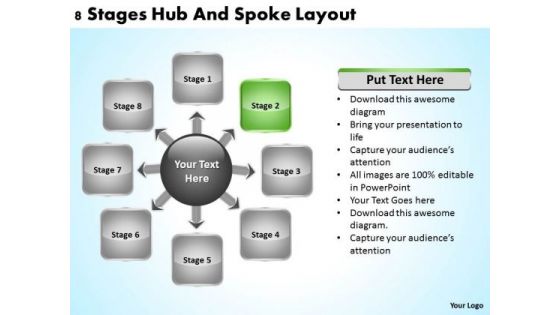
Business Development Process Flowchart 8 Stages Hub And Spoke Layout Ppt PowerPoint Slides
We present our business development process flowchart 8 stages hub and spoke layout ppt PowerPoint Slides.Present our Technology PowerPoint Templates because You are well armed with penetrative ideas. Our PowerPoint Templates and Slides will provide the gunpowder you need. Download our Process and Flows PowerPoint Templates because Watching this your Audience will Grab their eyeballs, they wont even blink. Present our Boxes PowerPoint Templates because It will Give impetus to the hopes of your colleagues. Our PowerPoint Templates and Slides will aid you in winning their trust. Use our Business PowerPoint Templates because It will let you Set new benchmarks with our PowerPoint Templates and Slides. They will keep your prospects well above par. Use our Arrows PowerPoint Templates because It will let you Set new benchmarks with our PowerPoint Templates and Slides. They will keep your prospects well above par.Use these PowerPoint slides for presentations relating to 3d, Abstract, Algorithm, Arrow, Background, Blank, Block, Box, Business, Chain, Chart, Circle, Colorful, Concept, Connect, Connection, Corporate, Design, Diagram, Empty, Flow, Flowchart, Graph, Graphic, Hierarchy, Illustration, Information, Isolated, Management, Network, Organization, Organization, Organize, Plan, Procedure, Process, Program, Scalable, Shape, Sign, Solution, Structure, Symbol, Teamwork, Technology. The prominent colors used in the PowerPoint template are Green, Gray, Black.
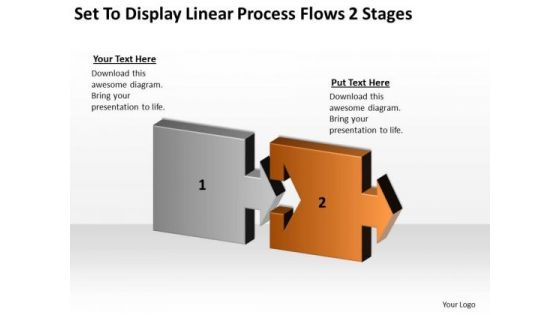
Set To Display Linear Process Flows 2 Stages Ppt Business Plan Writers PowerPoint Slides
We present our set to display linear process flows 2 stages ppt business plan writers PowerPoint Slides.Download our Finance PowerPoint Templates because Our PowerPoint Templates and Slides are Clear and concise. Use them and dispel any doubts your team may have. Download our Advertising PowerPoint Templates because You have gained great respect for your brilliant ideas. Use our PowerPoint Templates and Slides to strengthen and enhance your reputation. Download and present our Arrows PowerPoint Templates because Our PowerPoint Templates and Slides are the chords of your song. String them along and provide the lilt to your views. Download and present our Business PowerPoint Templates because our PowerPoint Templates and Slides will give your ideas the shape. Use our Process and Flows PowerPoint Templates because They will bring a lot to the table. Their alluring flavours will make your audience salivate.Use these PowerPoint slides for presentations relating to Chart, flow, diagram, process, flowchart, organization, vector, business, arrow, section, linear, model, segment, process flow, program, kind of diagram, arrow chart, process diagram, plan, chart, sign, algorithm, symbol, process arrows, element, block diagram, development, management, graph, connection, flow chart, strategy, solution, design, direction, process chart, linear diagram, set, workflow diagram, flow diagram. The prominent colors used in the PowerPoint template are Orange, Gray, Black.
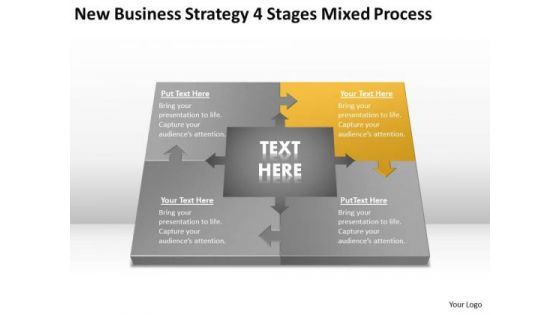
Work Flow Business Process Diagram Strategy 4 Stages Mixed Ppt PowerPoint Slides
We present our work flow business process diagram strategy 4 stages mixed ppt PowerPoint Slides.Download and present our Leadership PowerPoint Templates because Our PowerPoint Templates and Slides are focused like a searchlight beam. They highlight your ideas for your target audience. Download our Marketing PowerPoint Templates because You can Create a matrix with our PowerPoint Templates and Slides. Feel the strength of your ideas click into place. Use our Boxes PowerPoint Templates because Our PowerPoint Templates and Slides are innately eco-friendly. Their high recall value negate the need for paper handouts. Download our Arrows PowerPoint Templates because It will get your audience in sync. Download our Shapes PowerPoint Templates because Our PowerPoint Templates and Slides will fulfill your every need. Use them and effectively satisfy the desires of your audience.Use these PowerPoint slides for presentations relating to Chart, flow, process, graph, flowchart, vector, arrow, diagram, organization, model, segment, process flow, vibrant, program, kind of diagram, business, process diagram, plan, workflow chart, sign, algorithm, symbol, process arrows, element, block diagram, development, abstract, management, connection, flow chart, strategy, linear, section, solution, process chart, direction, design, linear diagram, set, module, workflow diagram, flow diagram, block, main chain. The prominent colors used in the PowerPoint template are Yellow, Gray, White.
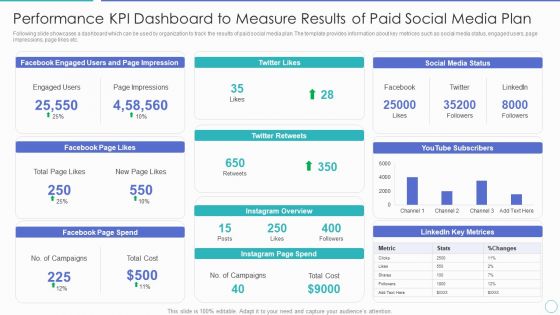
Performance KPI Dashboard To Measure Results Of Paid Social Media Plan Ppt PowerPoint Presentation Gallery Format Ideas PDF
Following slide showcases a dashboard which can be used by organization to track the results of paid social media plan. The template provides information about key metrices such as social media status, engaged users, page impressions, page likes etc. Pitch your topic with ease and precision using this performance kpi dashboard to measure results of paid social media plan ppt powerpoint presentation gallery format ideas pdf. This layout presents information on social media status, instagram page spend, facebook page spend, facebook page likes. It is also available for immediate download and adjustment. So, changes can be made in the color, design, graphics or any other component to create a unique layout.

Effective Data Management To Make Information Accessible Process Step 4 Transform Data Slides PDF
This slide shows the fourth step that is involved in the data preparation process i.e. transform data along with the details.This is a Effective Data Management To Make Information Accessible Process Step 4 Transform Data Slides PDF template with various stages. Focus and dispense information on six stages using this creative set, that comes with editable features. It contains large content boxes to add your information on topics like Data Determines, Consistent Mathematical, Research Project You can also showcase facts, figures, and other relevant content using this PPT layout. Grab it now.
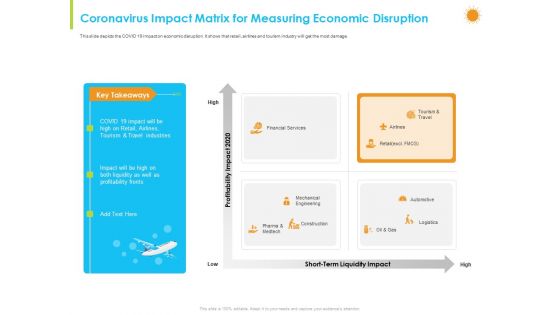
How Aviation Industry Coping With COVID 19 Pandemic Coronavirus Impact Matrix For Measuring Economic Disruption Slides PDF
This slide depicts the COVID 19 impact on economic disruption. It shows that retail, airlines and tourism industry will get the most damage.This is a how aviation industry coping with COVID 19 pandemic coronavirus impact matrix for measuring economic disruption slides pdf. template with various stages. Focus and dispense information on four stages using this creative set, that comes with editable features. It contains large content boxes to add your information on topics like financial services, mechanical engineering, pharma and medtech, construction, logistics. You can also showcase facts, figures, and other relevant content using this PPT layout. Grab it now.
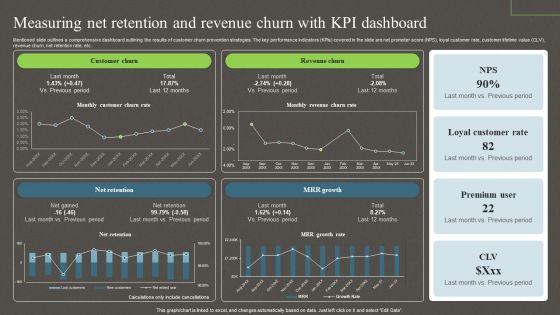
Measuring Net Retention And Revenue Churn With Kpi Dashboard Ppt PowerPoint Presentation File Backgrounds PDF
Mentioned slide outlines a comprehensive dashboard outlining the results of customer churn prevention strategies. The key performance indicators KPIs covered in the slide are net promoter score NPS, loyal customer rate, customer lifetime value CLV, revenue churn, net retention rate, etc. Boost your pitch with our creative Measuring Net Retention And Revenue Churn With Kpi Dashboard Ppt PowerPoint Presentation File Backgrounds PDF. Deliver an awe inspiring pitch that will mesmerize everyone. Using these presentation templates you will surely catch everyones attention. You can browse the ppts collection on our website. We have researchers who are experts at creating the right content for the templates. So you do not have to invest time in any additional work. Just grab the template now and use them.

Horizontal Structure For Business Plans Ppt Proposal Examples PowerPoint Slides
We present our horizontal structure for business plans ppt proposal examples PowerPoint Slides.Download and present our Business PowerPoint Templates because You can Be the puppeteer with our PowerPoint Templates and Slides as your strings. Lead your team through the steps of your script. Use our Flow Charts PowerPoint Templates because It will get your audience in sync. Use our Shapes PowerPoint Templates because Our PowerPoint Templates and Slides will bullet point your ideas. See them fall into place one by one. Present our Marketing PowerPoint Templates because You can Inspire your team with our PowerPoint Templates and Slides. Let the force of your ideas flow into their minds. Download our Process and Flows PowerPoint Templates because you should once Tap the ingenuity of our PowerPoint Templates and Slides. They are programmed to succeed.Use these PowerPoint slides for presentations relating to Mark, corporate, business, plan, concept, bright, symbol, diagram, crayon, stack, graphic, finance, stock,analysis, drawing, paint, calculation, accounting, creative, economic, creativity, chart, forecast, design, color, objects, stationary, pencil, education,profit, information, background, investment, figures, rainbow, business, business process. The prominent colors used in the PowerPoint template are Blue, Red, Black.
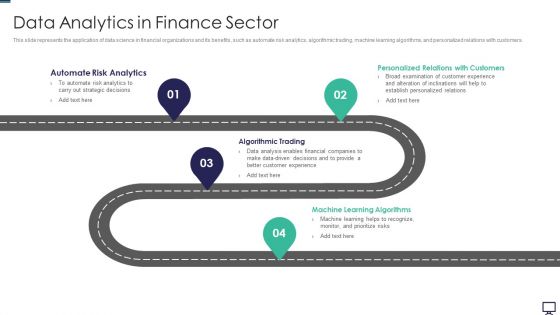
Data Analytics In Finance Sector Ppt Pictures Mockup PDF
This slide represents the application of data science in financial organizations and its benefits, such as automate risk analytics, algorithmic trading, machine learning algorithms, and personalized relations with customers. This is a data analytics in finance sector ppt pictures mockup pdf template with various stages. Focus and dispense information on four stages using this creative set, that comes with editable features. It contains large content boxes to add your information on topics like customer, strategic, analytics. You can also showcase facts, figures, and other relevant content using this PPT layout. Grab it now.
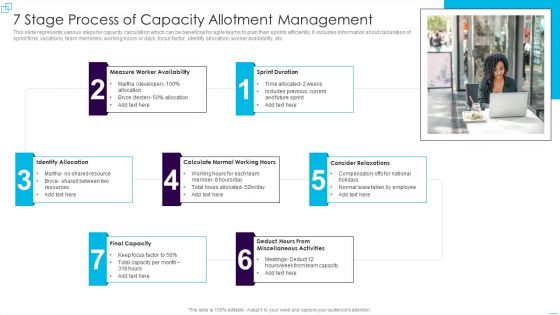
7 Stage Process Of Capacity Allotment Management Diagrams PDF
This slide represents various steps for capacity calculation which can be beneficial for agile teams to plan their sprints efficiently. It includes information about calculation of sprint time, vacations, team members, working hours or days, focus factor, identify allocation, worker availability, etc. Presenting 7 Stage Process Of Capacity Allotment Management Diagrams PDF to dispense important information. This template comprises seven stages. It also presents valuable insights into the topics including Identify Allocation, Consider Relaxations, Measure Worker Availability. This is a completely customizable PowerPoint theme that can be put to use immediately. So, download it and address the topic impactfully.
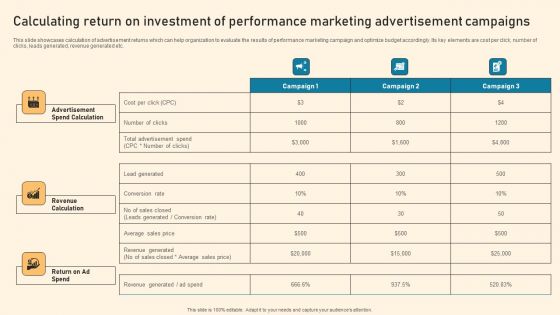
Calculating Return On Investment Of Performance Marketing Advertisement Campaigns Ppt PowerPoint Presentation Diagram Lists PDF
This slide showcases calculation of advertisement returns which can help organization to evaluate the results of performance marketing campaign and optimize budget accordingly. Its key elements are cost per click, number of clicks, leads generated, revenue generated etc. Do you have to make sure that everyone on your team knows about any specific topic I yes, then you should give Calculating Return On Investment Of Performance Marketing Advertisement Campaigns Ppt PowerPoint Presentation Diagram Lists PDF a try. Our experts have put a lot of knowledge and effort into creating this impeccable Calculating Return On Investment Of Performance Marketing Advertisement Campaigns Ppt PowerPoint Presentation Diagram Lists PDF. You can use this template for your upcoming presentations, as the slides are perfect to represent even the tiniest detail. You can download these templates from the Slidegeeks website and these are easy to edit. So grab these today.

Agile Product Life Process Management Metrics To Measure Product Success By Balancing Innovation And Evolution Portrait PDF
This slide focuses on metrics to measure product success by balancing innovation and evolution such as return on investment, active users, sessions per user, net profit, revenue growth rate, bounce rate, etc. Presenting agile product life process management metrics to measure product success by balancing innovation and evolution portrait pdf to provide visual cues and insights. Share and navigate important information on one stages that need your due attention. This template can be used to pitch topics like metrics to measure product success by balancing innovation and evolution . In addtion, this PPT design contains high resolution images, graphics, etc, that are easily editable and available for immediate download.

Assuring Management In Product Innovation To Enhance Processes Steps For Product Manager To Measure Business Clipart PDF
This slide shows steps for product manager to measure business performance such as building OKR culture and invite experimentation, developing KPIs to complement OKRs and fostering continuous improvement.This is a assuring management in product innovation to enhance processes steps for product manager to measure business clipart pdf template with various stages. Focus and dispense information on three stages using this creative set, that comes with editable features. It contains large content boxes to add your information on topics like create metrics culture, focus on improving, fostering continuous improvement You can also showcase facts, figures, and other relevant content using this PPT layout. Grab it now.
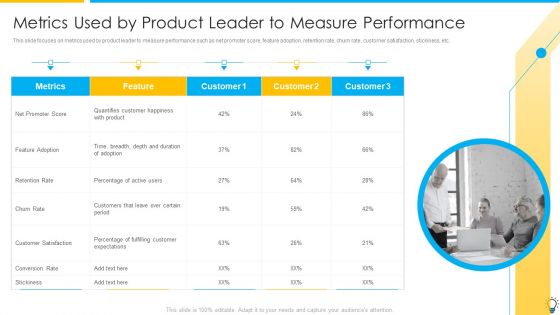
Assuring Management In Product Innovation To Enhance Processes Metrics Used By Product Leader To Measure Performance Diagrams PDF
This slide focuses on metrics used by product leader to measure performance such as net promoter score, feature adoption, retention rate, churn rate, customer satisfaction, stickiness, etc.Presenting assuring management in product innovation to enhance processes metrics used by product leader to measure performance diagrams pdf to provide visual cues and insights. Share and navigate important information on one stage that need your due attention. This template can be used to pitch topics like percentage of fulfilling, customers that leave, quantifies customer happiness In addtion, this PPT design contains high resolution images, graphics, etc, that are easily editable and available for immediate download.

Assuring Management In Product Innovation To Enhance Processes Metrics Used To Measure Product Team Performance Structure PDF
This slide represents metrics used to measure product team performance that covers product stickiness and usage, feature adoption and retention, net promoter score, product delivery predictability, etc.This is a assuring management in product innovation to enhance processes metrics used to measure product team performance structure pdf template with various stages. Focus and dispense information on five stages using this creative set, that comes with editable features. It contains large content boxes to add your information on topics like product stickiness, feature adoption, leading indicators You can also showcase facts, figures, and other relevant content using this PPT layout. Grab it now.

 Home
Home