Marketing Kpi
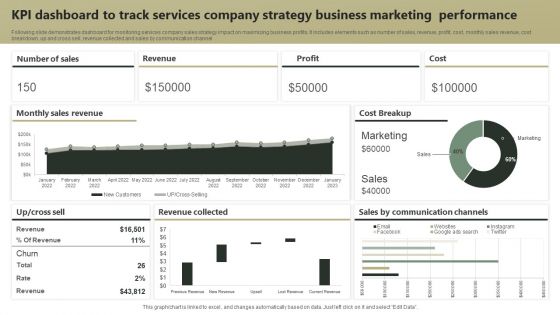
KPI Dashboard To Track Services Company Strategy Business Marketing Performance Guidelines PDF
Following slide demonstrates dashboard for monitoring services company sales strategy impact on maximizing business profits. It includes elements such as number of sales, revenue, profit, cost, monthly sales revenue, cost breakdown, up and cross sell, revenue collected and sales by communication channel. Showcasing this set of slides titled KPI Dashboard To Track Services Company Strategy Business Marketing Performance Guidelines PDF. The topics addressed in these templates are Revenue, Profit, Cost. All the content presented in this PPT design is completely editable. Download it and make adjustments in color, background, font etc. as per your unique business setting.
Kpi Dashboard For Tracking Social Media Campaign Results Powerful Marketing Techniques Strategy SS V
This slide covers the dashboard for analyzing social media marketing campaigns. It includes metrics such as tweets, followers, followings, listed favorites, reach, views, Facebook engagement, clicks, likes, Instagram photos, etc. This Kpi Dashboard For Tracking Social Media Campaign Results Powerful Marketing Techniques Strategy SS V from Slidegeeks makes it easy to present information on your topic with precision. It provides customization options, so you can make changes to the colors, design, graphics, or any other component to create a unique layout. It is also available for immediate download, so you can begin using it right away. Slidegeeks has done good research to ensure that you have everything you need to make your presentation stand out. Make a name out there for a brilliant performance.

Niche Marketing Guide To Target Specific Customer Groups Micromarketing ROI Assessment With KPI Structure PDF
The following slide showcases key metrics to assess micromarketing return on investment to determine profitability and efficiency. It includes elements such as total revenue, cost per acquisition, marketing spend, leads, profit per acquisition etc. Find a pre designed and impeccable Niche Marketing Guide To Target Specific Customer Groups Micromarketing ROI Assessment With KPI Structure PDF. The templates can ace your presentation without additional effort. You can download these easy to edit presentation templates to make your presentation stand out from others. So, what are you waiting for Download the template from Slidegeeks today and give a unique touch to your presentation.
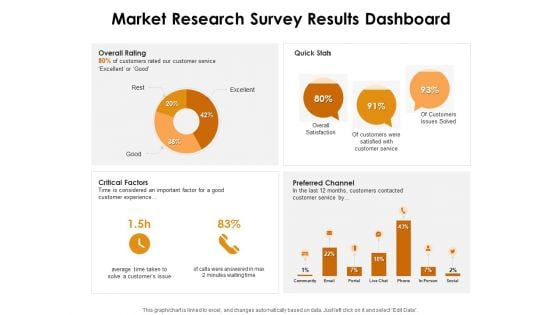
KPI Dashboards Per Industry Market Research Survey Results Dashboard Ppt PowerPoint Presentation Infographic Template Layout Ideas PDF
Deliver and pitch your topic in the best possible manner with this kpi dashboards per industry market research survey results dashboard ppt powerpoint presentation infographic template layout ideas pdf. Use them to share invaluable insights on overall rating, quick stats, critical factors, preferred channel and impress your audience. This template can be altered and modified as per your expectations. So, grab it now.
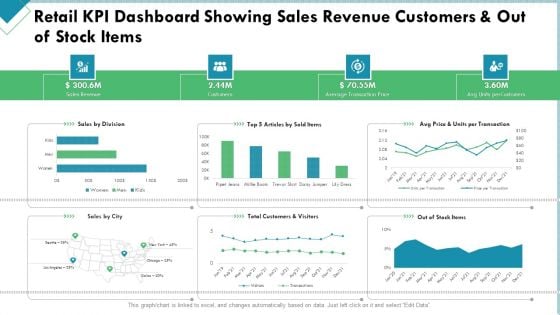
Market Analysis Of Retail Sector Retail KPI Dashboard Showing Sales Revenue Customers And Out Of Stock Items Structure PDF
Deliver and pitch your topic in the best possible manner with this market analysis of retail sector retail kpi dashboard showing sales revenue customers and out of stock items structure pdf. Use them to share invaluable insights on sales revenue, customers, average transaction price and impress your audience. This template can be altered and modified as per your expectations. So, grab it now.
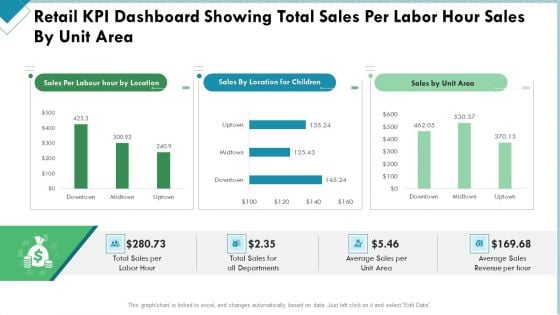
Market Analysis Of Retail Sector Retail KPI Dashboard Showing Total Sales Per Labor Hour Sales By Unit Area Themes PDF
Deliver an awe inspiring pitch with this creative market analysis of retail sector retail kpi dashboard showing total sales per labor hour sales by unit area themes pdf bundle. Topics like sales, revenue, average, departments can be discussed with this completely editable template. It is available for immediate download depending on the needs and requirements of the user.
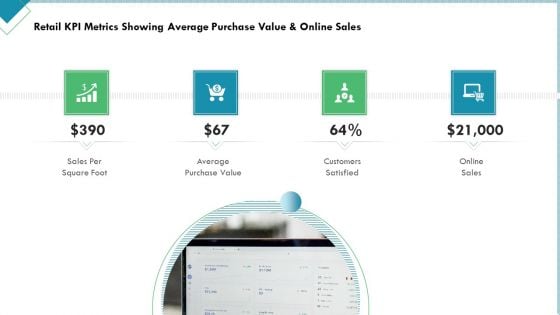
Market Analysis Of Retail Sector Retail KPI Metrics Showing Average Purchase Value And Online Sales Information PDF
Presenting market analysis of retail sector retail kpi metrics showing average purchase value and online sales information pdf to provide visual cues and insights. Share and navigate important information on four stages that need your due attention. This template can be used to pitch topics like sales per square foot, average purchase value, customers satisfied, online sales. In addtion, this PPT design contains high resolution images, graphics, etc, that are easily editable and available for immediate download.
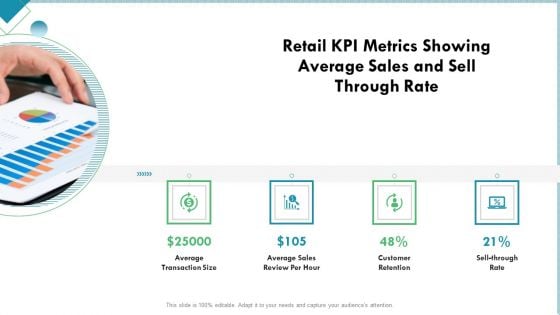
Market Analysis Of Retail Sector Retail KPI Metrics Showing Average Sales And Sell Through Rate Clipart PDF
This is a market analysis of retail sector retail kpi metrics showing average sales and sell through rate clipart pdf template with various stages. Focus and dispense information on four stages using this creative set, that comes with editable features. It contains large content boxes to add your information on topics like average transaction size, average sales review per hour, customer retention, sell through rate. You can also showcase facts, figures, and other relevant content using this PPT layout. Grab it now.

Marketers Guide To Data Analysis Optimization Social Media Analytics KPI Dashboard Clipart PDF
This slide covers a dashboard for tracking social media KPIs such as face engagements, total likes, followers, audience growth, YouTube subscribers, views, Instagram reach and , likes, LinkedIn impressions, etc. Find a pre designed and impeccable Marketers Guide To Data Analysis Optimization Social Media Analytics KPI Dashboard Clipart PDF. The templates can ace your presentation without additional effort. You can download these easy to edit presentation templates to make your presentation stand out from others. So, what are you waiting for Download the template from Slidegeeks today and give a unique touch to your presentation.
Marketers Guide To Data Analysis Optimization Website Landing Page KPI Tracking Dashboard Information PDF
This slide covers a dashboard for analyzing the metrics of the website landing page. It includes KPIs such as conversions, conversion rate, sessions, bounce rate, engagement sickness, etc. Present like a pro with Marketers Guide To Data Analysis Optimization Website Landing Page KPI Tracking Dashboard Information PDF Create beautiful presentations together with your team, using our easy to use presentation slides. Share your ideas in real time and make changes on the fly by downloading our templates. So whether you are in the office, on the go, or in a remote location, you can stay in sync with your team and present your ideas with confidence. With Slidegeeks presentation got a whole lot easier. Grab these presentations today.
Kpi Tracker Ppt Slides
This is a kpi tracker ppt slides. This is a three stage process. The stages in this process are total calls attempted, successful, no answer, call busy, disconnected, wrong number, unavailable, not interested, demo booked.
Kpi And Dashboard Kpi Dashboards Ppt PowerPoint Presentation Layouts
This is a kpi and dashboard kpi dashboards ppt powerpoint presentation layouts. This is a two stage process. The stages in this process are finance, strategy, analysis, marketing.

Engineering Kpi Examples Ppt Slides
This is an engineering kpi examples ppt slides. This is a four stage process. The stages in this process are strategize, innovate, measure, propagate.
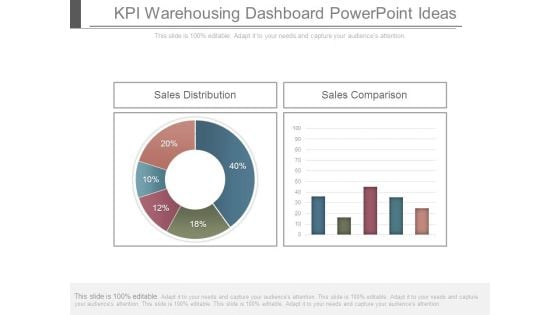
Kpi Warehousing Dashboard Powerpoint Ideas
This is a kpi warehousing dashboard powerpoint ideas. This is a two stage process. The stages in this process are sales distribution, sales comparison.
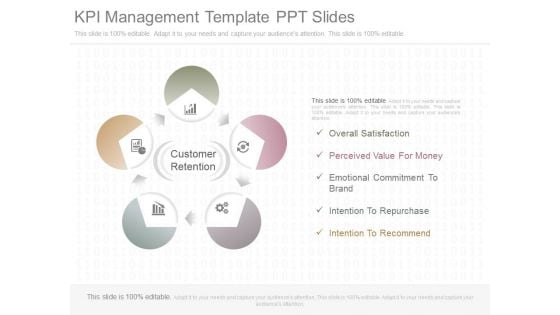
Kpi Management Template Ppt Slides
This is a kpi management template ppt slides. This is a five stage process. The stages in this process are overall satisfaction, perceived value for money, emotional commitment to brand, intention to repurchase, intention to recommend, customer retention.
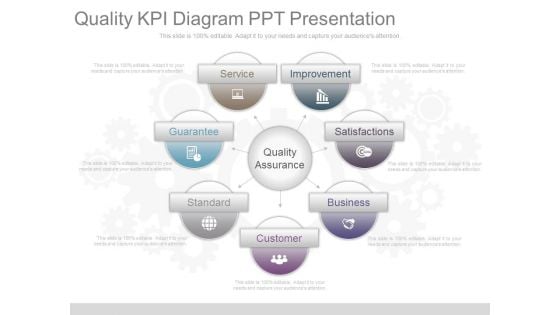
Quality Kpi Diagram Ppt Presentation
This is a quality kpi diagram ppt presentation. This is a seven stage process. The stages in this process are improvement, satisfactions, business, customer, standard, guarantee, service, quality assurance.
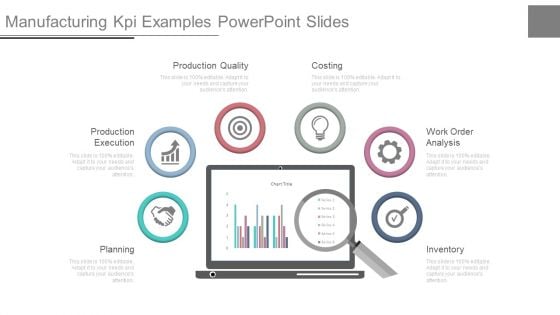
Manufacturing Kpi Examples Powerpoint Slides
This is a manufacturing kpi examples powerpoint slides. This is a six stage process. The stages in this process are planning, production execution, production quality, costing, work order analysis, inventory.

Communication KPI Dashboard With KPI Comparison Ideas PDF
Pitch your topic with ease and precision using this Communication KPI Dashboard With KPI Comparison Ideas PDF This layout presents information on Increase In Brand, Employees Knowledge, Vision Statement It is also available for immediate download and adjustment. So, changes can be made in the color, design, graphics or any other component to create a unique layout.
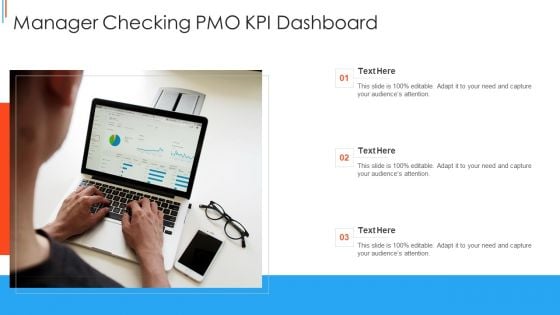
Manager Checking PMO KPI Dashboard Mockup PDF
Persuade your audience using this Manager Checking PMO KPI Dashboard Mockup PDF This PPT design covers three stages, thus making it a great tool to use. It also caters to a variety of topics including Manager Checking, Pmo Kpi Dashboard Download this PPT design now to present a convincing pitch that not only emphasizes the topic but also showcases your presentation skills.
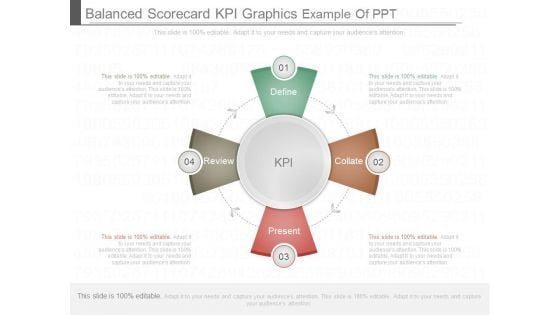
Balanced Scorecard Kpi Graphics Example Of Ppt
This is a balanced scorecard kpi graphics example of ppt. This is a four stage process. The stages in this process are define, review, present, collate. Kpi.
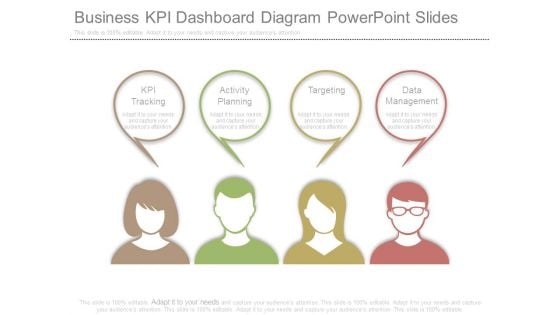
Business Kpi Dashboard Diagram Powerpoint Slides
This is a business kpi dashboard diagram powerpoint slides. This is a four stage process. The stages in this process are kpi tracking, activity planning, targeting, data management.
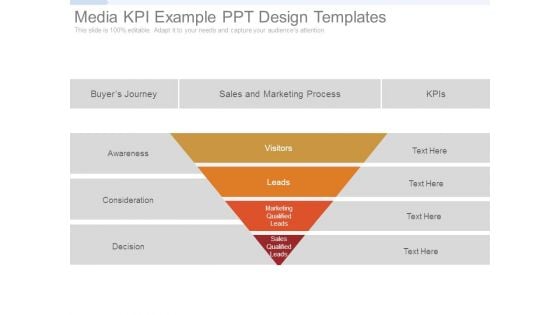
Media Kpi Example Ppt Design Templates
This is a media kpi example ppt design templates. This is a four stage process. The stages in this process are awareness, consideration, decision, visitors, leads, buyer journey, sales and marketing process, kpis, marketing qualified leads, sales qualified leads.
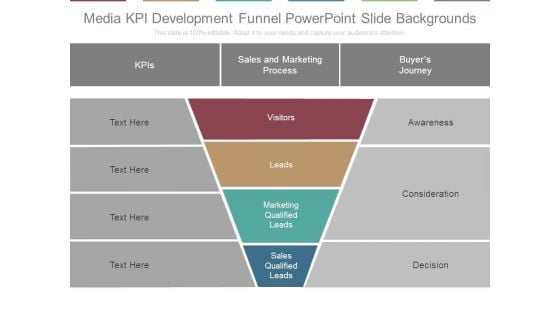
Media Kpi Development Funnel Powerpoint Slide Backgrounds
This is a media kpi development funnel powerpoint slide backgrounds. This is a four stage process. The stages in this process are kpis, sales and marketing process, buyers journey, awareness, consideration, decision, visitors, leads, marketing qualified leads, sales qualified leads.
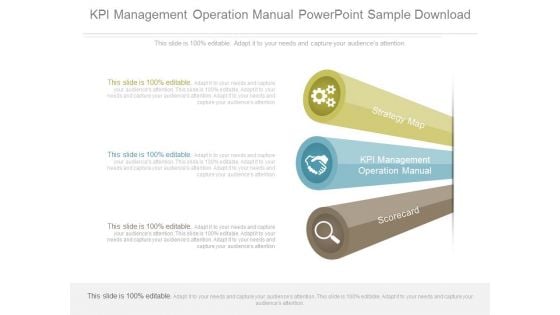
Kpi Management Operation Manual Powerpoint Sample Download
This is a kpi management operation manual powerpoint sample download. This is a three stage process. The stages in this process are strategy map, kpi management operation manual, scorecard.

Incremental Sales Kpi Measures Presentation Backgrounds
This is a incremental sales kpi measures presentation backgrounds. This is a four stage process. The stages in this process are marketing, promotion, sales revenue, social channels.
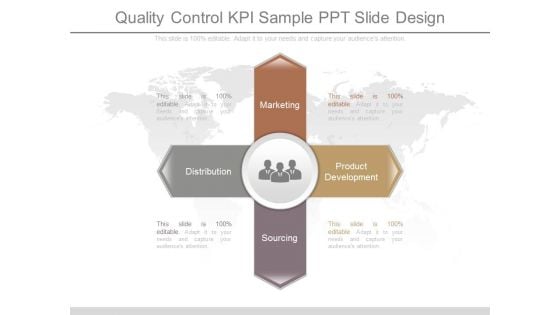
Quality Control Kpi Sample Ppt Slide Design
This is a quality control kpi sample ppt slide design. This is a four stage process. The stages in this process are marketing, distribution, product development, sourcing.
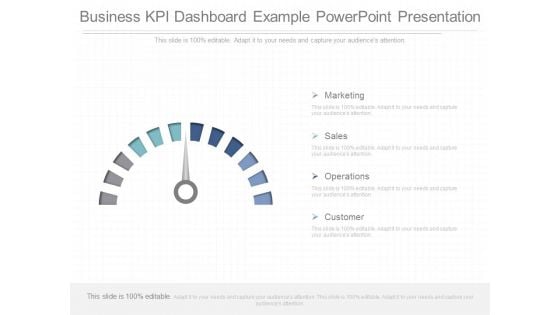
Business Kpi Dashboard Example Powerpoint Presentation
This is a business kpi dashboard example powerpoint presentation. This is a four stage process. The stages in this process are marketing, sales, operations, customer.
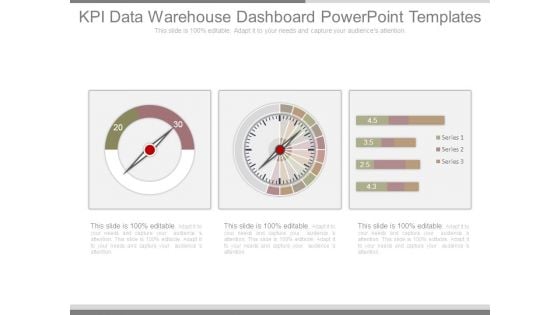
Kpi Data Warehouse Dashboard Powerpoint Templates
This is a kpi data warehouse dashboard powerpoint templates. This is a three stage process. The stages in this process are process, marketing, dashboard, business.
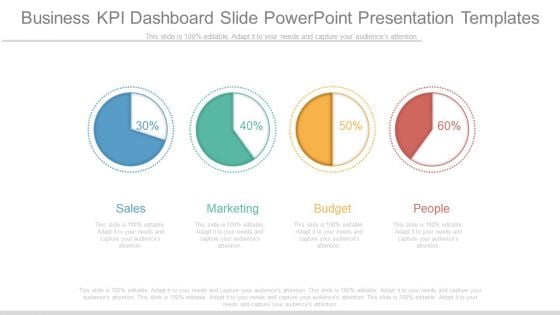
Business Kpi Dashboard Slide Powerpoint Presentation Templates
This is a business kpi dashboard slide powerpoint presentation templates. This is a four stage process. The stages in this process are sales, marketing, budget, people.
Kpi With Business Planning Presentation Pictures
This is a kpi with business planning presentation pictures. This is a eight stage process. The stages in this process are marketing, business, management.

Sample Kpi Dashboard Ppt Sample Presentations
This is a sample kpi dashboard ppt sample presentations. This is a four stage process. The stages in this process are sales, market, budget, people.
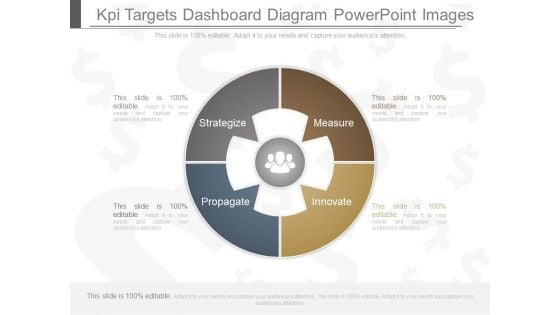
Kpi Targets Dashboard Diagram Powerpoint Images
This is a kpi targets dashboard diagram powerpoint images. This is a four stage process. The stages in this process are strategize, measure, propagate, innovate.

Sample Sales Kpi Dashboard Presentation Background Images
This is a sample sales kpi dashboard presentation background images. This is a four stage process. The stages in this process are implement review, define, solve, analyze.
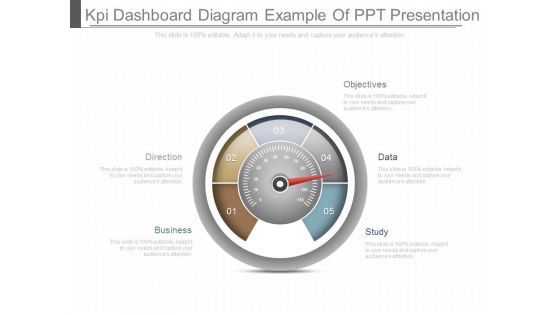
Kpi Dashboard Diagram Example Of Ppt Presentation
This is a kpi dashboard diagram example of ppt presentation. This is a five stage process. The stages in this process are business, direction, objectives, data, study.
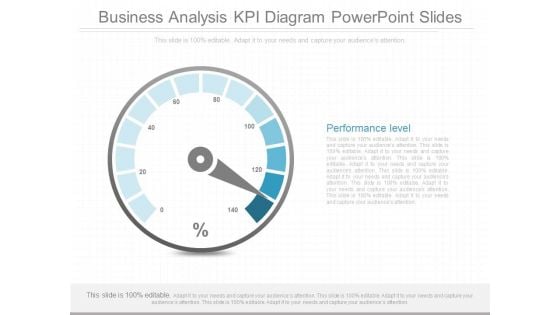
Business Analysis Kpi Diagram Powerpoint Slides
This is a business analysis kpi diagram powerpoint slides. This is a one stage process. The stages in this process are performance level.
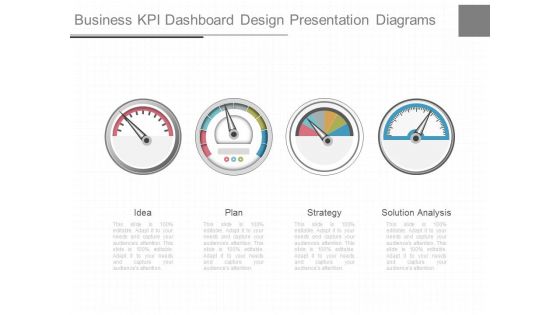
Business Kpi Dashboard Design Presentation Diagrams
This is a business kpi dashboard design presentation diagrams. This is a four stage process. The stages in this process are idea, plan, strategy, solution analysis.
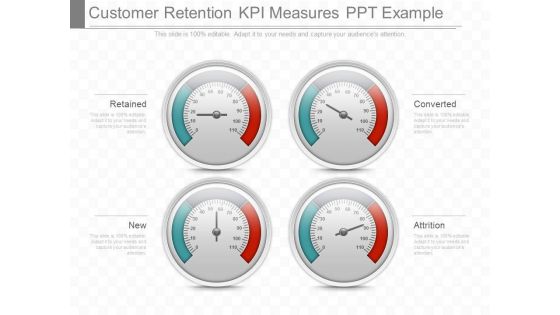
Customer Retention Kpi Measures Ppt Example
This is a customer retention kpi measures ppt example. This is a four stage process. The stages in this process are retained, new, converted, attrition.
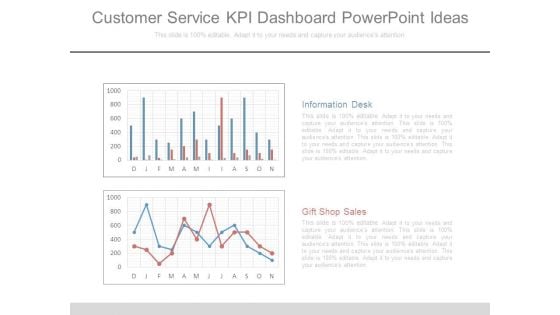
Customer Service Kpi Dashboard Powerpoint Ideas
This is a customer service kpi dashboard powerpoint ideas. This is a two stage process. The stages in this process are information desk, gift shop sales.
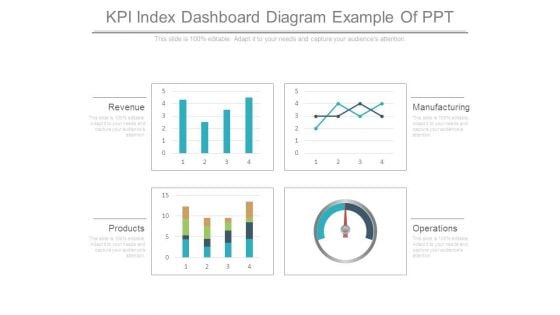
Kpi Index Dashboard Diagram Example Of Ppt
This is a kpi index dashboard diagram example of ppt. This is a four stage process. The stages in this process are revenue, products, operations, manufacturing.
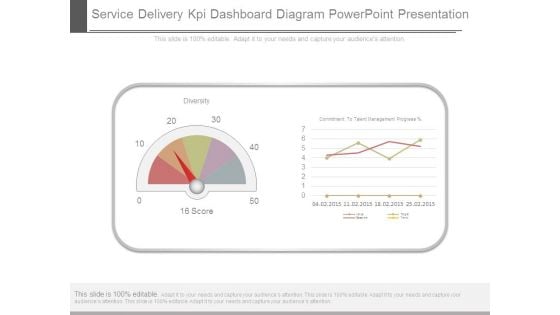
Service Delivery Kpi Dashboard Diagram Powerpoint Presentation
This is a service delivery kpi dashboard diagram powerpoint presentation. This is a two stage process. The stages in this process are diversity, commitment to talent management progress.
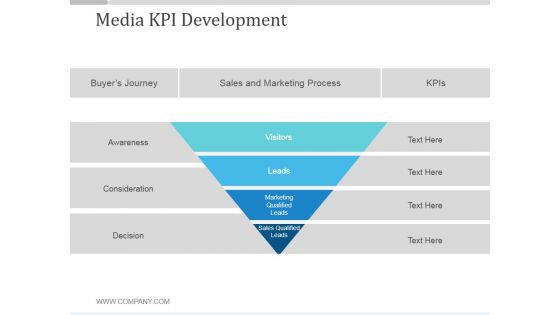
Media Kpi Development Ppt PowerPoint Presentation Gallery
This is a media kpi development ppt powerpoint presentation gallery. This is a four stage process. The stages in this process are visitors, leads, marketing qualified leads, sales qualified leads, buyers journey, sales and marketing process.
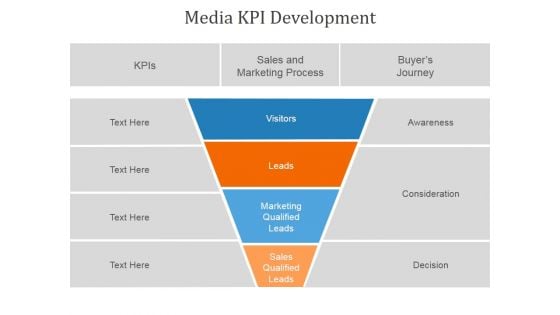
Media Kpi Development Ppt PowerPoint Presentation Slides
This is a media kpi development ppt powerpoint presentation slides. This is a four stage process. The stages in this process are sales and marketing process, visitors, leads, marketing qualified leads, sales qualified leads.
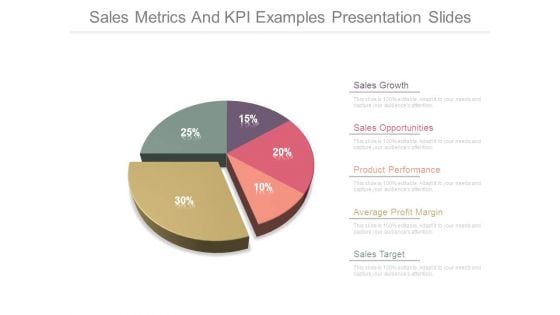
Sales Metrics And Kpi Examples Presentation Slides
This is a sales metrics and kpi examples presentation slides. This is a five stage process. The stages in this process are sales growth, sales opportunities, product performance, average profit margin, sales target.
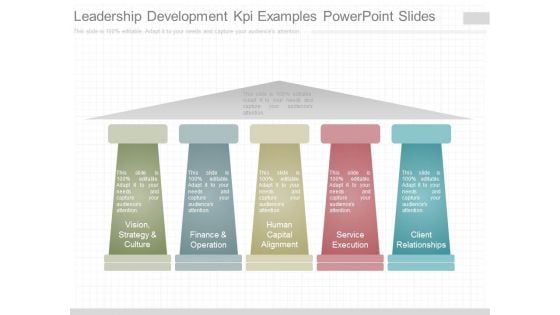
Leadership Development Kpi Examples Powerpoint Slides
This is a leadership development kpi examples powerpoint slides. This is a five stage process. The stages in this process are vision, strategy and culture, finance and operation, human capital alignment, service execution, client relationships.
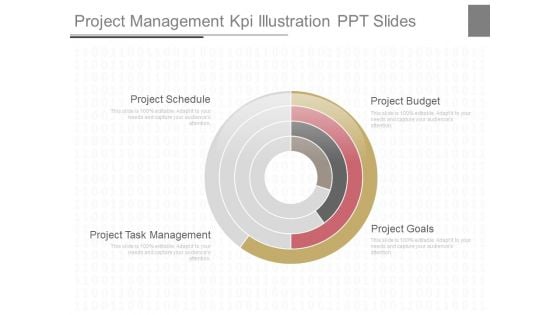
Project Management Kpi Illustration Ppt Slides
This is a project management kpi illustration ppt slides. This is a four stage process. The stages in this process are project schedule, project task management, project budget, project goals.
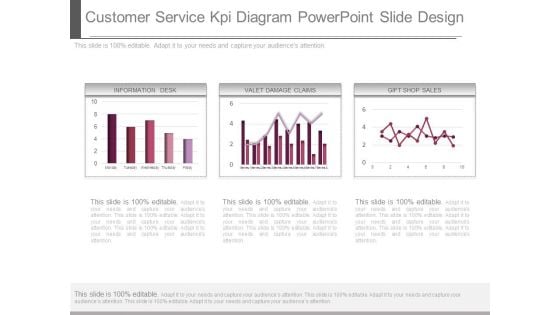
Customer Service Kpi Diagram Powerpoint Slide Design
This is a customer service kpi diagram powerpoint slide design. This is a three stage process. The stages in this process are information desk, valet damage claims, gift shop sales.
Team Skills Kpi Tracker Ppt Examples Professional
This is a team skills kpi tracker ppt examples professional. This is a three stage process. The stages in this process are disconnected, demo booked, wrong number, unavailable, call busy, no answer, disconnected, successful.
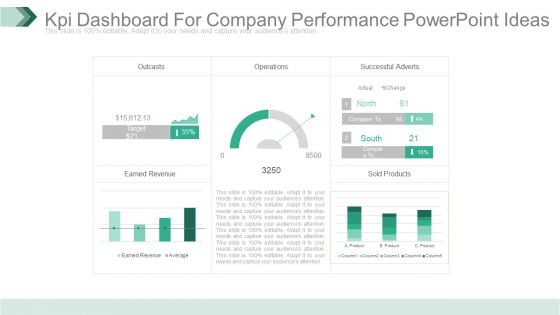
Kpi Dashboard For Company Performance Powerpoint Ideas
This is a kpi dashboard for company performance powerpoint ideas. This is a five stage process. The stages in this process are outcasts, operations, successful adverts, earned revenue, sold products.
Team Performance Kpi Tracker Powerpoint Slide Templates
This is a team performance kpi tracker powerpoint slide templates. This is a eight stage process. The stages in this process are successful, no answer, call busy, disconnected, wrong number, unavailable, disconnected, demo booked.
Kpi Tracker For Customer Calls Powerpoint Images
This is a kpi tracker for customer calls powerpoint images. This is a three stage process. The stages in this process are successful, no answer, call busy, disconnected, wrong number, unavailable, disconnected, demo booked.
Team Kpi Tracker Ppt PowerPoint Presentation Good
This is a team kpi tracker ppt powerpoint presentation good. This is a three stage process. The stages in this process are successful, no answer, call busy, disconnected, wrong number, unavailable, not interested, demo booked.
Kpi Accounting Ppt Powerpoint Presentation Show Cpb
This is a kpi accounting ppt powerpoint presentation show cpb. This is a five stage process. The stages in this process are kpi accounting.
Kpi Analysis Ppt PowerPoint Presentation Show Cpb
This is a kpi analysis ppt powerpoint presentation show cpb. This is a four stage process. The stages in this process are kpi analysis.
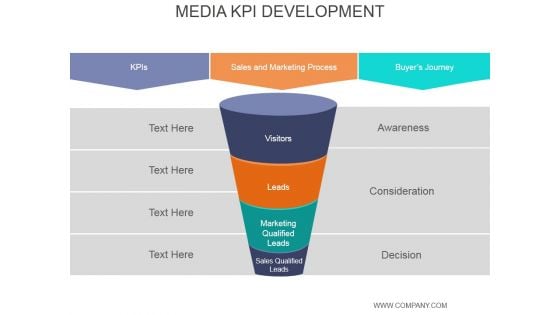
Media Kpi Development Ppt PowerPoint Presentation Portfolio
This is a media kpi development ppt powerpoint presentation portfolio. This is a five stage process. The stages in this process are awareness, consideration, decision, sales qualified leads, marketing qualified, leads, visitors.
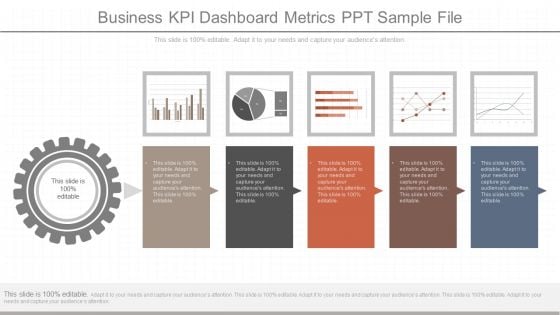
Business Kpi Dashboard Metrics Ppt Sample File
This is a business kpi dashboard metrics ppt sample file. This is a five stage process. The stages in this process are business, finance, management, success, marketing, presentation.
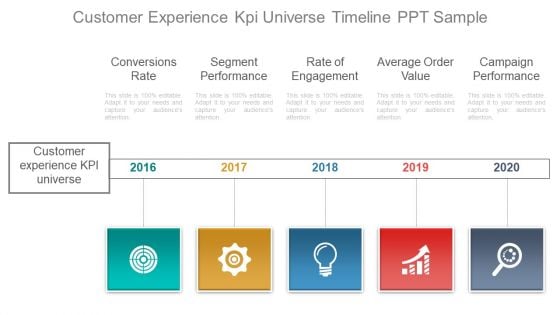
Customer Experience Kpi Universe Timeline Ppt Sample
This is a customer experience kpi universe timeline ppt sample. This is a five stage process. The stages in this process are time planning, business, marketing.
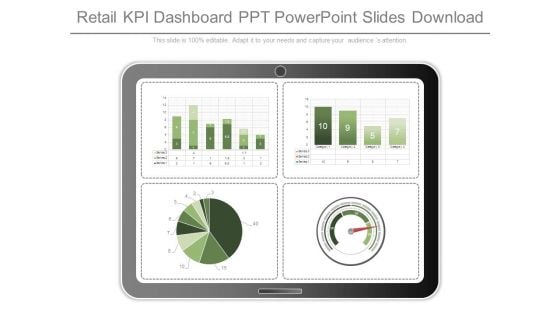
Retail Kpi Dashboard Ppt Powerpoint Slides Download
This is a retail kpi dashboard ppt powerpoint slides download. This is a four stage process. The stages in this process are business, marketing, measure, process, finance.
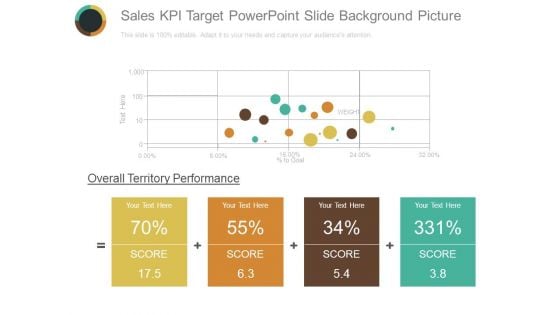
Sales Kpi Target Powerpoint Slide Background Picture
This is a sales kpi target powerpoint slide background picture. This is a four stage process. The stages in this process are business, management, marketing, finance, strategy.
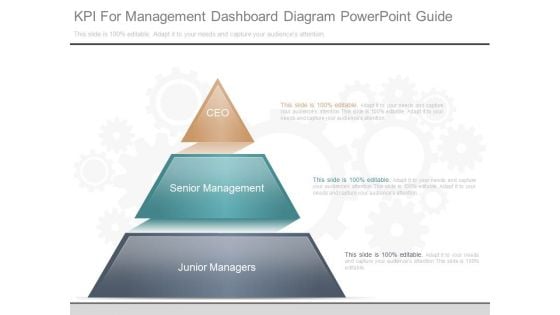
Kpi For Management Dashboard Diagram Powerpoint Guide
This is a kpi for management dashboard diagram powerpoint guide. This is a three stage process. The stages in this process are ceo, senior management, junior managers.
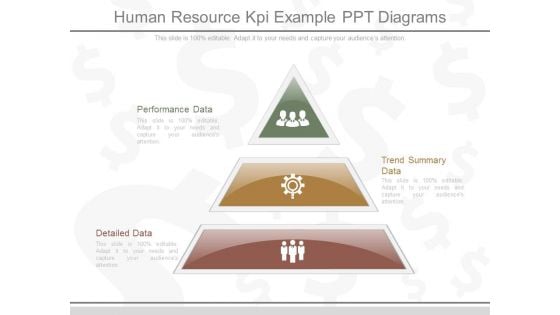
Human Resource Kpi Example Ppt Diagrams
This is a human resource kpi example ppt diagrams. This is a three stage process. The stages in this process are performance data, detailed data, trend summary data.

 Home
Home