Marketing Kpi

Key Performance Indicators Cycle Ppt Slide
This is a key performance indicators cycle ppt slide. This is a five stage process. The stages in this process are key performance indicators, kpi.
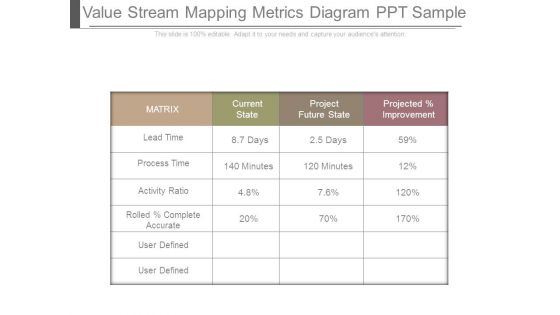
Value Stream Mapping Metrics Diagram Ppt Sample
This is a value stream mapping metrics diagram ppt sample. This is a four stage process. The stages in this process are matrix, current state, project future state, projected improvement, lead time, days, process time, activity ratio, rolled complete accurate, user defined, minutes.
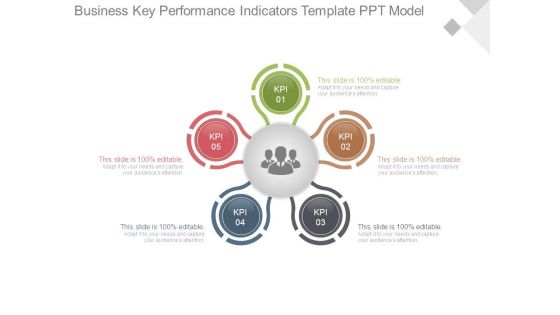
Business Key Performance Indicators Template Ppt Model
This is a business key performance indicators template ppt model. This is a five stage process. The stages in this process are kpi.
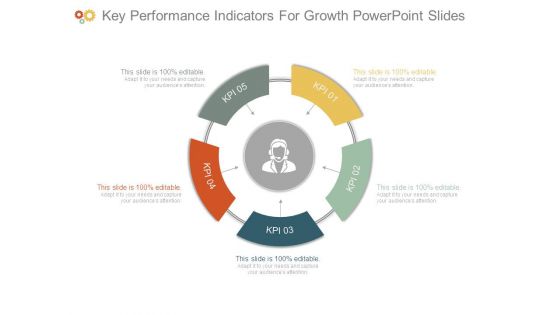
Key Performance Indicators For Growth Powerpoint Slides
This is a key performance indicators for growth powerpoint slides. This is a five stage process. The stages in this process are kpi.
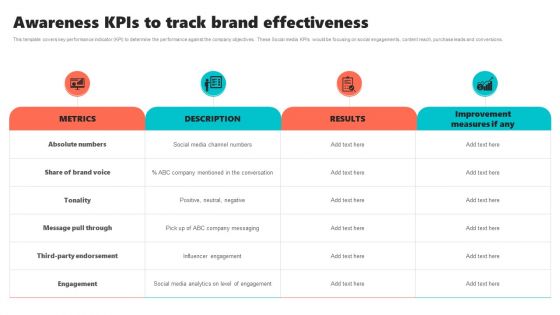
New Brand Introduction Plan Awareness Kpis To Track Brand Effectiveness Clipart PDF
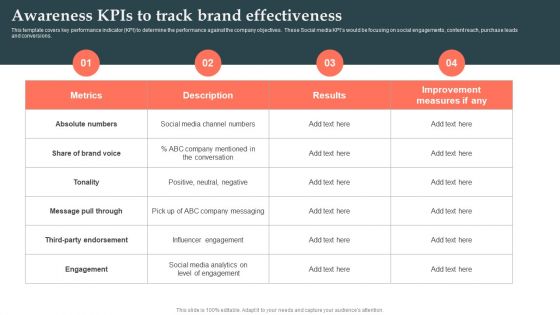
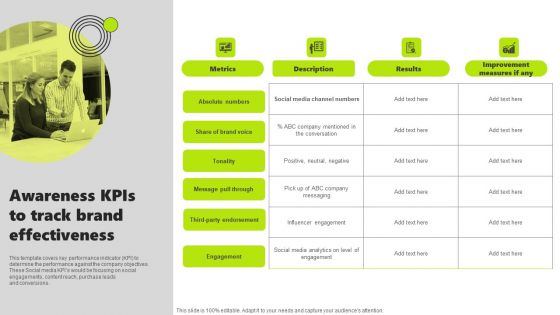
This template covers key performance indicator KPI to determine the performance against the company objectives. These Social media KPIs would be focusing on social engagements, content reach, purchase leads and conversions. This modern and well-arranged New Brand Introduction Plan Awareness Kpis To Track Brand Effectiveness Clipart PDF provides lots of creative possibilities. It is very simple to customize and edit with the Powerpoint Software. Just drag and drop your pictures into the shapes. All facets of this template can be edited with Powerpoint no extra software is necessary. Add your own material, put your images in the places assigned for them, adjust the colors, and then you can show your slides to the world, with an animated slide included.

Metrics Based Management Layout Presentation Powerpoint Templates
This is a metrics based management layout presentation powerpoint templates. This is a three stage process. The stages in this process are metrics review by dd dm, pl reviews the data, pm approves the metrics.
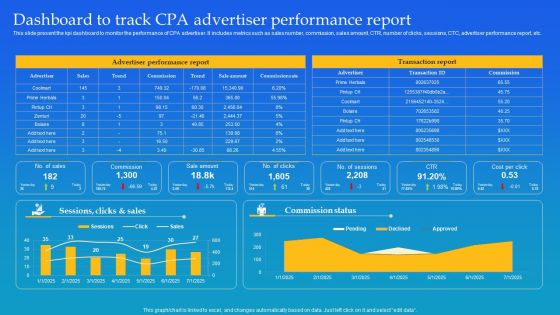
Dashboard To Track CPA Advertiser Performance Report Ppt Portfolio Samples PDF
This slide present the kpi dashboard to monitor the performance of CPA advertiser. It includes metrics such as sales number, commission, sales amount, CTR, number of clicks, sessions, CTC, advertiser performance report, etc. Crafting an eye catching presentation has never been more straightforward. Let your presentation shine with this tasteful yet straightforward Dashboard To Track CPA Advertiser Performance Report Ppt Portfolio Samples PDF template. It offers a minimalistic and classy look that is great for making a statement. The colors have been employed intelligently to add a bit of playfulness while still remaining professional. Construct the ideal Dashboard To Track CPA Advertiser Performance Report Ppt Portfolio Samples PDF that effortlessly grabs the attention of your audience Begin now and be certain to wow your customers.
Software Development Performance Metrics Diagram Ppt Slide
This is a software development performance metrics diagram ppt slide. This is a three stage process. The stages in this process are overall business strategy, situation analysis, priority setting.

Metric Development Process Diagram Presentation Powerpoint Example
This is a metric development process diagram presentation powerpoint example. This is a seven stage process. The stages in this process are define, measure, process improvement identified, technical development and implementation, requirements for metric, reporting, action.
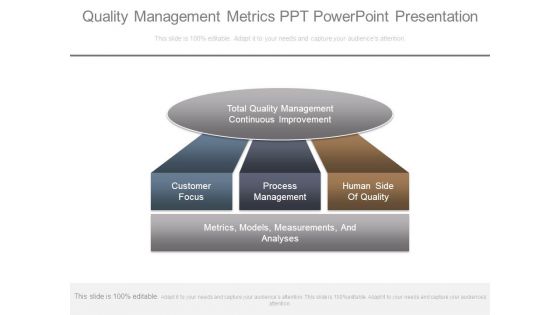
Quality Management Metrics Ppt Powerpoint Presentation
This is a quality management metrics ppt powerpoint presentation. This is a three stage process. The stages in this process are total quality management continuous improvement, customer focus, process management, human side of quality, metrics, models, measurements and analyses.

Hr Metrics Dashboard Examples Ppt Powerpoint Slides
This is a hr metrics dashboard examples ppt powerpoint slides. This is a five stage process. The stages in this process are chicago, boston, detroit, cleveland, turnover.
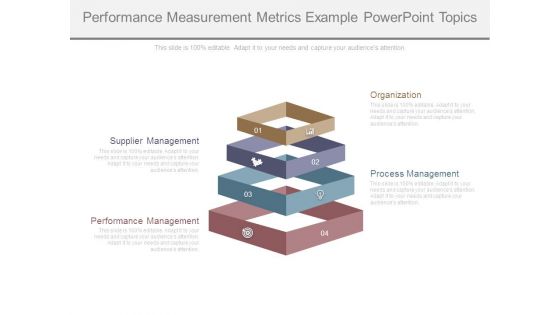
Performance Measurement Metrics Example Powerpoint Topics
This is a performance measurement metrics example powerpoint topics. This is a four stage process. The stages in this process are organization, supplier management, process management, performance management.

Metrics To Measure Performance Sample Ppt Presentation
This is a metrics to measure performance sample ppt presentation. This is a three stage process. The stages in this process are insight and analysis, goal, tactic.
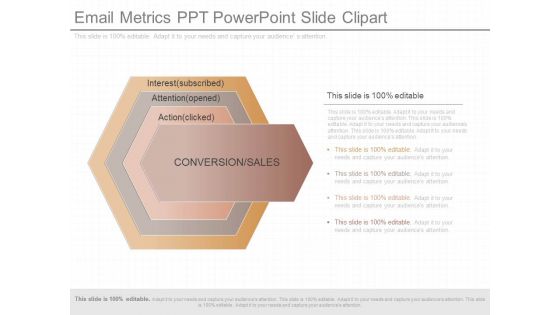
Email Metrics Ppt Powerpoint Slide Clipart
This is a email metrics ppt powerpoint slide clipart. This is a four stage process. The stages in this process are interest subscribed, attention opened, action clicked, conversion sales.
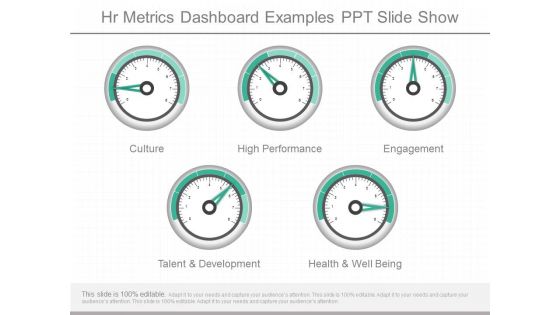
Hr Metrics Dashboard Examples Ppt Slide Show
This is a hr metrics dashboard examples ppt slide show. This is a five stage process. The stages in this process are culture, high performance, engagement, talent and development, health and well being.

Setting Campaign Metrics Ppt PowerPoint Presentation Slides File Formats
This is a setting campaign metrics ppt powerpoint presentation slides file formats. This is a five stage process. The stages in this process are business, marketing, management, icons, strategy.

Key Evaluation Metrics Ppt PowerPoint Presentation File Design Ideas
This is a key evaluation metrics ppt powerpoint presentation file design ideas. This is a five stage process. The stages in this process are business, icons, strategy, marketing, finance.

Creating And Implementing A Powerful Brand Leadership Strategy Brand Awareness Structure PDF
Following slide illustrates KPI dashboard that can be used to track the awareness level of a specific brand. KPIs covered in the slide are traffic, attention, authority, inbound channel performance etc. This Creating And Implementing A Powerful Brand Leadership Strategy Brand Awareness Structure PDF from Slidegeeks makes it easy to present information on your topic with precision. It provides customization options, so you can make changes to the colors, design, graphics, or any other component to create a unique layout. It is also available for immediate download, so you can begin using it right away. Slidegeeks has done good research to ensure that you have everything you need to make your presentation stand out. Make a name out there for a brilliant performance.

Key Performance Indicators For Business Powerpoint Slide Background Designs
This is a key performance indicators for business powerpoint slide background designs. This is a five stage process. The stages in this process are kpi.
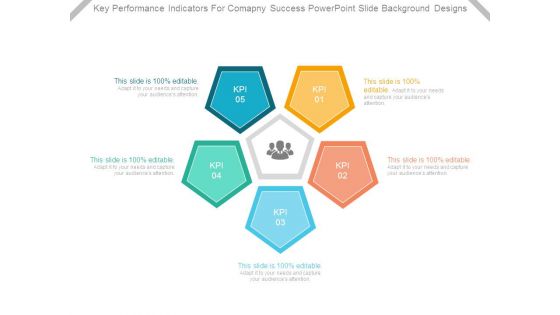
Key Performance Indicators For Company Success Powerpoint Slide Background Designs
This is a key performance indicators for company success powerpoint slide background designs. This is a five stage process. The stages in this process are kpi.
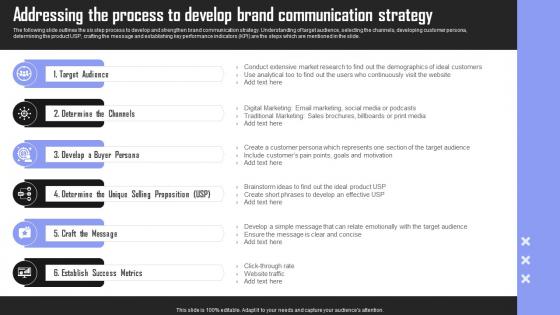
Addressing The Process Brand Building Techniques To Gain Competitive Edge Guidelines Pdf
The following slide outlines the six step process to develop and strengthen brand communication strategy. Understanding of target audience, selecting the channels, developing customer persona, determining the product USP, crafting the message and establishing key performance indicators KPI are the steps which are mentioned in the slide. Create an editable Addressing The Process Brand Building Techniques To Gain Competitive Edge Guidelines Pdf that communicates your idea and engages your audience. Whether you are presenting a business or an educational presentation, pre designed presentation templates help save time. Addressing The Process Brand Building Techniques To Gain Competitive Edge Guidelines Pdf is highly customizable and very easy to edit, covering many different styles from creative to business presentations. Slidegeeks has creative team members who have crafted amazing templates. So, go and get them without any delay.
Product Launch Strategy Awareness Kpis To Track Brand Effectiveness Ppt Styles Inspiration PDF
This template covers key performance indicator KPI to determine the performance against the company objectives. These Social media KPIs would be focusing on social engagements, content reach, purchase leads and conversions. Here you can discover an assortment of the finest PowerPoint and Google Slides templates. With these templates, you can create presentations for a variety of purposes while simultaneously providing your audience with an eye catching visual experience. Download Product Launch Strategy Awareness Kpis To Track Brand Effectiveness Ppt Styles Inspiration PDF to deliver an impeccable presentation. These templates will make your job of preparing presentations much quicker, yet still, maintain a high level of quality. Slidegeeks has experienced researchers who prepare these templates and write high quality content for you. Later on, you can personalize the content by editing the Product Launch Strategy Awareness Kpis To Track Brand Effectiveness Ppt Styles Inspiration PDF.
Rebrand Kick Off Plan Awareness Kpis To Track Brand Effectiveness Formats PDF
This template covers key performance indicator KPI to determine the performance against the company objectives. These Social media KPIs would be focusing on social engagements, content reach, purchase leads and conversions. Are you in need of a template that can accommodate all of your creative concepts This one is crafted professionally and can be altered to fit any style. Use it with Google Slides or PowerPoint. Include striking photographs, symbols, depictions, and other visuals. Fill, move around, or remove text boxes as desired. Test out color palettes and font mixtures. Edit and save your work, or work with colleagues. Download Rebrand Kick Off Plan Awareness Kpis To Track Brand Effectiveness Formats PDF and observe how to make your presentation outstanding. Give an impeccable presentation to your group and make your presentation unforgettable.
Ppc Campaign Performance Measuring Dashboard Guide To Personal Branding Pictures PDF
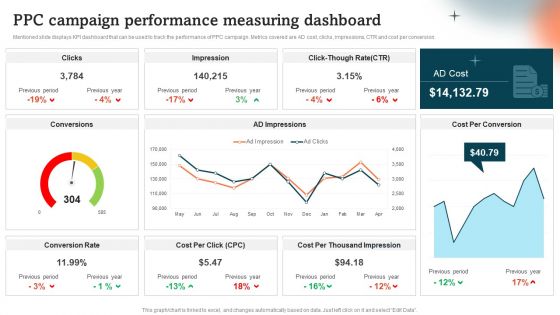
Mentioned slide displays KPI dashboard that can be used to track the performance of PPC campaign. Metrics covered are AD cost, clicks, impressions, CTR and cost per conversion.Presenting this PowerPoint presentation, titled Ppc Campaign Performance Measuring Dashboard Guide To Personal Branding Pictures PDF, with topics curated by our researchers after extensive research. This editable presentation is available for immediate download and provides attractive features when used. Download now and captivate your audience. Presenting this Ppc Campaign Performance Measuring Dashboard Guide To Personal Branding Pictures PDF. Our researchers have carefully researched and created these slides with all aspects taken into consideration. This is a completely customizable Ppc Campaign Performance Measuring Dashboard Guide To Personal Branding Pictures PDF that is available for immediate downloading. Download now and make an impact on your audience. Highlight the attractive features available with our PPTs.

Comprehensive Personal Branding Guidelines Ppc Campaign Performance Measuring Dashboard Mockup PDF
Mentioned slide displays KPI dashboard that can be used to track the performance of PPC campaign. Metrics covered are AD cost, clicks, impressions, CTR and cost per conversion.This Comprehensive Personal Branding Guidelines Ppc Campaign Performance Measuring Dashboard Mockup PDF is perfect for any presentation, be it in front of clients or colleagues. It is a versatile and stylish solution for organizing your meetings. The Comprehensive Personal Branding Guidelines Ppc Campaign Performance Measuring Dashboard Mockup PDF features a modern design for your presentation meetings. The adjustable and customizable slides provide unlimited possibilities for acing up your presentation. Slidegeeks has done all the homework before launching the product for you. So, do not wait, grab the presentation templates today.

Developing Personal Brand On Social Media Channels Ppc Campaign Performance Measuring Sample PDF
Mentioned slide displays KPI dashboard that can be used to track the performance of PPC campaign. Metrics covered are AD cost, clicks, impressions, CTR and cost per conversion.Do you have an important presentation coming up Are you looking for something that will make your presentation stand out from the rest Look no further than Developing Personal Brand On Social Media Channels Ppc Campaign Performance Measuring Sample PDF. With our professional designs, you can trust that your presentation will pop and make delivering it a smooth process. And with Slidegeeks, you can trust that your presentation will be unique and memorable. So why wait Grab Developing Personal Brand On Social Media Channels Ppc Campaign Performance Measuring Sample PDF today and make your presentation stand out from the rest.
Business Diagram Sentiment Analysis From Different Social Media Feeds Ppt Slide
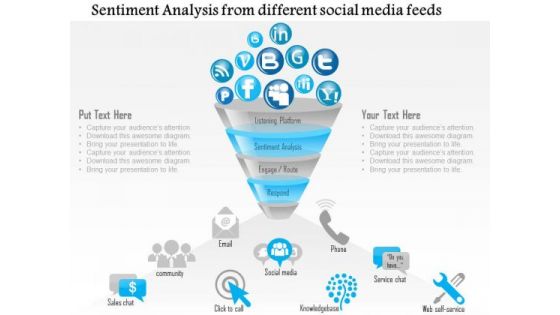
This diagram has been designed with graphic of funnel diagram displaying multiple icons of social media. These icons may be used to display social media sentiment analysis. Use this diagram slide for social media related presentations.

Operational Excellence Metrics Ppt PowerPoint Presentation Complete Deck With Slides
This is a operational excellence metrics ppt powerpoint presentation complete deck with slides. This is a one stage process. The stages in this process are operational, excellence, metrics, business, technology.
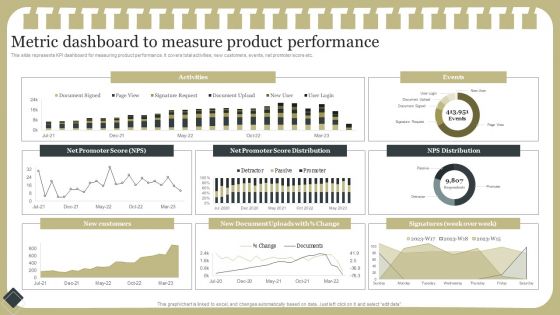
Effective Product Development Strategy Metric Dashboard To Measure Product Performance Information PDF
This slide represents KPI dashboard for measuring product performance. It covers total activities, new customers, events, net promoter score etc.Coming up with a presentation necessitates that the majority of the effort goes into the content and the message you intend to convey. The visuals of a PowerPoint presentation can only be effective if it supplements and supports the story that is being told. Keeping this in mind our experts created Effective Product Development Strategy Metric Dashboard To Measure Product Performance Information PDF to reduce the time that goes into designing the presentation. This way, you can concentrate on the message while our designers take care of providing you with the right template for the situation.

Adopting Flexible Work Policy Work From Home Performance Management Dashboard Demonstration PDF
The following slide outlines a comprehensive key performance indicator KPI dashboard that can be used to showcase employees performance during work-from-home WFH. Information covered in this slide is related to average result area scores etc. Slidegeeks is one of the best resources for PowerPoint templates. You can download easily and regulate Adopting Flexible Work Policy Work From Home Performance Management Dashboard Demonstration PDF for your personal presentations from our wonderful collection. A few clicks is all it takes to discover and get the most relevant and appropriate templates. Use our Templates to add a unique zing and appeal to your presentation and meetings. All the slides are easy to edit and you can use them even for advertisement purposes.
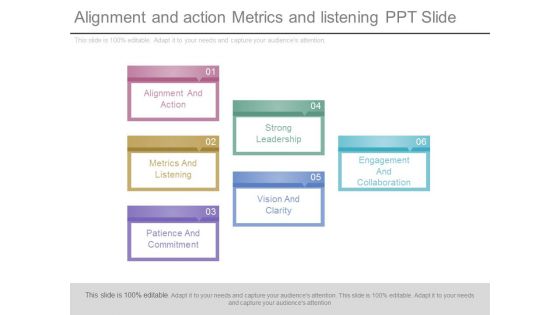
Alignment And Action Metrics And Listening Ppt Slide
This is a alignment and action metrics and listening ppt slide. This is a six stage process. The stages in this process are alignment and action, metrics and listening, patience and commitment, strong leadership, vision and clarity, engagement and collaboration.
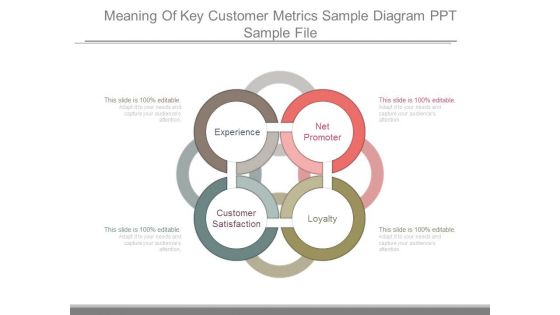
Meaning Of Key Customer Metrics Sample Diagram Ppt Sample File
This is a meaning of key customer metrics sample diagram ppt sample file. This is a four stage process. The stages in this process are net promoter, loyalty, customer satisfaction, experience.
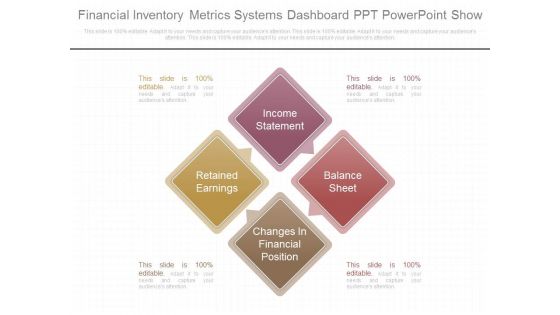
Financial Inventory Metrics Systems Dashboard Ppt Powerpoint Show
This is a financial inventory metrics systems dashboard ppt powerpoint show. This is a four stage process. The stages in this process are income statement, retained earnings, balance sheet, changes in financial position.

Advanced Email Metrics And Analysis Services Diagram Slide
This is a advanced email metrics and analysis services diagram slide. This is a four stage process. The stages in this process are analytics data warehouse, data mining, financial modeling.
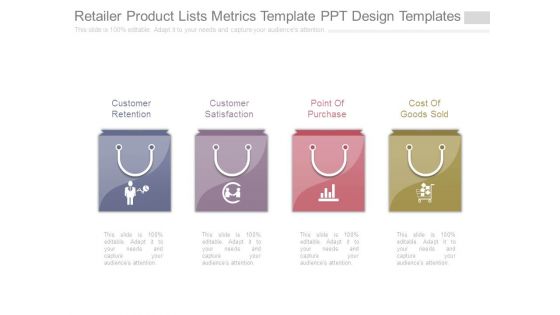
Retailer Product Lists Metrics Template Ppt Design Templates
This is a retailer product lists metrics template ppt design templates. This is a four stage process. The stages in this process are customer retention, customer satisfaction, point of purchase, cost of goods sold.
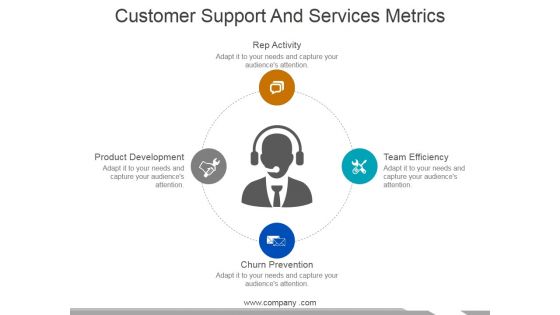
Customer Support And Services Metrics Ppt PowerPoint Presentation Infographics Ideas
This is a customer support and services metrics ppt powerpoint presentation infographics ideas. This is a four stage process. The stages in this process are rep activity, team efficiency, churn prevention, product development.
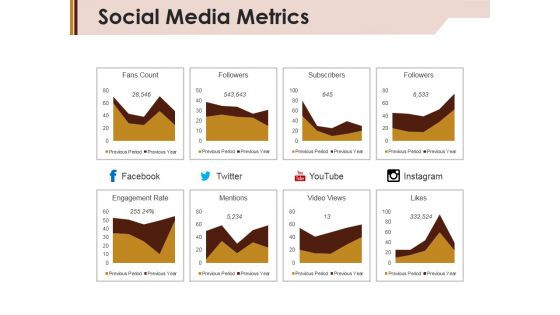
Social Media Metrics Ppt PowerPoint Presentation Ideas Graphics Example
This is a social media metrics ppt powerpoint presentation ideas graphics example. This is a eight stage process. The stages in this process are fans count, followers, subscribers, engagement rate.
Operational Performance Metrics Days Ppt PowerPoint Presentation Icon Maker
This is a operational performance metrics days ppt powerpoint presentation icon maker. This is a four stage process. The stages in this process are customer support tickets, lob efficiency measure, process downtime level, percentage of product defects.
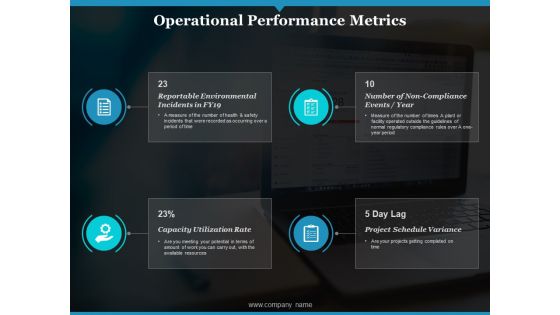
Operational Performance Metrics Ppt PowerPoint Presentation Ideas Background Image
This is a operational performance metrics ppt powerpoint presentation ideas background image. This is a four stage process. The stages in this process are reportable environmental incidents, number of non compliance events, capacity utilization rate.

Dashboard To Track CPA Introduction And Implementation Procedure Background Pdf
This slide present the kpi dashboard to monitor the performance of CPA advertiser. It includes metrics such as sales number, commission, sales amount, CTR, number of clicks, sessions, CTC, advertiser performance report, etc. Present like a pro with Dashboard To Track CPA Introduction And Implementation Procedure Background Pdf Create beautiful presentations together with your team, using our easy to use presentation slides. Share your ideas in real time and make changes on the fly by downloading our templates. So whether you are in the office, on the go, or in a remote location, you can stay in sync with your team and present your ideas with confidence. With Slidegeeks presentation got a whole lot easier. Grab these presentations today.

Dashboard To Track CPA Tactics To Optimize Corporate Performance Information Pdf
This slide present the kpi dashboard to monitor the performance of CPA advertiser. It includes metrics such as sales number, commission, sales amount, CTR, number of clicks, sessions, CTC, advertiser performance report, etc. Slidegeeks is here to make your presentations a breeze with Dashboard To Track CPA Tactics To Optimize Corporate Performance Information Pdf With our easy to use and customizable templates, you can focus on delivering your ideas rather than worrying about formatting. With a variety of designs to choose from, you are sure to find one that suits your needs. And with animations and unique photos, illustrations, and fonts, you can make your presentation pop. So whether you are giving a sales pitch or presenting to the board, make sure to check out Slidegeeks first.
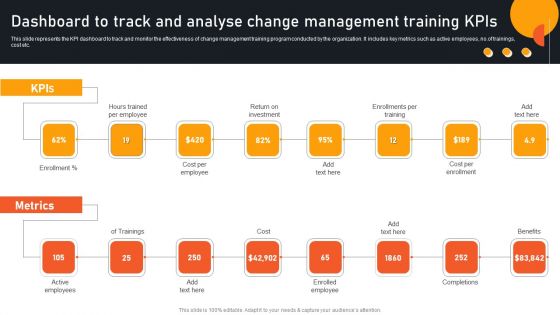
Transform Management Instruction Schedule Dashboard To Track And Analyse Change Mockup PDF
This slide represents the KPI dashboard to track and monitor the effectiveness of change management training program conducted by the organization. It includes key metrics such as active employees, no.of trainings, cost etc. Slidegeeks is one of the best resources for PowerPoint templates. You can download easily and regulate Transform Management Instruction Schedule Dashboard To Track And Analyse Change Mockup PDF for your personal presentations from our wonderful collection. A few clicks is all it takes to discover and get the most relevant and appropriate templates. Use our Templates to add a unique zing and appeal to your presentation and meetings. All the slides are easy to edit and you can use them even for advertisement purposes.
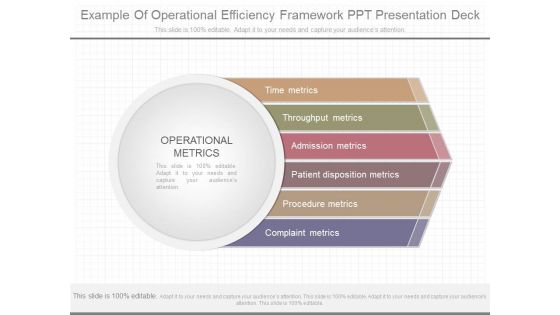
Example Of Operational Efficiency Framework Ppt Presentation Deck
This is a example of operational efficiency framework ppt presentation deck. This is a six stage process. The stages in this process are time metrics, throughput metrics, admission metrics, patient disposition metrics, procedure metrics, complaint metrics, operational metrics.
Dashboard For Tracking Digital Content Performance Consumer Contact Point Guide Summary PDF
This slide covers the KPI dashboard for analyzing online content. It includes metrics such as blog visitors, pageviews, newsletter conversion rate, new signups, new customers, etc. Are you searching for a Dashboard For Tracking Digital Content Performance Consumer Contact Point Guide Summary PDF that is uncluttered, straightforward, and original It is easy to edit, and you can change the colors to suit your personal or business branding. For a presentation that expresses how much effort you have put in, this template is ideal With all of its features, including tables, diagrams, statistics, and lists, it is perfect for a business plan presentation. Make your ideas more appealing with these professional slides. Download Dashboard For Tracking Digital Content Performance Consumer Contact Point Guide Summary PDF from Slidegeeks today.
Increasing Customer Dashboard For Tracking Aftersales Customer Services Team Ideas PDF
This slide covers the KPI dashboard for ticket tracking. It includes metrics such as tickets by month, service level, and details of customer service department agents. Are you searching for a Increasing Customer Dashboard For Tracking Aftersales Customer Services Team Ideas PDF that is uncluttered, straightforward, and original Its easy to edit, and you can change the colors to suit your personal or business branding. For a presentation that expresses how much effort youve put in, this template is ideal With all of its features, including tables, diagrams, statistics, and lists, its perfect for a business plan presentation. Make your ideas more appealing with these professional slides. Download Increasing Customer Dashboard For Tracking Aftersales Customer Services Team Ideas PDF from Slidegeeks today.

Major Types Product Differentiation Strategy Product Development And Management Plan Clipart PDF
This slide represents KPI dashboard for measuring product performance. It covers total activities, new customers, events, net promoter score etc.Find highly impressive Major Types Product Differentiation Strategy Product Development And Management Plan Clipart PDF on Slidegeeks to deliver a meaningful presentation. You can save an ample amount of time using these presentation templates. No need to worry to prepare everything from scratch because Slidegeeks experts have already done a huge research and work for you. You need to download Major Types Product Differentiation Strategy Product Development And Management Plan Clipart PDF for your upcoming presentation. All the presentation templates are 100 precent editable and you can change the color and personalize the content accordingly. Download now.

Training Feedback Dashboard To Enhance Program Effectiveness Themes PDF
This slide covers KPI dashboard to assess training effectiveness. It involves details such as net promoter score, training satisfaction rate, engagement score and drop out rate. Coming up with a presentation necessitates that the majority of the effort goes into the content and the message you intend to convey. The visuals of a PowerPoint presentation can only be effective if it supplements and supports the story that is being told. Keeping this in mind our experts created Training Feedback Dashboard To Enhance Program Effectiveness Themes PDF to reduce the time that goes into designing the presentation. This way, you can concentrate on the message while our designers take care of providing you with the right template for the situation.
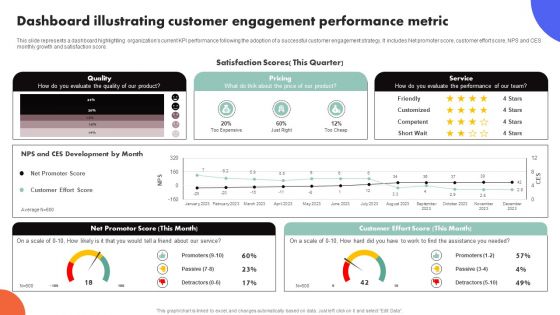
Improving Buyer Journey Through Strategic Customer Engagement Dashboard Illustrating Customer Engagement Background PDF
This slide represents a dashboard highlighting organizations current KPI performance following the adoption of a successful customer engagement strategy. It includes Net promoter score, customer effort score, NPS and CES monthly growth and satisfaction score. Are you in need of a template that can accommodate all of your creative concepts This one is crafted professionally and can be altered to fit any style. Use it with Google Slides or PowerPoint. Include striking photographs, symbols, depictions, and other visuals. Fill, move around, or remove text boxes as desired. Test out color palettes and font mixtures. Edit and save your work, or work with colleagues. Download Improving Buyer Journey Through Strategic Customer Engagement Dashboard Illustrating Customer Engagement Background PDF and observe how to make your presentation outstanding. Give an impeccable presentation to your group and make your presentation unforgettable.
Dashboard For Tracking Employee Satisfaction Rate Detailed Personnel Slides Pdf
This slide covers KPI dashboard to measure employee satisfaction due to effective internal communication. It includes indicators such as net promoter score, retention rate, absenteeism etc. This Dashboard For Tracking Employee Satisfaction Rate Detailed Personnel Slides Pdf is perfect for any presentation, be it in front of clients or colleagues. It is a versatile and stylish solution for organizing your meetings. The Dashboard For Tracking Employee Satisfaction Rate Detailed Personnel Slides Pdf features a modern design for your presentation meetings. The adjustable and customizable slides provide unlimited possibilities for acing up your presentation. Slidegeeks has done all the homework before launching the product for you. So, do not wait, grab the presentation templates today

Analyzing Email Click Through Rate For Better Campaign Performance Designs Pdf
This slide covers an overview of email click through rate KPI to identify total email recipients who clicked on one or more links attached in the email. It also includes strategies to increase the email click through rate, such as incorporating compelling calls to action, using A B email testing, collecting recipient feedback, etc. Slidegeeks is one of the best resources for PowerPoint templates. You can download easily and regulate Analyzing Email Click Through Rate For Better Campaign Performance Designs Pdf for your personal presentations from our wonderful collection. A few clicks is all it takes to discover and get the most relevant and appropriate templates. Use our Templates to add a unique zing and appeal to your presentation and meetings. All the slides are easy to edit and you can use them even for advertisement purposes.
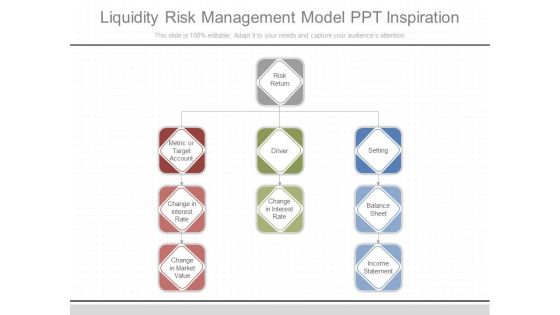
Liquidity Risk Management Model Ppt Inspiration
This is a liquidity risk management model ppt inspiration. This is a three stage process. The stages in this process are risk return, metric or target account, change in interest rate, change in market value, driver, change in interest rate, setting, balance sheet, income statement.

Key Metrics For Finance Unit Presentation Images
This is a key metrics for finance unit presentation images. This is a three stage process. The stages in this process are business, management, strategy, finance unit, marketing.
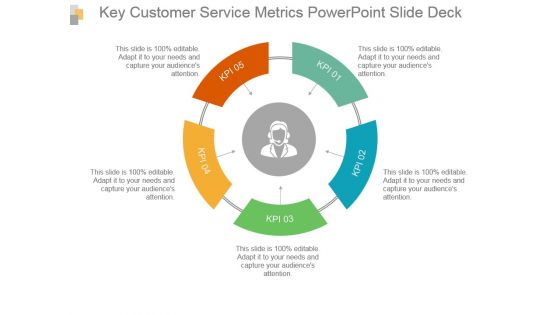
Key Customer Service Metrics Powerpoint Slide Deck
This is a key customer service metrics powerpoint slide deck. This is a five stage process. The stages in this process are process, management, arrow, marketing, strategy.
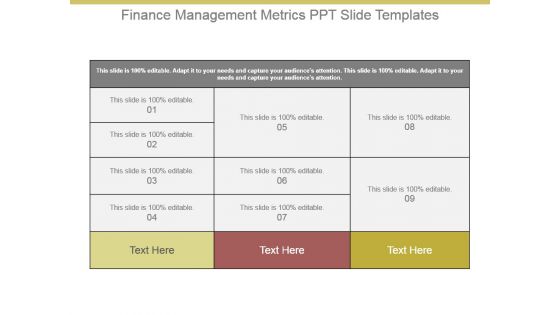
Finance Management Metrics Ppt Slide Templates
This is a finance management metrics ppt slide templates. This is a nine stage process. The stages in this process are business, marketing, management, table.
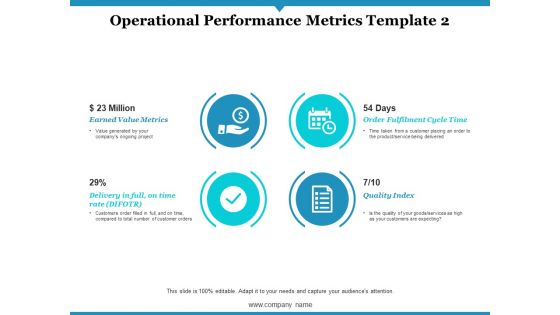
Operational Performance Metrics Quality Index Ppt PowerPoint Presentation Infographic Template Example 2015
This is a operational performance metrics quality index ppt powerpoint presentation infographic template example 2015. This is a four stage process. The stages in this process are earned value metrics, order fulfilment cycle time, delivery in full on time rate, quality index.

Key Metrics To Track Social Media Success Ppt PowerPoint Presentation Templates
This is a key metrics to track social media success ppt powerpoint presentation templates. This is a four stage process. The stages in this process are facebook, twitter, youtube, instagram, fans count, followers.

Social Media Metrics Ppt PowerPoint Presentation File Design Inspiration
This is a social media metrics ppt powerpoint presentation file design inspiration. This is a four stage process. The stages in this process are facebook, google, twitter, youtube.
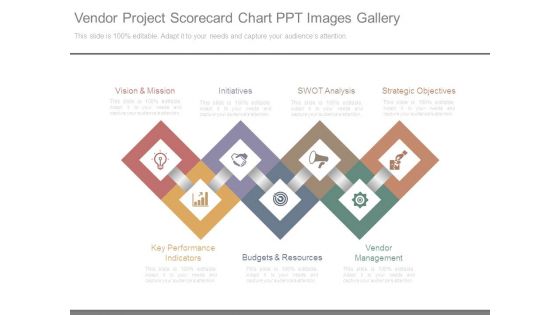
Vendor Project Scorecard Chart Ppt Images Gallery
This is a vendor project scorecard chart ppt images gallery. This is a seven stage process. The stages in this process are vision and mission, initiatives, swot analysis, strategic objectives, vendor management, budgets and resources, key performance indicators.
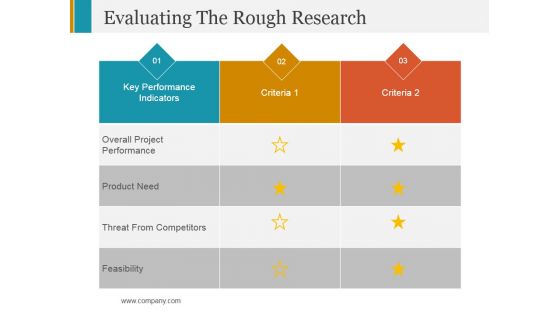
Evaluating The Rough Research Ppt PowerPoint Presentation Ideas Clipart Images
This is a evaluating the rough research ppt powerpoint presentation ideas clipart images. This is a two stage process. The stages in this process are key performance indicators, criteria, feasibility.
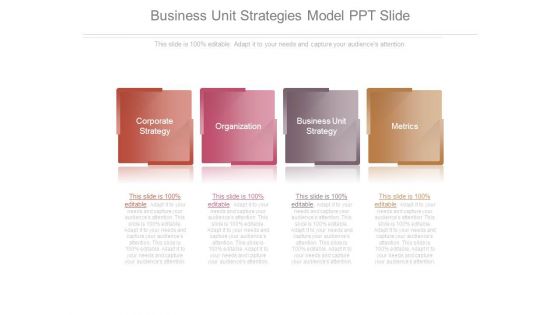
Business Unit Strategies Model Ppt Slide
This is a business unit strategies model ppt slide. This is a four stage process. The stages in this process are corporate strategy, organization, business unit strategy, metrics.

 Home
Home