List Of Five
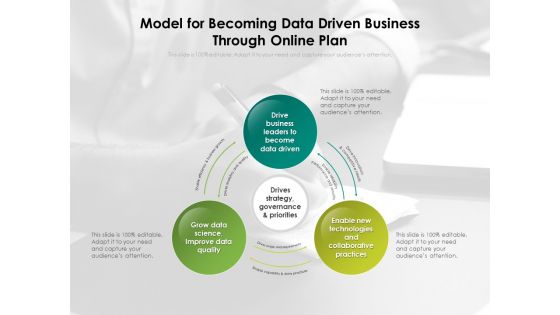
Model For Becoming Data Driven Business Through Online Plan Ppt PowerPoint Presentation Infographic Template Mockup PDF
Persuade your audience using this model for becoming data driven business through online plan ppt powerpoint presentation infographic template mockup pdf. This PPT design covers three stages, thus making it a great tool to use. It also caters to a variety of topics including drive business leaders to become data driven, grow data science, improve data quality, enable new technologies and collaborative practices. Download this PPT design now to present a convincing pitch that not only emphasizes the topic but also showcases your presentation skills.
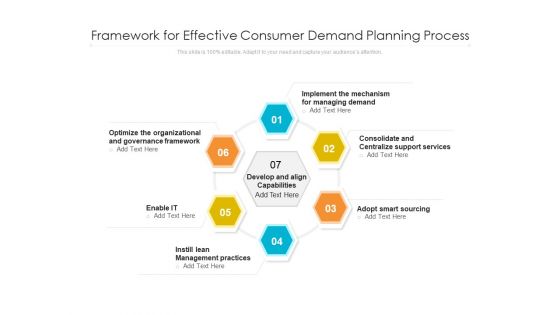
Framework For Effective Consumer Demand Planning Process Ppt PowerPoint Presentation Infographics Shapes PDF
Persuade your audience using this framework for effective consumer demand planning process ppt powerpoint presentation infographics shapes pdf. This PPT design covers six stages, thus making it a great tool to use. It also caters to a variety of topics including implement the mechanism for managing demand, consolidate and centralize support services, adopt smart sourcing, optimize the organizational and governance framework, enable it, instill lean, management practices. Download this PPT design now to present a convincing pitch that not only emphasizes the topic but also showcases your presentation skills.
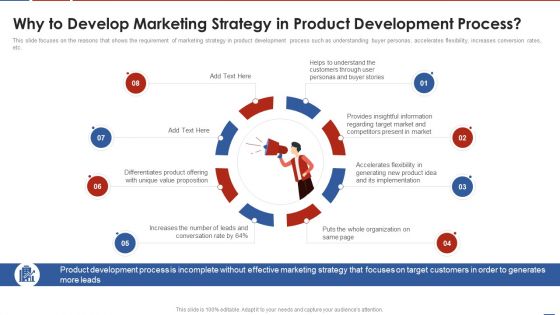
Formulating Product Development Action Plan To Enhance Client Experience Why To Develop Marketing Strategy Infographics PDF
This slide focuses on the reasons that shows the requirement of marketing strategy in product development process such as understanding buyer personas, accelerates flexibility, increases conversion rates, etc. Presenting formulating product development action plan to enhance client experience why to develop marketing strategy infographics pdf to provide visual cues and insights. Share and navigate important information on eight stages that need your due attention. This template can be used to pitch topics like organization, implementation, target market, value proposition. In addtion, this PPT design contains high resolution images, graphics, etc, that are easily editable and available for immediate download.

Cognitive Computing Action Plan Addressing Technologies Enabling Cognitive Ppt Infographic Template Shapes PDF
This slide provides information regarding various technologies enabling cognitive computing in terms of machine learning, machine reasoning and natural language processing. This is a cognitive computing action plan addressing technologies enabling cognitive ppt infographic template shapes pdf template with various stages. Focus and dispense information on three stages using this creative set, that comes with editable features. It contains large content boxes to add your information on topics like machine learning, machine reasoning, natural language processing. You can also showcase facts, figures, and other relevant content using this PPT layout. Grab it now.

Formulating Workforce Experience Plan Company Build Employee Experience Canvas Infographics PDF
Employee Experience Canvas helps you map the current experience of the employees across different touchpoints and also design the future experience. This is a formulating workforce experience plan company build employee experience canvas infographics pdf template with various stages. Focus and dispense information on six stages using this creative set, that comes with editable features. It contains large content boxes to add your information on topics like physical environment, services and amenities, tools and technology, people and culture. You can also showcase facts, figures, and other relevant content using this PPT layout. Grab it now.
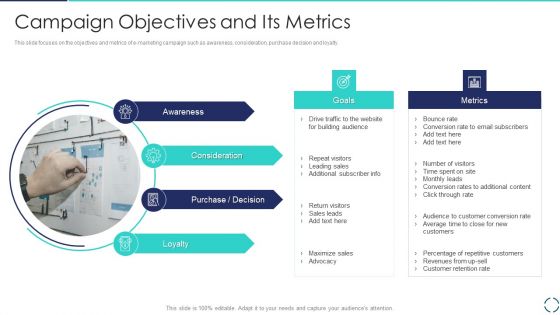
Optimizing E Business Promotion Plan Campaign Objectives And Its Metrics Infographics PDF
This slide focuses on the objectives and metrics of e-marketing campaign such as awareness, consideration, purchase decision and loyalty. Presenting Optimizing E Business Promotion Plan Campaign Objectives And Its Metrics Infographics PDF to provide visual cues and insights. Share and navigate important information on four stages that need your due attention. This template can be used to pitch topics like Awareness, Consideration, Purchase Decision. In addtion, this PPT design contains high resolution images, graphics, etc, that are easily editable and available for immediate download.
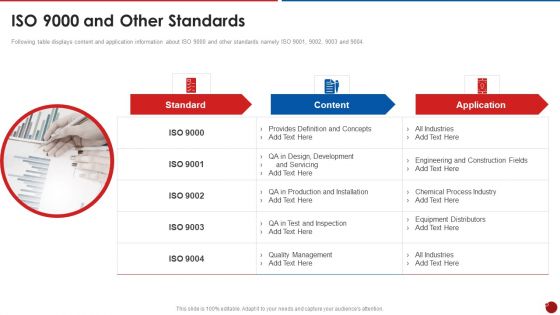
Quality Assurance Templates Set 2 Iso 9000 And Other Standards Infographics PDF
Following slide displays information about ISO 14001 environmental process cycle starting from environmental policy and ending at plans for continuous improvement. This is a quality assurance templates set 2 iso 9000 and other standards infographics pdf template with various stages. Focus and dispense information on seven stages using this creative set, that comes with editable features. It contains large content boxes to add your information on topics like records, monitoring and measurement, emergency planning, operational control, auditing and management reviews. You can also showcase facts, figures, and other relevant content using this PPT layout. Grab it now.
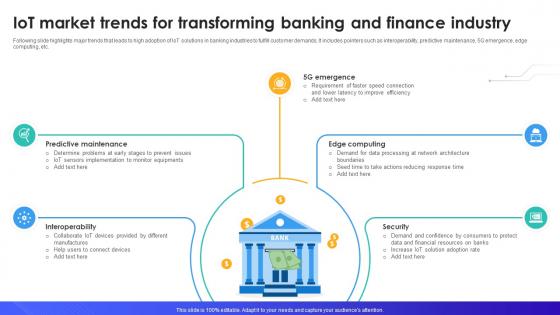
IoT Market Trends For Transforming Banking And Finance IoT In Banking For Digital Future IoT SS V
Following slide highlights major trends that leads to high adoption of IoT solutions in banking industries to fulfill customer demands. It includes pointers such as interoperability, predictive maintenance, 5G emergence, edge computing, etc. Crafting an eye-catching presentation has never been more straightforward. Let your presentation shine with this tasteful yet straightforward IoT Market Trends For Transforming Banking And Finance IoT In Banking For Digital Future IoT SS V template. It offers a minimalistic and classy look that is great for making a statement. The colors have been employed intelligently to add a bit of playfulness while still remaining professional. Construct the ideal IoT Market Trends For Transforming Banking And Finance IoT In Banking For Digital Future IoT SS V that effortlessly grabs the attention of your audience Begin now and be certain to wow your customers

Todays Goal Ppt PowerPoint Presentation Show Infographics
This is a todays goal ppt powerpoint presentation show infographics. This is a three stage process. The stages in this process are reliability, superior quality, commitment and dedication.

Competitors Marketing Strategy And Plan Ppt PowerPoint Presentation Designs Download
This is a competitors marketing strategy and plan ppt powerpoint presentation designs download. This is a eight stage process. The stages in this process are infographics, call to action, video, newsletter, blogging, social media, white papers, webinars.
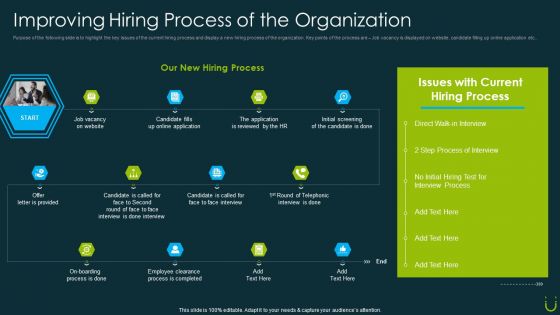
Staff Retention Plan Improving Hiring Process Of The Organization Ppt Infographics Rules PDF
Purpose of the following slide is to highlight the key issues of the current hiring process and display a new hiring process of the organization. Key points of the process are Job vacancy is displayed on website, candidate filling up online application etc. This is a staff retention plan improving hiring process of the organization ppt infographics rules pdf template with various stages. Focus and dispense information on twelve stages using this creative set, that comes with editable features. It contains large content boxes to add your information on topics like our new hiring process, issues with current hiring process . You can also showcase facts, figures, and other relevant content using this PPT layout. Grab it now.

Data Mining Tools Comparative Analysis Data Warehousing And Data Mining Guide AI SS V
This slide showcases comparative analysis of top 5 data mining tools available in the latter market. It provides details about cloud, on premise, Mac, Windows, Linux, pricing, etc. Formulating a presentation can take up a lot of effort and time, so the content and message should always be the primary focus. The visuals of the PowerPoint can enhance the presenters message, so our Data Mining Tools Comparative Analysis Data Warehousing And Data Mining Guide AI SS V was created to help save time. Instead of worrying about the design, the presenter can concentrate on the message while our designers work on creating the ideal templates for whatever situation is needed. Slidegeeks has experts for everything from amazing designs to valuable content, we have put everything into Data Mining Tools Comparative Analysis Data Warehousing And Data Mining Guide AI SS V.

Donut Chart Infographic For Percentage Ratio Analysis Ppt PowerPoint Presentation File Graphics Example PDF
Persuade your audience using this donut chart infographic for percentage ratio analysis ppt powerpoint presentation file graphics example pdf. This PPT design covers four stages, thus making it a great tool to use. It also caters to a variety of topics including donut chart infographic for percentage ratio analysis. Download this PPT design now to present a convincing pitch that not only emphasizes the topic but also showcases your presentation skills.
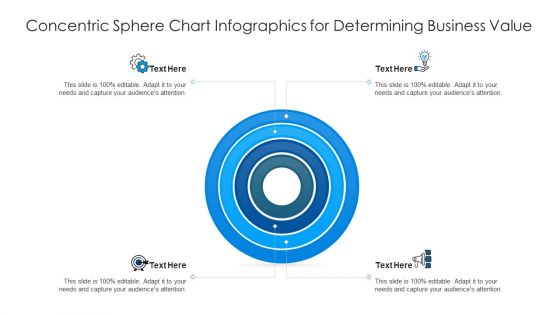
Concentric Sphere Chart Infographics For Determining Business Value Ppt Professional Template PDF
Persuade your audience using this concentric sphere chart infographics for determining business value ppt professional template pdf. This PPT design covers four stages, thus making it a great tool to use. It also caters to a variety of topics including concentric sphere chart infographics for determining business value. Download this PPT design now to present a convincing pitch that not only emphasizes the topic but also showcases your presentation skills.
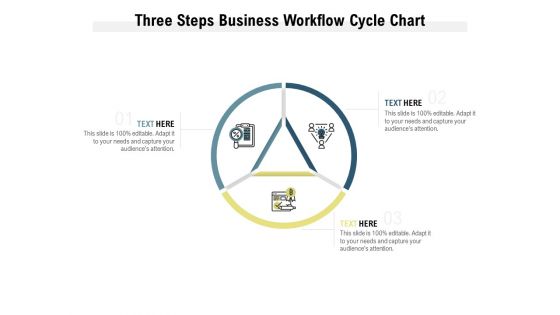
Three Steps Business Workflow Cycle Chart Ppt PowerPoint Presentation Infographics Vector
Presenting this set of slides with name three steps business workflow cycle chart ppt powerpoint presentation infographics vector. This is a three stage process. The stages in this process are three steps business workflow cycle chart. This is a completely editable PowerPoint presentation and is available for immediate download. Download now and impress your audience.

Concentric Sphere Chart Visual Corporate Goals For Employees Ppt Infographic Template Example Topics PDF
Presenting concentric sphere chart visual corporate goals for employees ppt infographic template example topics pdf to dispense important information. This template comprises three stages. It also presents valuable insights into the topics including concentric sphere chart visual corporate goals for employees. This is a completely customizable PowerPoint theme that can be put to use immediately. So, download it and address the topic impactfully.

Areas Of Management Circular Diagram Ppt PowerPoint Presentation Infographics Graphics Download PDF
Presenting this set of slides with name areas of management circular diagram ppt powerpoint presentation infographics graphics download pdf. This is a four stage process. The stages in this process are management, planning, operations, marketing, finance. This is a completely editable PowerPoint presentation and is available for immediate download. Download now and impress your audience.
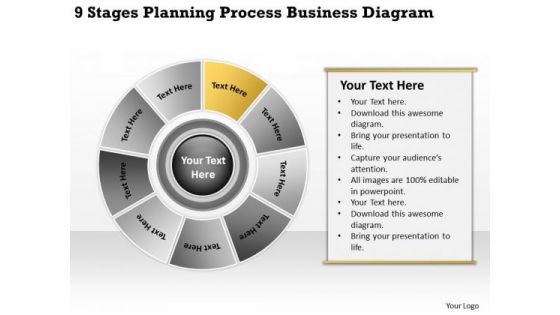
Process Business PowerPoint Theme Diagram Plans Format Templates
We present our process business powerpoint theme diagram plans format templates.Use our Circle Charts PowerPoint Templates because Our PowerPoint Templates and Slides have the Brilliant backdrops. Guaranteed to illuminate the minds of your audience. Present our Business PowerPoint Templates because Our PowerPoint Templates and Slides has conjured up a web of all you need with the help of our great team. Use them to string together your glistening ideas. Use our Shapes PowerPoint Templates because It will Strengthen your hand with your thoughts. They have all the aces you need to win the day. Present our Communication PowerPoint Templates because Our PowerPoint Templates and Slides will let your team Walk through your plans. See their energy levels rise as you show them the way. Download our Process and Flows PowerPoint Templates because Our PowerPoint Templates and Slides will effectively help you save your valuable time. They are readymade to fit into any presentation structure. Use these PowerPoint slides for presentations relating to steps, flow, diagram, chart, process, graph, wheel, pie, stages, segments, green, corporate, red, business, blank, arrow, yellow, curving, copyspace, slices, graphic, directional, shape, modern, cycle, illustration, circular, round, clipart, seven, colorful, clip, blue, infographic, art, work, puzzle, clockwise, financial. The prominent colors used in the PowerPoint template are Yellow, Gray, Black.

Ideas Business Analysis 8 Stages Ppt Design Plan PowerPoint Slides
We present our ideas business analysis 8 stages ppt design plan PowerPoint Slides.Download and present our Technology PowerPoint Templates because Our PowerPoint Templates and Slides will help you be quick off the draw. Just enter your specific text and see your points hit home. Download our Marketing PowerPoint Templates because Our PowerPoint Templates and Slides will let your words and thoughts hit bullseye everytime. Download and present our Circle Charts PowerPoint Templates because You can Connect the dots. Fan expectations as the whole picture emerges. Download our Light Bulbs PowerPoint Templates because It will mark the footprints of your journey. Illustrate how they will lead you to your desired destination. Download our Business PowerPoint Templates because It is Aesthetically crafted by artistic young minds. Our PowerPoint Templates and Slides are designed to display your dexterity.Use these PowerPoint slides for presentations relating to Pie, chart, graphicbusiness, finance, marketing, bulb, vector, symbol, lightbulb, diagram, orange, light, process, element, traditional, idea, graph, illustration, icon, energy, circular, round, clipart, planning, design, clip, set, success, infographic, transparency, technology, art, conceptual. The prominent colors used in the PowerPoint template are Blue, Black, White.
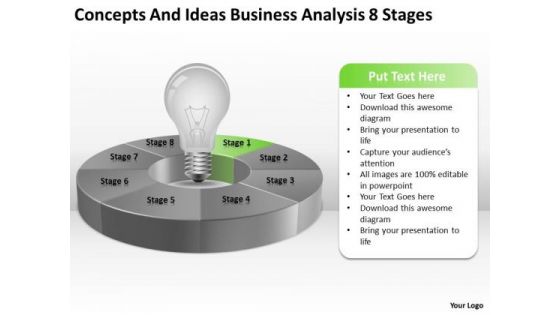
Ideas Business Analysis 8 Stages Ppt Plan Template PowerPoint Templates
We present our ideas business analysis 8 stages ppt plan template PowerPoint templates.Download our Technology PowerPoint Templates because Our PowerPoint Templates and Slides are a sure bet. Gauranteed to win against all odds. Use our Marketing PowerPoint Templates because you should Experience excellence with our PowerPoint Templates and Slides. They will take your breath away. Download our Circle Charts PowerPoint Templates because You can Connect the dots. Fan expectations as the whole picture emerges. Download and present our Light Bulbs PowerPoint Templates because You canTake a leap off the starting blocks with our PowerPoint Templates and Slides. They will put you ahead of the competition in quick time. Download and present our Business PowerPoint Templates because Your audience will believe you are the cats whiskers.Use these PowerPoint slides for presentations relating to Pie, chart, graphicbusiness, finance, marketing, bulb, vector, symbol, lightbulb, diagram, orange, light, process, element, traditional, idea, graph, illustration, icon, energy, circular, round, clipart, planning, design, clip, set, success, infographic, transparency, technology, art, conceptual. The prominent colors used in the PowerPoint template are Green, Gray, Black.
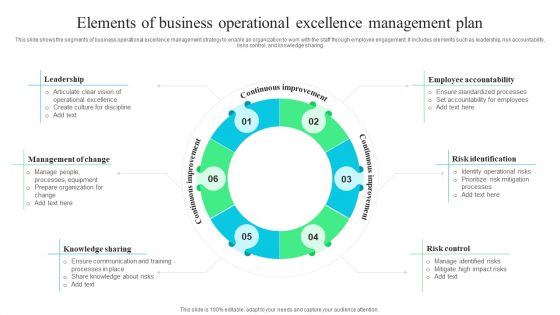
Elements Of Business Operational Excellence Management Plan Ppt Infographic Template Slideshow PDF
This slide shows the segments of business operational excellence management strategy to enable an organization to work with the staff through employee engagement. It includes elements such as leadership, risk accountability. Presenting Elements Of Business Operational Excellence Management Strategy Infographics PDF to dispense important information. This template comprises six stages. It also presents valuable insights into the topics including Leadership, Management Change, Knowledge Sharing. This is a completely customizable PowerPoint theme that can be put to use immediately. So, download it and address the topic impactfully.
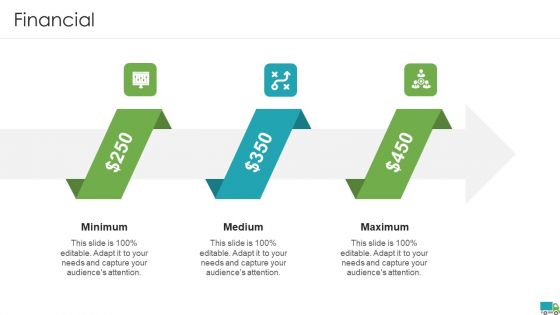
Generating Logistics Value Business Financial Elements PDF
This is a generating logistics value business fall in on time pickup percentage of hcl plus logistics company slides pdf template with various stages. Focus and dispense information on three stages using this creative set, that comes with editable features. It contains large content boxes to add your information on topics like fall in on time pickup percentage of hcl plus logistics company for 5 years. You can also showcase facts, figures, and other relevant content using this PPT layout. Grab it now.

Managing Stakeholder Relationship Solutions To Overcome The Challenges Slides PDF
This slide shows the solutions to overcome the challenges in stakeholder relationship management which includes understanding a stakeholder relationship, 5 ws technique, etc.There are so many reasons you need a Managing Stakeholder Relationship Solutions To Overcome The Challenges Slides PDF. The first reason is you cant spend time making everything from scratch, Thus, Slidegeeks has made presentation templates for you too. You can easily download these templates from our website easily.

Manufacturing Work Flow Chart Ppt PowerPoint Presentation Infographic Template Example 2015 Cpb Pdf
Presenting this set of slides with name manufacturing work flow chart ppt powerpoint presentation infographic template example 2015 cpb pdf. This is an editable Powerpoint four stages graphic that deals with topics like manufacturing work flow chart to help convey your message better graphically. This product is a premium product available for immediate download and is 100 percent editable in Powerpoint. Download this now and use it in your presentations to impress your audience.

Clustered Column Chart Ppt PowerPoint Presentation Infographics Background Image Cpb Pdf
Presenting this set of slides with name clustered column chart ppt powerpoint presentation infographics background image cpb pdf. This is an editable Powerpoint six stages graphic that deals with topics like clustered column chart to help convey your message better graphically. This product is a premium product available for immediate download and is 100 percent editable in Powerpoint. Download this now and use it in your presentations to impress your audience.

Concentric Sphere Chart Visual For Create A Organizer Ppt Infographic Template Example File
Persuade your audience using this concentric sphere chart visual for create a organizer ppt infographic template example file. This PPT design covers four stages, thus making it a great tool to use. It also caters to a variety of topics including concentric sphere chart visual for create a organizer. Download this PPT design now to present a convincing pitch that not only emphasizes the topic but also showcases your presentation skills.

Your Requirement And Solution For New Service Roll Out And Design Project Plan Proposal One Pager Sample Example Document
Purpose of the following slide is to show the overview and the goals of the project, as it defines the organizations requirement and the solution with 5 key phases. Presenting you an exemplary Your Requirement And Solution For New Service Roll Out And Design Project Plan Proposal One Pager Sample Example Document. Our one-pager comprises all the must-have essentials of an inclusive document. You can edit it with ease, as its layout is completely editable. With such freedom, you can tweak its design and other elements to your requirements. Download this Your Requirement And Solution For New Service Roll Out And Design Project Plan Proposal One Pager Sample Example Document brilliant piece now.
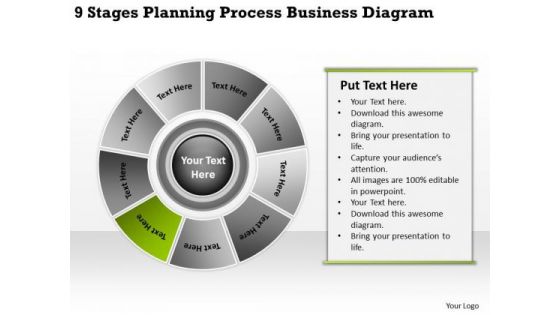
Process Business PowerPoint Theme Diagram Continuity Plans Templates
We present our process business powerpoint theme diagram continuity plans templates.Download and present our Circle Charts PowerPoint Templates because It can Bubble and burst with your ideas. Present our Business PowerPoint Templates because Our PowerPoint Templates and Slides will bullet point your ideas. See them fall into place one by one. Use our Shapes PowerPoint Templates because our PowerPoint Templates and Slides will give your ideas the shape. Present our Communication PowerPoint Templates because It will let you Set new benchmarks with our PowerPoint Templates and Slides. They will keep your prospects well above par. Download our Process and Flows PowerPoint Templates because You canTake a leap off the starting blocks with our PowerPoint Templates and Slides. They will put you ahead of the competition in quick time.Use these PowerPoint slides for presentations relating to steps, flow, diagram, chart, process, graph, wheel, pie, stages, segments, green, corporate, red, business, blank, arrow, yellow, curving, copyspace, slices, graphic, directional, shape, modern, cycle, illustration, circular, round, clipart, seven, colorful, clip, blue, infographic, art, work, puzzle, clockwise, financial. The prominent colors used in the PowerPoint template are Green, Gray, Black.
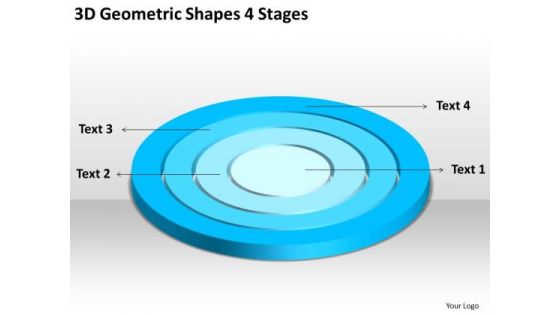
3d Geometric Shapes 4 Stages Written Business Plan PowerPoint Templates
We present our 3d geometric shapes 4 stages written business plan PowerPoint templates.Download and present our Circle Charts PowerPoint Templates because Our PowerPoint Templates and Slides will provide weight to your words. They will bring out the depth of your thought process. Download our Shapes PowerPoint Templates because Our PowerPoint Templates and Slides will let you Hit the target. Go the full distance with ease and elan. Download and present our Signs PowerPoint Templates because They will bring a lot to the table. Their alluring flavours will make your audience salivate. Download our Maketing PowerPoint Templates because Our PowerPoint Templates and Slides come in all colours, shades and hues. They help highlight every nuance of your views. Use our Metaphors-Visual Concepts PowerPoint Templates because you can Break through with our PowerPoint Templates and Slides. Bring down the mental barriers of your audience.Use these PowerPoint slides for presentations relating to diagram, circular, market, bar, advertise, interface, business, concept, vector, sign, success, presentation, symbol, template, circle, brochure, finance, data, description, report, marketing, title, label, abstract, management, graph, four, illustration, icon, pie, chart, strategy, catalog, research, web, design, growth, text, professional, banner, account, profit, information, background, info-graphic, analyze, financial, button, goals. The prominent colors used in the PowerPoint template are Blue, Blue light, White.
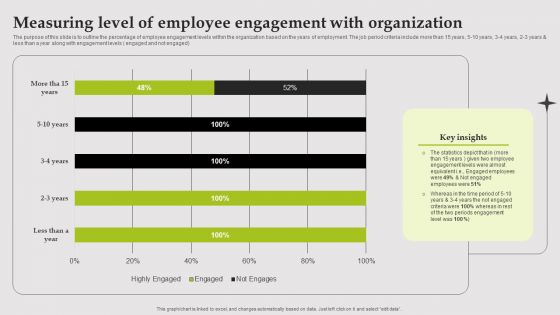
Measuring Level Of Employee Engagement With Organization Designs PDF
The purpose of this slide is to outline the percentage of employee engagement levels within the organization based on the years of employment. The job period criteria include more than 15 years, 5 10 years, 3 4 years, 2 3 years and less than a year along with engagement levels engaged and not engaged. Showcasing this set of slides titled Measuring Level Of Employee Engagement With Organization Designs PDF. The topics addressed in these templates are Employee, Equivalent, Organization. All the content presented in this PPT design is completely editable. Download it and make adjustments in color, background, font etc. as per your unique business setting.
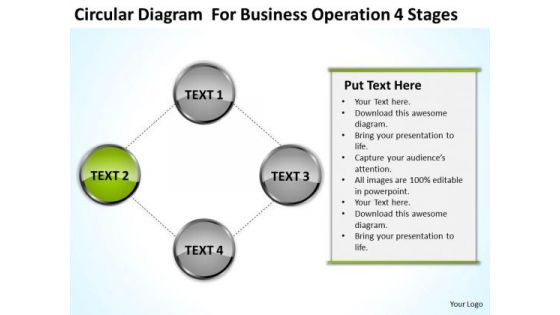
Diagram For Business Operation 4 Stages Ppt Plan PowerPoint Slides
We present our diagram for business operation 4 stages ppt plan PowerPoint Slides.Download and present our Arrows PowerPoint Templates because Our PowerPoint Templates and Slides have the Brilliant backdrops. Guaranteed to illuminate the minds of your audience. Present our Process and Flows PowerPoint Templates because Our PowerPoint Templates and Slides will effectively help you save your valuable time. They are readymade to fit into any presentation structure. Present our Business PowerPoint Templates because These PowerPoint Templates and Slides will give the updraft to your ideas. See them soar to great heights with ease. Download and present our Flow Charts PowerPoint Templates because our PowerPoint Templates and Slides are the string of your bow. Fire of your ideas and conquer the podium. Use our Shapes PowerPoint Templates because Our PowerPoint Templates and Slides are topically designed to provide an attractive backdrop to any subject.Use these PowerPoint slides for presentations relating to Diagram, business, decoration, form, components, step, layout, interface, plan, concept, vector, presentation, internet, circle, scheme, marketing, abstract, cycle, stage, circular, system, options, strategy, project, processes, term, solution, design, color, set, organization, infographic, four, art, connected, career, part, structure, arrows, communication. The prominent colors used in the PowerPoint template are Green, Gray, Black.

12 Steps For Creating Business Strategy In Round Chart Ppt Infographics Guide PDF
Presenting 12 steps for creating business strategy in round chart ppt infographics guide pdf to dispense important information. This template comprises twelve stages. It also presents valuable insights into the topics including business, strategy, evaluation. This is a completely customizable PowerPoint theme that can be put to use immediately. So, download it and address the topic impactfully.
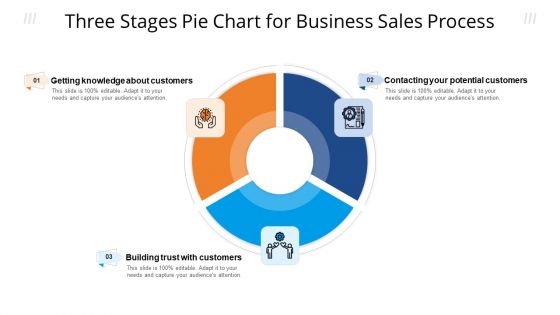
Three Stages Pie Chart For Business Sales Process Ppt Infographic Template Aids PDF
Presenting three stages pie chart for business sales process ppt infographic template aids pdf to dispense important information. This template comprises three stages. It also presents valuable insights into the topics including customers, knowledge about customers, potential customers. This is a completely customizable PowerPoint theme that can be put to use immediately. So, download it and address the topic impactfully.
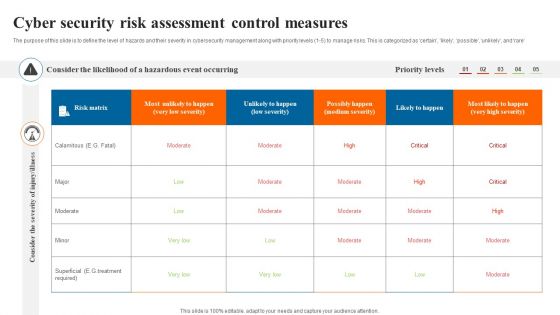
Cyber Security Risk Assessment Control Measures Slides PDF
The purpose of this slide is to define the level of hazards and their severity in cybersecurity management along with priority levels 1 to 5 to manage risks. This is categorized as certain likely possible unlikely and rare. Showcasing this set of slides titled Cyber Security Risk Assessment Control Measures Slides PDF. The topics addressed in these templates are Cyber Security Risk, Assessment Control Measures. All the content presented in this PPT design is completely editable. Download it and make adjustments in color, background, font etc. as per your unique business setting.
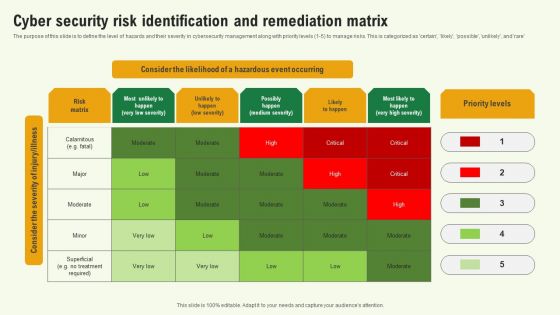
Cyber Security Risk Identification And Remediation Matrix Background PDF
The purpose of this slide is to define the level of hazards and their severity in cybersecurity management along with priority levels 1 to 5 to manage risks. This is categorized as certain, likely, possible, unlikel, and rare. Showcasing this set of slides titled Cyber Security Risk Identification And Remediation Matrix Background PDF. The topics addressed in these templates are Cyber Security Risk Identification, Remediation Matrix. All the content presented in this PPT design is completely editable. Download it and make adjustments in color, background, font etc. as per your unique business setting.
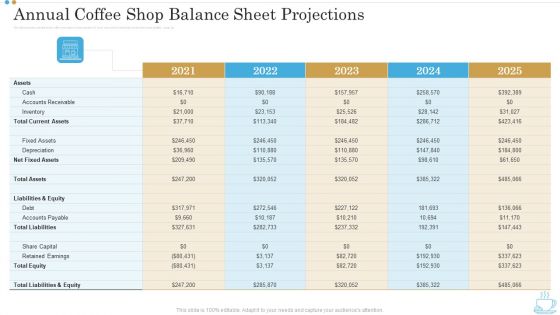
Annual Coffee Shop Balance Sheet Projections Business Plan For Opening A Coffeehouse Ppt Infographic Template Backgrounds PDF
This slide shows the projected annual coffee shop balance sheet projections for next 5 years which includes total assets, fixed assets, liabilities, equity, etc. Deliver and pitch your topic in the best possible manner with this annual coffee shop balance sheet projections business plan for opening a coffeehouse ppt infographic template backgrounds pdf. Use them to share invaluable insights on liabilities and equity, depreciation, accounts receivable, inventory, net fixed assets and impress your audience. This template can be altered and modified as per your expectations. So, grab it now.

Risk Assessment Software Dashboard For Cybersecurity Ppt PowerPoint Presentation Gallery Pictures PDF
This slide represents risk assessment software dashboard for cybersecurity. It includes risk percentage, number of risks, risk analysis progress, risk response progress, risk rating etc. Showcasing this set of slides titled Risk Assessment Software Dashboard For Cybersecurity Ppt PowerPoint Presentation Gallery Pictures PDF. The topics addressed in these templates are Risk Rating Breakdown, Action Plan Breakdown, Top 5 Entities Prone To Risk. All the content presented in this PPT design is completely editable. Download it and make adjustments in color, background, font etc. as per your unique business setting.
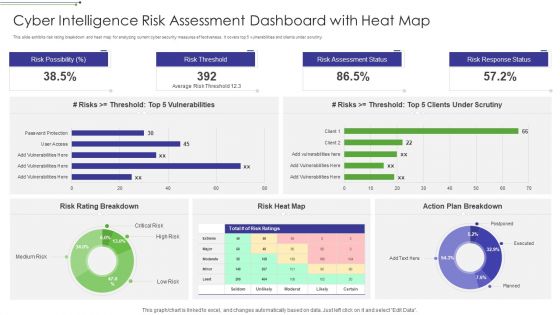
Cyber Intelligence Risk Assessment Dashboard With Heat Map Portrait PDF
This slide exhibits risk rating breakdown and heat map for analyzing current cyber security measures effectiveness. It covers top 5 vulnerabilities and clients under scrutiny. Pitch your topic with ease and precision using this Cyber Intelligence Risk Assessment Dashboard With Heat Map Portrait PDF This layout presents information on Risk Rating Breakdown, Action Plan Breakdown, Risk Possibility It is also available for immediate download and adjustment. So, changes can be made in the color, design, graphics or any other component to create a unique layout.

Information Security Risk Evaluation Risk Management Dashboard For Information Security Summary PDF
This slide showcases dashboard that can help organization to track the major information security risks and resolve them in timely manner. Its key components are risk rating breakdown, heat map, action plan and top 5 vulnerabilities.Deliver and pitch your topic in the best possible manner with this Information Security Risk Evaluation Risk Management Dashboard For Information Security Summary PDF. Use them to share invaluable insights on Rating Breakdown, Vulnerabilities, Response Progress and impress your audience. This template can be altered and modified as per your expectations. So, grab it now.

Net Profit Medical Research And Development Company Profile CP SS V
Mentioned slide provides information about company profit for the year for last 5 years. It includes key components such as net profit, net margin, and key insights. Explore a selection of the finest Net Profit Medical Research And Development Company Profile CP SS V here. With a plethora of professionally designed and pre-made slide templates, you can quickly and easily find the right one for your upcoming presentation. You can use our Net Profit Medical Research And Development Company Profile CP SS V to effectively convey your message to a wider audience. Slidegeeks has done a lot of research before preparing these presentation templates. The content can be personalized and the slides are highly editable. Grab templates today from Slidegeeks.
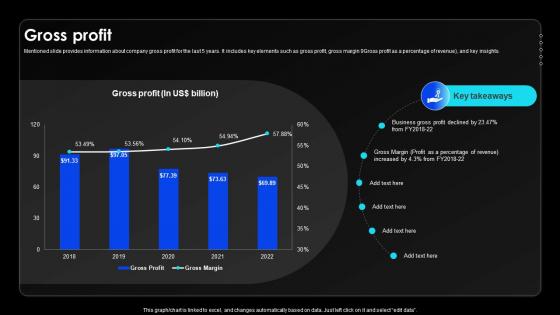
Gross Profit Wireless Communication Services Provider Company Profile CP SS V
Mentioned slide provides information about company gross profit for the last 5 years. It includes key elements such as gross profit, gross margin 9Gross profit as a percentage of revenue, and key insights.Crafting an eye-catching presentation has never been more straightforward. Let your presentation shine with this tasteful yet straightforward Gross Profit Wireless Communication Services Provider Company Profile CP SS V template. It offers a minimalistic and classy look that is great for making a statement. The colors have been employed intelligently to add a bit of playfulness while still remaining professional. Construct the ideal Gross Profit Wireless Communication Services Provider Company Profile CP SS V that effortlessly grabs the attention of your audience Begin now and be certain to wow your customers
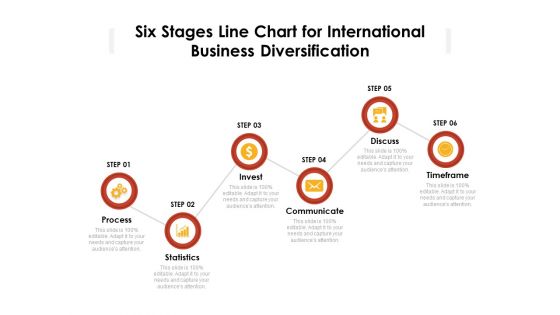
Six Stages Line Chart For International Business Diversification Ppt PowerPoint Presentation Infographic Template Professional PDF
Persuade your audience using this six stages line chart for international business diversification ppt powerpoint presentation infographic template professional pdf. This PPT design covers six stages, thus making it a great tool to use. It also caters to a variety of topics including process, statistics, invest, communicate, timeframe, discuss. Download this PPT design now to present a convincing pitch that not only emphasizes the topic but also showcases your presentation skills.

Three Stages Pie Chart For Business Decision Making Process Ppt Infographic Template Slides PDF
Persuade your audience using this three stages pie chart for business decision making process ppt infographic template slides pdf. This PPT design covers three stages, thus making it a great tool to use. It also caters to a variety of topics including collecting valuable information, different options, interpreting facts. Download this PPT design now to present a convincing pitch that not only emphasizes the topic but also showcases your presentation skills.
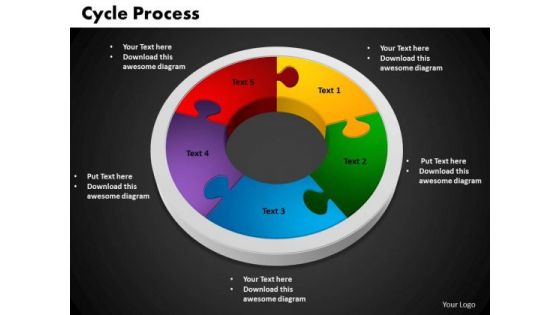
PowerPoint Slides Cycle Process Chart Ppt Template
PowerPoint Slides Cycle Process Chart PPT Template-Cycle Diagrams are a type of graphics that shows how items are related to one another in a repeating cycle. In a cycle diagram, you can explain the main events in the cycle, how they interact, and how the cycle repeats.-PowerPoint Slides Cycle Process Chart PPT Template-Cycle, Design, Diagram, Element, Graph, Business, Chart, Circular, Connect, Connection, Puzzle, Round, Solving, Step, Together, Putting, Mystery, Linking, Infographic, Icon,
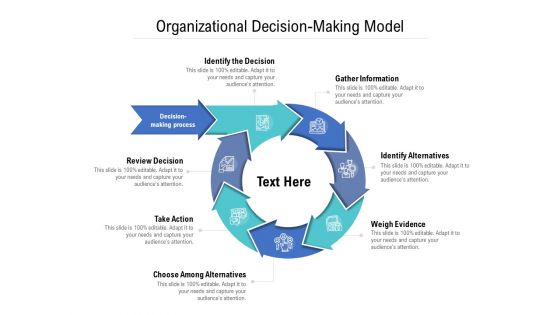
Organizational Decision Making Model Ppt PowerPoint Presentation Infographic Template Slideshow
Presenting this set of slides with name organizational decision making model ppt powerpoint presentation infographic template slideshow. This is a seven stage process. The stages in this process are gather information, identify alternatives, weigh evidence, choose among alternatives, take action, review decision, identify the decision. This is a completely editable PowerPoint presentation and is available for immediate download. Download now and impress your audience.
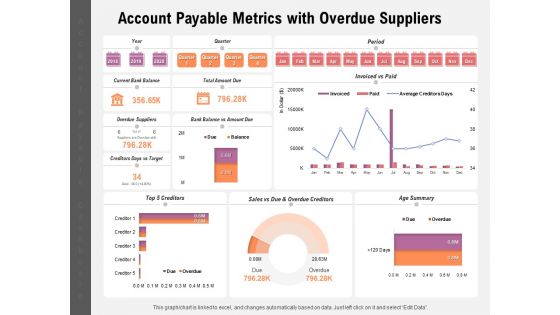
Account Payable Metrics With Overdue Suppliers Ppt PowerPoint Presentation Ideas Graphics Download PDF
Presenting this set of slides with name account payable metrics with overdue suppliers ppt powerpoint presentation ideas graphics download pdf. The topics discussed in these slides are overdue suppliers, bank balance vs amount due, total amount due, current bank balance, quarter, period, age summary, sales vs due and overdue creditors, top 5 creditors. This is a completely editable PowerPoint presentation and is available for immediate download. Download now and impress your audience.
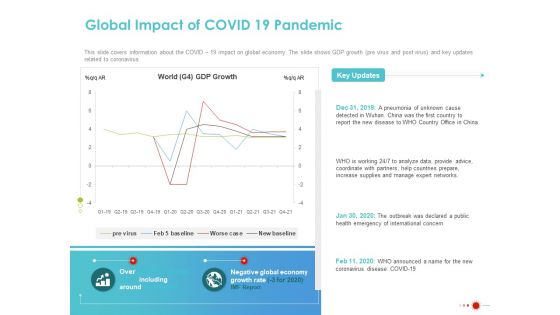
COVID 19 Mitigating Impact On High Tech Industry Global Impact Of Covid 19 Pandemic Microsoft PDF
Presenting this set of slides with name covid 19 mitigating impact on high tech industry global impact of covid 19 pandemic microsoft pdf. The topics discussed in these slides are negative global economy growth rate, world gdp growth, pre virus, feb 5 baseline, new baseline, worse case. This is a completely editable PowerPoint presentation and is available for immediate download. Download now and impress your audience.

Firm Productivity Administration Business Intelligence KPI Dashboard Assets Ppt PowerPoint Presentation Slides Background Designs PDF
Presenting this set of slides with name firm productivity administration business intelligence kpi dashboard assets ppt powerpoint presentation slides background designs pdf. The topics discussed in these slides are expenses class, top 5 accounts receivables balance, assets profile, working capital, checking savings, monthly revenues and expenses. This is a completely editable PowerPoint presentation and is available for immediate download. Download now and impress your audience.

Enterprise Problem Solving And Intellect Business Intelligence KPI Dashboard Profile Ppt PowerPoint Presentation Summary Structure PDF
Presenting this set of slides with name enterprise problem solving and intellect business intelligence kpi dashboard profile ppt powerpoint presentation summary structure pdf. The topics discussed in these slides are expenses class, top 5 accounts receivables balance, assets profile, working capital, checking savings, monthly revenues and expenses. This is a completely editable PowerPoint presentation and is available for immediate download. Download now and impress your audience.
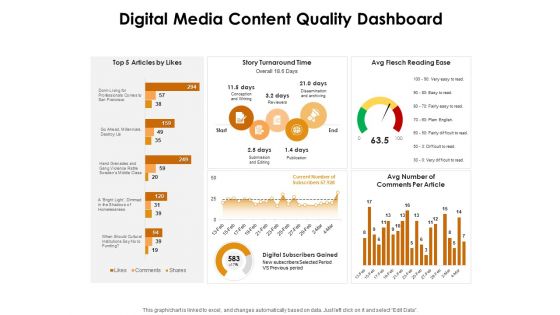
KPI Dashboards Per Industry Digital Media Content Quality Dashboard Ppt PowerPoint Presentation Layouts Clipart Images PDF
Deliver an awe-inspiring pitch with this creative kpi dashboards per industry digital media content quality dashboard ppt powerpoint presentation layouts clipart images pdf bundle. Topics like top 5 articles by likes, story turnaround time, avg flesch reading ease, avg number of comments per article can be discussed with this completely editable template. It is available for immediate download depending on the needs and requirements of the user.
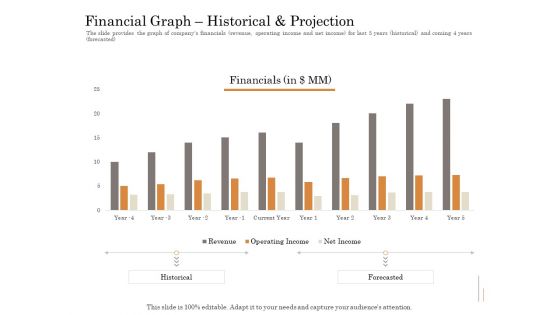
Subordinated Loan Funding Financial Graph Historical And Projection Ppt Model File Formats PDF
The slide provides the graph of companys financials revenue, operating income and net income for last 5 years historical and coming 4 years forecasted. Deliver and pitch your topic in the best possible manner with this subordinated loan funding financial graph historical and projection ppt model file formats pdf. Use them to share invaluable insights on revenue, operating income, net income, current year. and impress your audience. This template can be altered and modified as per your expectations. So, grab it now.

Hybrid Investment Pitch Deck Financial Graph Historical And Projection Ppt Portfolio Design Inspiration PDF
The slide provides the graph of companys financials revenue, operating income and net income for last 5 years historical and coming 4 years forecasted. Deliver an awe inspiring pitch with this creative hybrid investment pitch deck financial graph historical and projection ppt portfolio design inspiration pdf bundle. Topics like financial, revenue, operating income, net income can be discussed with this completely editable template. It is available for immediate download depending on the needs and requirements of the user.
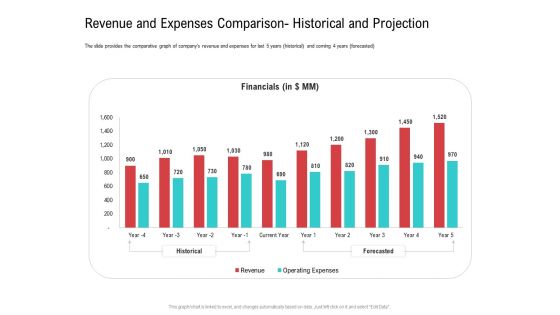
Revenue And Expenses Comparison Historical And Projection Professional PDF
The slide provides the comparative graph of companys revenue and expenses for last 5 years historical and coming 4 years forecasted. Deliver and pitch your topic in the best possible manner with this revenue and expenses comparison historical and projection professional pdf. Use them to share invaluable insights on revenue, financial, operating expenses and impress your audience. This template can be altered and modified as per your expectations. So, grab it now.
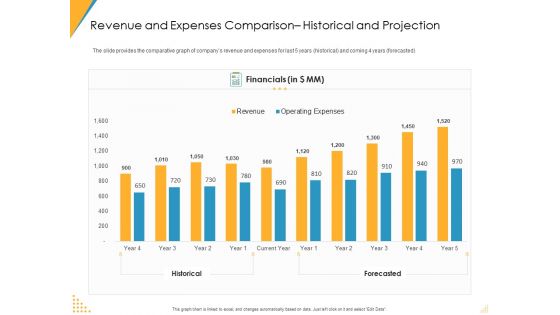
Revenue And Expenses Comparison Historical And Projection Ppt Ideas Slide Download PDF
The slide provides the comparative graph of companys revenue and expenses for last 5 years historical and coming 4 years forecasted. Deliver an awe-inspiring pitch with this creative revenue and expenses comparison historical and projection ppt ideas slide download pdf bundle. Topics like revenue, operating expenses, historical, forecasted can be discussed with this completely editable template. It is available for immediate download depending on the needs and requirements of the user.
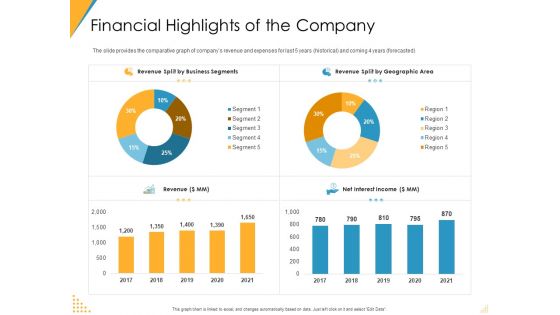
Investor Pitch Deck Post Market Financing Financial Highlights Of The Company Demonstration PDF
The slide provides the comparative graph of companys revenue and expenses for last 5 years historical and coming 4 years forecasted. Deliver an awe-inspiring pitch with this creative investor pitch deck post market financing financial highlights of the company demonstration pdf bundle. Topics like revenue, revenue split by business segments, revenue split by geographic area, net interest income can be discussed with this completely editable template. It is available for immediate download depending on the needs and requirements of the user.
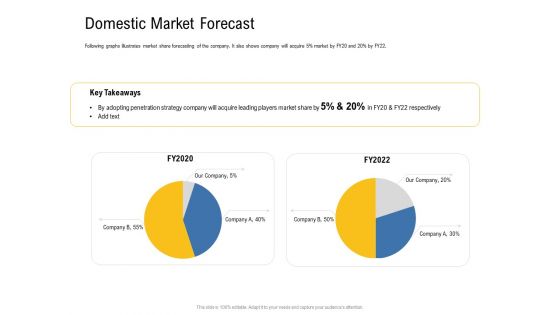
IOT Industry Assessment Domestic Market Forecast Ppt Inspiration Infographic Template PDF
Following graphs illustrates market share forecasting of the company. It also shows company will acquire 5 percent market by FY20 and 20 pervent by FY22. Deliver and pitch your topic in the best possible manner with this iot industry assessment domestic market forecast ppt inspiration infographic template pdf. Use them to share invaluable insights on domestic market forecast and impress your audience. This template can be altered and modified as per your expectations. So, grab it now.

Revenue And Expenses Comparison Historical And Projection Ppt Show Format PDF
The slide provides the comparative graph of companys revenue and expenses for last 5 years historical and coming 4 years forecasted. Deliver an awe-inspiring pitch with this creative revenue and expenses comparison historical and projection ppt show format pdf bundle. Topics like historical, forecasted, financials can be discussed with this completely editable template. It is available for immediate download depending on the needs and requirements of the user.

Revenue And Expenses Comparison Historical And Projection Structure PDF
The slide provides the comparative graph of companys revenue and expenses for last 5 years historical and coming 4 years forecasted. Deliver an awe-inspiring pitch with this creative revenue and expenses comparison historical and projection structure pdf bundle. Topics like financials, revenue, operating expenses can be discussed with this completely editable template. It is available for immediate download depending on the needs and requirements of the user.

Investor Pitch Deck To Collect Capital From Subordinated Loan Financial Graph Historical And Projection Introduction PDF
The slide provides the graph of companys financials revenue, operating income and net income for last 5 years historical and coming 4 years forecasted. Deliver an awe-inspiring pitch with this creative investor pitch deck to collect capital from subordinated loan financial graph historical and projection introduction pdf bundle. Topics like financials, net income, operating income, revenue, historical, forecasted can be discussed with this completely editable template. It is available for immediate download depending on the needs and requirements of the user.

Post Initial Pubic Offering Market Pitch Deck Revenue And Expenses Comparison Historical And Projection Sample PDF
The slide provides the comparative graph of companys revenue and expenses for last 5 years historical and coming 4 years forecasted.Deliver an awe-inspiring pitch with this creative post initial pubic offering market pitch deck revenue and expenses comparison historical and projection sample pdf. bundle. Topics like financials, 2017 to 2026 can be discussed with this completely editable template. It is available for immediate download depending on the needs and requirements of the user.

 Home
Home