Kpi Comparison
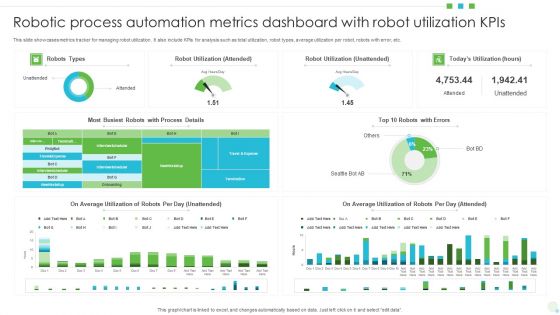
Robotic Process Automation Metrics Dashboard With Robot Utilization Kpis Background PDF
This slide showcases metrics tracker for managing robot utilization. It also include KPIs for analysis such as total utilization, robot types, average utilization per robot, robots with error, etc. Pitch your topic with ease and precision using this Robotic Process Automation Metrics Dashboard With Robot Utilization Kpis Background PDF. This layout presents information on Average Utilization, Robot Utilization, Automation Metrics Dashboard. It is also available for immediate download and adjustment. So, changes can be made in the color, design, graphics or any other component to create a unique layout.

Key Metrics To Track After 30 60 90 Days Of Event Elements PDF
The slide showcases the 30 60 90 day plan that help structure post event strategy and to successfully report event success. It covers metrics relating to immediately after event, post 30 days and post 60 days. Pitch your topic with ease and precision using this Key Metrics To Track After 30 60 90 Days Of Event Elements PDF. This layout presents information on Timeline, Post Event, Metrics. It is also available for immediate download and adjustment. So, changes can be made in the color, design, graphics or any other component to create a unique layout.

Evolution Of Comparative Market Analysis In Retail Services Information Pdf
This slide exhibits development of business intelligence to assess metrics for product performance tracking. It helps retailers make better decisions with data driven insights on store performance. It presents information related to enabling technologies, casual variables, etc.Showcasing this set of slides titled Evolution Of Comparative Market Analysis In Retail Services Information Pdf The topics addressed in these templates are Enable Technologies, Performance Measures, Casual Variables All the content presented in this PPT design is completely editable. Download it and make adjustments in color, background, font etc. as per your unique business setting.

Marketing Success Metrics Introduction To Social Media Analytics To Increase Graphics PDF
This slide covers an overview of social media analytics to increase new customers. It also includes the benefits of social media analytics, such as boosting social media campaign performance, improving crisis management, maximizing product launches, lower customer care costs, etc. Do you know about Slidesgeeks Marketing Success Metrics Introduction To Social Media Analytics To Increase Graphics PDF These are perfect for delivering any kind od presentation. Using it, create PowerPoint presentations that communicate your ideas and engage audiences. Save time and effort by using our pre-designed presentation templates that are perfect for a wide range of topic. Our vast selection of designs covers a range of styles, from creative to business, and are all highly customizable and easy to edit. Download as a PowerPoint template or use them as Google Slides themes.

Deliver Efficiency Innovation Metrics Used By Product Leader To Measure Performance Microsoft PDF
This slide focuses on metrics used by product leader to measure performance such as net promoter score, feature adoption, retention rate, churn rate, customer satisfaction, stickiness, etc. Deliver and pitch your topic in the best possible manner with this Deliver Efficiency Innovation Metrics Used By Product Leader To Measure Performance Microsoft PDF. Use them to share invaluable insights on Feature Adoption, Churn Rate, Customer Satisfaction, Conversion Rate and impress your audience. This template can be altered and modified as per your expectations. So, grab it now.
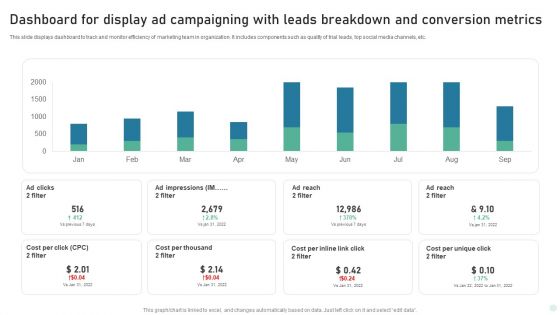
Dashboard For Display Ad Campaigning With Leads Breakdown And Conversion Metrics Inspiration PDF
This slide displays dashboard to track and monitor efficiency of marketing team in organization. It includes components such as quality of trial leads, top social media channels, etc. Showcasing this set of slides titled Dashboard For Display Ad Campaigning With Leads Breakdown And Conversion Metrics Inspiration PDF. The topics addressed in these templates are Dashboard Display, Ad Campaigning, Conversion Metrics. All the content presented in this PPT design is completely editable. Download it and make adjustments in color, background, font etc. as per your unique business setting.
Tracking Pipeline Steps Using Sales Metrics Ppt PowerPoint Presentation File Outline PDF
Pitch your topic with ease and precision using this tracking pipeline steps using sales metrics ppt powerpoint presentation file outline pdf. This layout presents information on qualified leads every month, monthly sales cycle, number of leads at each stage of pipeline, win rate based on deal size. It is also available for immediate download and adjustment. So, changes can be made in the color, design, graphics or any other component to create a unique layout.
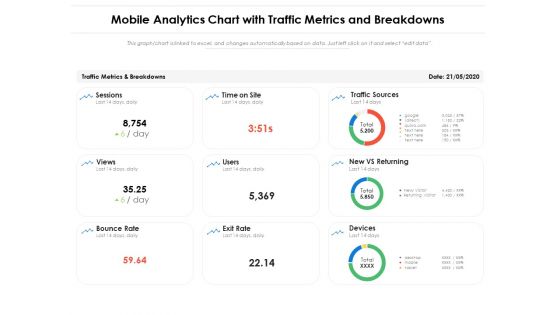
Mobile Analytics Chart With Traffic Metrics And Breakdowns Ppt PowerPoint Presentation Ideas Layout PDF
Pitch your topic with ease and precision using this mobile analytics chart with traffic metrics and breakdowns ppt powerpoint presentation ideas layout pdf. This layout presents information on traffic sources, new vs returning, devices, bounce rate, sessions. It is also available for immediate download and adjustment. So, changes can be made in the color, design, graphics or any other component to create a unique layout.
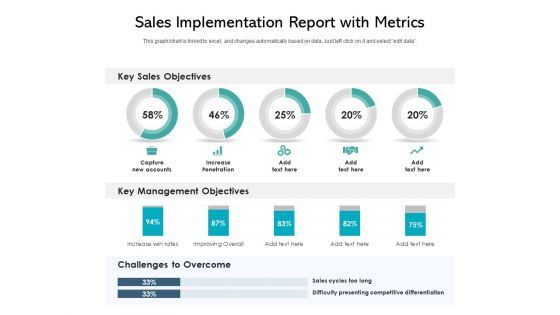
Sales Implementation Report With Metrics Ppt PowerPoint Presentation Portfolio Aids PDF
Pitch your topic with ease and precision using this sales implementation report with metrics ppt powerpoint presentation portfolio aids pdf. This layout presents information on key sales objectives, key management objectives, challenges to overcome, capture new accounts, increase penetration. It is also available for immediate download and adjustment. So, changes can be made in the color, design, graphics or any other component to create a unique layout.
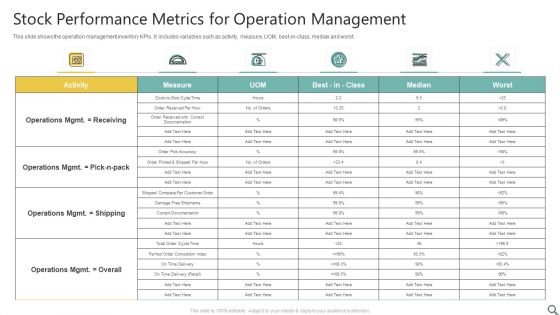
Stock Performance Metrics For Operation Management Ppt Ideas Format Ideas PDF
This slide shows the operation management inventory KPIs. It includes variables such as activity, measure, UOM, best-in-class, median and worst. Pitch your topic with ease and precision using this Stock Performance Metrics For Operation Management Ppt Ideas Format Ideas PDF. This layout presents information on Operations Mgmt, Shipping, Overall. It is also available for immediate download and adjustment. So, changes can be made in the color, design, graphics or any other component to create a unique layout.
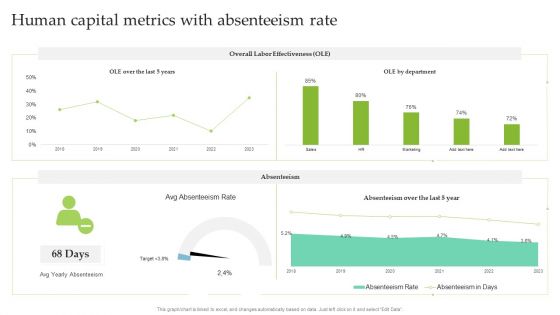
Human Capital Metrics With Absenteeism Rate Ppt Infographic Template Ideas PDF
This graph or chart is linked to excel, and changes automatically based on data. Just left click on it and select Edit Data. Pitch your topic with ease and precision using this Human Capital Metrics With Absenteeism Rate Ppt Infographic Template Ideas PDF. This layout presents information on Overall Labor Effectiveness, OLE Department, Absenteeism. It is also available for immediate download and adjustment. So, changes can be made in the color, design, graphics or any other component to create a unique layout.

Human Capital Metrics With Salary Variability Ppt Infographic Template Designs PDF
This graph or chart is linked to excel, and changes automatically based on data. Just left click on it and select Edit Data. Pitch your topic with ease and precision using this Human Capital Metrics With Salary Variability Ppt Infographic Template Designs PDF. This layout presents information on Salary Distribution, Salary Competitiveness Ratio, Male. It is also available for immediate download and adjustment. So, changes can be made in the color, design, graphics or any other component to create a unique layout.
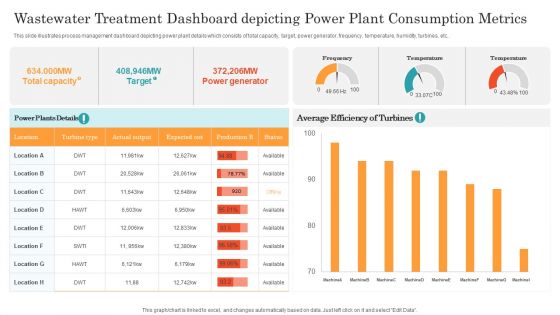
Wastewater Treatment Dashboard Depicting Power Plant Consumption Metrics Ppt Slides Tips PDF
This slide illustrates process management dashboard depicting power plant details which consists of total capacity, target, power generator, frequency, temperature, humidity, turbines, etc. Pitch your topic with ease and precision using this Wastewater Treatment Dashboard Depicting Power Plant Consumption Metrics Ppt Slides Tips PDF. This layout presents information on Power Generator, Target, Actual Output. It is also available for immediate download and adjustment. So, changes can be made in the color, design, graphics or any other component to create a unique layout.

Customer NPS Metric With Revenue Growth Impact Ppt Show Portrait PDF
This slide illustrates net promoter score with revenue growth impact. It provides information about market average NPS, respondents, promoter, detractor, passive, etc. Pitch your topic with ease and precision using this Customer NPS Metric With Revenue Growth Impact Ppt Show Portrait PDF. This layout presents information on Promoter, Detractor, Passive. It is also available for immediate download and adjustment. So, changes can be made in the color, design, graphics or any other component to create a unique layout.
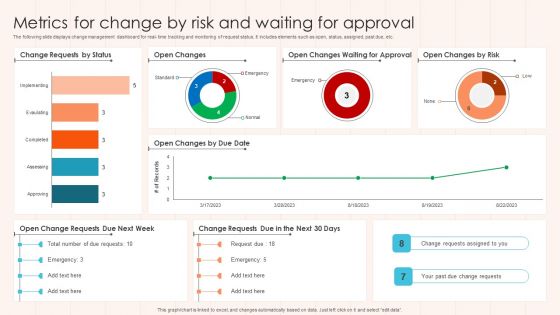
Metrics For Change By Risk And Waiting For Approval Diagrams PDF
The following slide displays change management dashboard for real- time tracking and monitoring of request status. It includes elements such as open, status, assigned, past due, etc. Pitch your topic with ease and precision using this Metrics For Change By Risk And Waiting For Approval Diagrams PDF This layout presents information on Approval, Risk, Status. It is also available for immediate download and adjustment. So, changes can be made in the color, design, graphics or any other component to create a unique layout.

How To Boost Brand Recognition Brand Awareness Metrics Sentiment Analysis Diagrams PDF
This slide provides information regarding sentiment analysis or opinion mining as brand awareness metrics. It helps in identifying key influencer across social network. The slide also include key initiatives to manage sentiment analysis. Presenting this PowerPoint presentation, titled How To Boost Brand Recognition Brand Awareness Metrics Sentiment Analysis Diagrams PDF, with topics curated by our researchers after extensive research. This editable presentation is available for immediate download and provides attractive features when used. Download now and captivate your audience. Presenting this How To Boost Brand Recognition Brand Awareness Metrics Sentiment Analysis Diagrams PDF. Our researchers have carefully researched and created these slides with all aspects taken into consideration. This is a completely customizable How To Boost Brand Recognition Brand Awareness Metrics Sentiment Analysis Diagrams PDF that is available for immediate downloading. Download now and make an impact on your audience. Highlight the attractive features available with our PPTs.

Agile Software Programming Module For IT Agile Performance Evaluation Metrics Diagrams PDF
This slide covers the metrics used by the organisation to measure agile capability on the basis of product performance, security level and user satisfaction. Presenting this PowerPoint presentation, titled Agile Software Programming Module For IT Agile Performance Evaluation Metrics Diagrams PDF, with topics curated by our researchers after extensive research. This editable presentation is available for immediate download and provides attractive features when used. Download now and captivate your audience. Presenting this Agile Software Programming Module For IT Agile Performance Evaluation Metrics Diagrams PDF. Our researchers have carefully researched and created these slides with all aspects taken into consideration. This is a completely customizable Agile Software Programming Module For IT Agile Performance Evaluation Metrics Diagrams PDF that is available for immediate downloading. Download now and make an impact on your audience. Highlight the attractive features available with our PPTs.

Tactical Communication Plan Metrics To Measure Customer And Revenue Churn Demonstration PDF
This slide focuses on metrics to measure customer and revenue churn which also shows net promoter score, customer loyalty rate, percentage of premium users, customer lifetime value, etc. Presenting this PowerPoint presentation, titled Tactical Communication Plan Metrics To Measure Customer And Revenue Churn Demonstration PDF, with topics curated by our researchers after extensive research. This editable presentation is available for immediate download and provides attractive features when used. Download now and captivate your audience. Presenting this Tactical Communication Plan Metrics To Measure Customer And Revenue Churn Demonstration PDF. Our researchers have carefully researched and created these slides with all aspects taken into consideration. This is a completely customizable Tactical Communication Plan Metrics To Measure Customer And Revenue Churn Demonstration PDF that is available for immediate downloading. Download now and make an impact on your audience. Highlight the attractive features available with our PPTs.

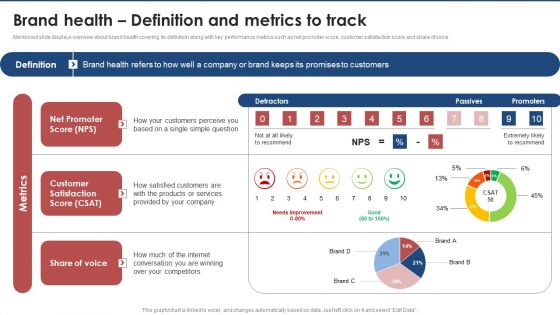
Comprehensive Guide To Strengthen Brand Equity Brand Health Definition And Metrics To Track Formats PDF
Mentioned slide displays overview about brand health covering its definition along with key performance metrics such as net promoter score, customer satisfaction score and share of voice. Presenting this PowerPoint presentation, titled Comprehensive Guide To Strengthen Brand Equity Brand Health Definition And Metrics To Track Formats PDF, with topics curated by our researchers after extensive research. This editable presentation is available for immediate download and provides attractive features when used. Download now and captivate your audience. Presenting this Comprehensive Guide To Strengthen Brand Equity Brand Health Definition And Metrics To Track Formats PDF. Our researchers have carefully researched and created these slides with all aspects taken into consideration. This is a completely customizable Comprehensive Guide To Strengthen Brand Equity Brand Health Definition And Metrics To Track Formats PDF that is available for immediate downloading. Download now and make an impact on your audience. Highlight the attractive features available with our PPTs.
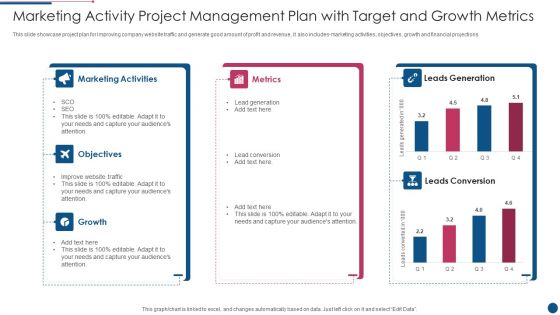
Marketing Activity Project Management Plan With Target And Growth Metrics Introduction PDF
This slide showcase project plan for improving company website traffic and generate good amount of profit and revenue, it also includes marketing activities, objectives, growth and financial projections. Pitch your topic with ease and precision using this Marketing Activity Project Management Plan With Target And Growth Metrics Introduction PDF. This layout presents information on Marketing Activities, Metrics, Growth. It is also available for immediate download and adjustment. So, changes can be made in the color, design, graphics or any other component to create a unique layout.
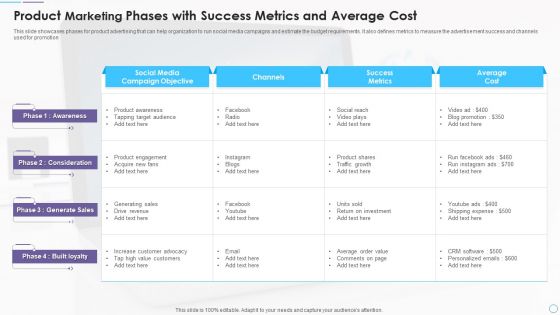
Product Marketing Phases With Success Metrics And Average Cost Structure PDF
This slide showcases phases for product advertising that can help organization to run social media campaigns and estimate the budget requirements. It also defines metrics to measure the advertisement success and channels used for promotion. Pitch your topic with ease and precision using this Product Marketing Phases With Success Metrics And Average Cost Structure PDF. This layout presents information on Awareness, Consideration, Generate Sales, Built loyalty. It is also available for immediate download and adjustment. So, changes can be made in the color, design, graphics or any other component to create a unique layout.
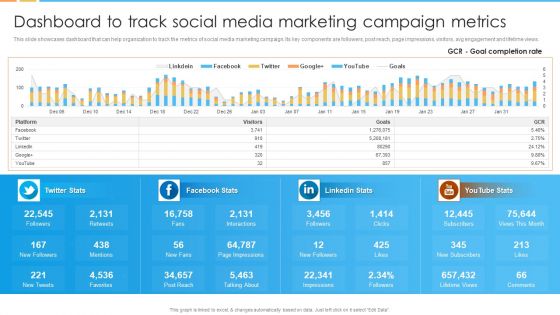
Digital Marketing Guide For B2B Firms Dashboard To Track Social Media Marketing Campaign Metrics Demonstration PDF
This slide showcases dashboard that can help organization to track the metrics of social media marketing campaign. Its key components are followers, post reach, page impressions, visitors, avg engagement and lifetime views.Deliver an awe inspiring pitch with this creative Digital Marketing Guide For B2B Firms Dashboard To Track Social Media Marketing Campaign Metrics Demonstration PDF bundle. Topics like Page Impressions, New Followers, Talking About can be discussed with this completely editable template. It is available for immediate download depending on the needs and requirements of the user.
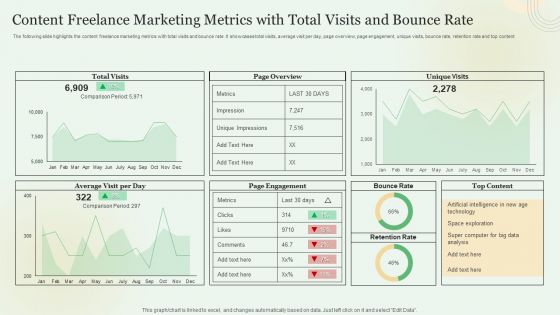
Content Freelance Marketing Metrics With Total Visits And Bounce Rate Slides PDF
The following slide highlights the content freelance marketing metrics with total visits and bounce rate. It showcases total visits, average visit per day, page overview, page engagement, unique visits, bounce rate, retention rate and top content Pitch your topic with ease and precision using this Content Freelance Marketing Metrics With Total Visits And Bounce Rate Slides PDF. This layout presents information on Average, Page Engagement, Bounce Rate. It is also available for immediate download and adjustment. So, changes can be made in the color, design, graphics or any other component to create a unique layout.
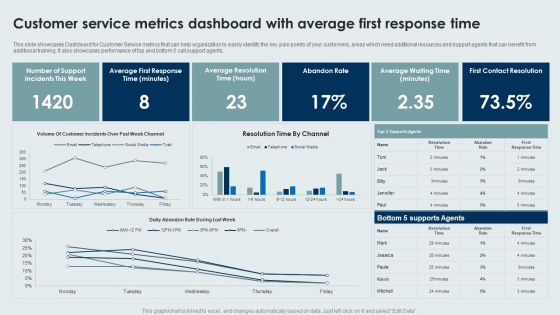
Customer Service Metrics Dashboard With Average First Response Time Background PDF
This slide showcases Dashboard for Customer Service metrics that can help organization to easily identify the key pain points of your customers, areas which need additional resources and support agents that can benefit from additional training. It also showcases performance of top and bottom 5 call support agents. Pitch your topic with ease and precision using this Customer Service Metrics Dashboard With Average First Response Time Background PDF. This layout presents information on Average, Abandon Rate, Contact Resolution. It is also available for immediate download and adjustment. So, changes can be made in the color, design, graphics or any other component to create a unique layout.
Stock Performance Dashboard For Metrics Team Management Ppt Outline Icons PDF
This slide represents the dashboard for tracking the management team member, manager, and teams ability to ensure inventory accuracy over time. It includes KPIs such as inventory, average result area scores and result areas. Pitch your topic with ease and precision using this Stock Performance Dashboard For Metrics Team Management Ppt Outline Icons PDF. This layout presents information on Result areas, Metrics Team, Needs Help. It is also available for immediate download and adjustment. So, changes can be made in the color, design, graphics or any other component to create a unique layout.
Robotic Process Automation Metrics Tracker With Work Item Statistics Information PDF
This slide covers the RPA dashboard for analysing process data status. It also includes process details such as run success rate, inputs, processing, fail, output, robotic run minutes, total value generated, work items processed. Pitch your topic with ease and precision using this Robotic Process Automation Metrics Tracker With Work Item Statistics Information PDF. This layout presents information on Robotic Process Automation, Metrics Tracker, Work Item Statistics. It is also available for immediate download and adjustment. So, changes can be made in the color, design, graphics or any other component to create a unique layout.
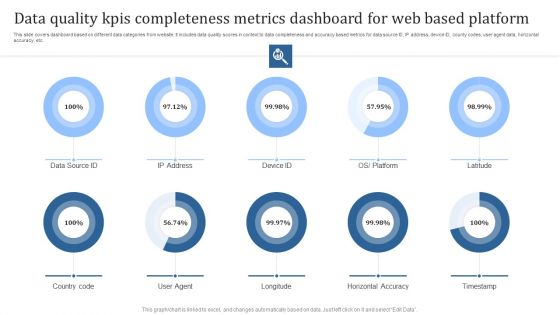
Data Quality Kpis Completeness Metrics Dashboard For Web Based Platform Graphics PDF
This slide covers dashboard based on different data categories from website. It includes data quality scores in context to data completeness and accuracy based metrics for data source ID, IP address, device ID, county codes, user agent data, horizontal accuracy, etc. Pitch your topic with ease and precision using this Data Quality Kpis Completeness Metrics Dashboard For Web Based Platform Graphics PDF. This layout presents information on Country Code, User Agent, Longitude. It is also available for immediate download and adjustment. So, changes can be made in the color, design, graphics or any other component to create a unique layout.

Project Data Quality Kpis Metrics Summary Dashboard With Threshold Guidelines PDF
This slide covers different KPIs to measure performance of data quality for project completion. It includes metric such as consistency, completeness, orderliness, timeliness, accuracy, auditability and uniqueness with thresholds. Pitch your topic with ease and precision using this Project Data Quality Kpis Metrics Summary Dashboard With Threshold Guidelines PDF. This layout presents information on Consistency, Completeness, Orderliness. It is also available for immediate download and adjustment. So, changes can be made in the color, design, graphics or any other component to create a unique layout.
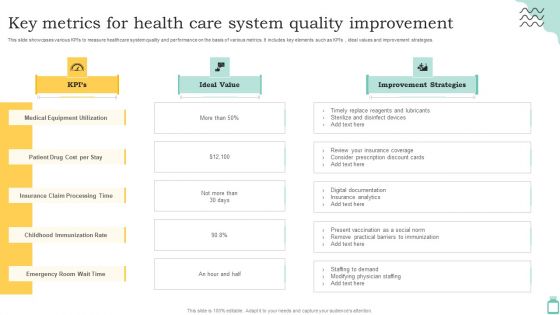
Key Metrics For Health Care System Quality Improvement Ppt PowerPoint Presentation File Template PDF
This slide showcases various KPIs to measure healthcare system quality and performance on the basis of various metrics. It includes key elements such as KPIs , ideal values and improvement strategies. Pitch your topic with ease and precision using this Key Metrics For Health Care System Quality Improvement Ppt PowerPoint Presentation File Template PDF. This layout presents information on Medical Equipment Utilization, Childhood Immunization Rate, Ideal Value, Improvement Strategies. It is also available for immediate download and adjustment. So, changes can be made in the color, design, graphics or any other component to create a unique layout.

Metrics For Software Development With Planned And Active Work Structure PDF
This slide showcases task completion and progress status for application programming project in organization to ensure timely delivery by avoiding delays. It includes details about active, planned, unplanned, moved work, backlog and tags, velocity, sprint burndown, etc. Pitch your topic with ease and precision using this Metrics For Software Development With Planned And Active Work Structure PDF. This layout presents information on Metrics For Software Development With Planned And Active Work Structure PDF. It is also available for immediate download and adjustment. So, changes can be made in the color, design, graphics or any other component to create a unique layout.

Dashboard To Evaluate Talent Management Metrics Employee Performance Management Tactics Themes PDF
This slide represents talent management dashboards. It includes average time to hire, cost per hire, training cost, talent turnover rate, talent satisfaction etc.Presenting this PowerPoint presentation, titled Dashboard To Evaluate Talent Management Metrics Employee Performance Management Tactics Themes PDF, with topics curated by our researchers after extensive research. This editable presentation is available for immediate download and provides attractive features when used. Download now and captivate your audience. Presenting this Dashboard To Evaluate Talent Management Metrics Employee Performance Management Tactics Themes PDF. Our researchers have carefully researched and created these slides with all aspects taken into consideration. This is a completely customizable Dashboard To Evaluate Talent Management Metrics Employee Performance Management Tactics Themes PDF that is available for immediate downloading. Download now and make an impact on your audience. Highlight the attractive features available with our PPTs.

Analyzing And Implementing Effective CMS Customer Acquisition And Conversion Key Metrics Dashboard Professional PDF
This slide represents the dashboard showing the key performance measures to analyze and monitor the customer acquisition and conversion rate. It includes details related to KPIs such as direct traffic, sessions by source, social networks, paid keywords etc. Presenting this PowerPoint presentation, titled Analyzing And Implementing Effective CMS Customer Acquisition And Conversion Key Metrics Dashboard Professional PDF, with topics curated by our researchers after extensive research. This editable presentation is available for immediate download and provides attractive features when used. Download now and captivate your audience. Presenting this Analyzing And Implementing Effective CMS Customer Acquisition And Conversion Key Metrics Dashboard Professional PDF. Our researchers have carefully researched and created these slides with all aspects taken into consideration. This is a completely customizable Analyzing And Implementing Effective CMS Customer Acquisition And Conversion Key Metrics Dashboard Professional PDF that is available for immediate downloading. Download now and make an impact on your audience. Highlight the attractive features available with our PPTs.
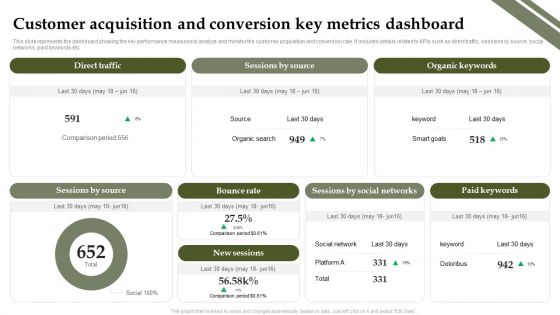
Analyzing And Deploying Effective CMS Customer Acquisition And Conversion Key Metrics Dashboard Infographics PDF
This slide represents the dashboard showing the key performance measures to analyze and monitor the customer acquisition and conversion rate. It includes details related to KPIs such as direct traffic, sessions by source, social networks, paid keywords etc. Presenting this PowerPoint presentation, titled Analyzing And Deploying Effective CMS Customer Acquisition And Conversion Key Metrics Dashboard Infographics PDF, with topics curated by our researchers after extensive research. This editable presentation is available for immediate download and provides attractive features when used. Download now and captivate your audience. Presenting this Analyzing And Deploying Effective CMS Customer Acquisition And Conversion Key Metrics Dashboard Infographics PDF. Our researchers have carefully researched and created these slides with all aspects taken into consideration. This is a completely customizable Analyzing And Deploying Effective CMS Customer Acquisition And Conversion Key Metrics Dashboard Infographics PDF that is available for immediate downloading. Download now and make an impact on your audience. Highlight the attractive features available with our PPTs.
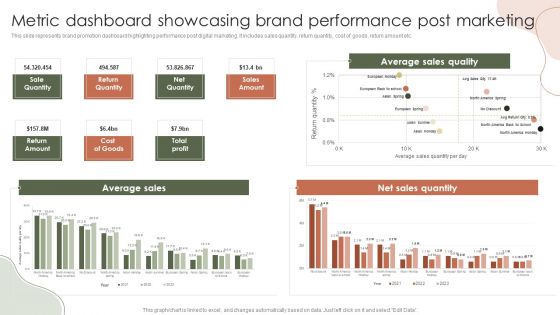
Digital Marketing Approach For Brand Awareness Metric Dashboard Showcasing Brand Performance Post Marketing Mockup PDF
Presenting this PowerPoint presentation, titled Digital Marketing Approach For Brand Awareness Metric Dashboard Showcasing Brand Performance Post Marketing Mockup This slide represents brand promotion dashboard highlighting performance post digital marketing. It includes sales quantity, return quantity, cost of goods, return amount etc. PDF, with topics curated by our researchers after extensive research. This editable presentation is available for immediate download and provides attractive features when used. Download now and captivate your audience. Presenting this Digital Marketing Approach For Brand Awareness Metric Dashboard Showcasing Brand Performance Post Marketing Mockup PDF. Our researchers have carefully researched and created these slides with all aspects taken into consideration. This is a completely customizable Digital Marketing Approach For Brand Awareness Metric Dashboard Showcasing Brand Performance Post Marketing Mockup PDF that is available for immediate downloading. Download now and make an impact on your audience. Highlight the attractive features available with our PPTs.

Implementing Management System To Enhance Ecommerce Processes Customer Acquisition And Conversion Key Metrics Pictures PDF
This slide represents the dashboard showing the key performance measures to analyze and monitor the customer acquisition and conversion rate. It includes details related to KPIs such as direct traffic, sessions by source, social networks, paid keywords etc. Presenting this PowerPoint presentation, titled Implementing Management System To Enhance Ecommerce Processes Customer Acquisition And Conversion Key Metrics Pictures PDF, with topics curated by our researchers after extensive research. This editable presentation is available for immediate download and provides attractive features when used. Download now and captivate your audience. Presenting this Implementing Management System To Enhance Ecommerce Processes Customer Acquisition And Conversion Key Metrics Pictures PDF. Our researchers have carefully researched and created these slides with all aspects taken into consideration. This is a completely customizable Implementing Management System To Enhance Ecommerce Processes Customer Acquisition And Conversion Key Metrics Pictures PDF that is available for immediate downloading. Download now and make an impact on your audience. Highlight the attractive features available with our PPTs.
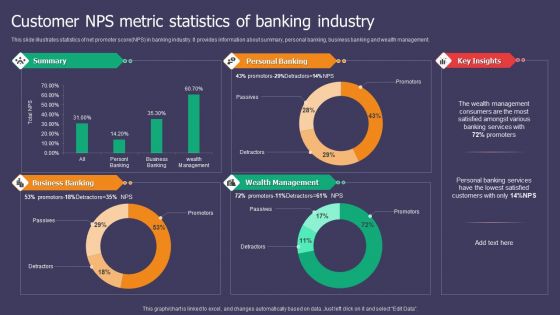
Customer NPS Metric Statistics Of Banking Industry Ppt Styles Microsoft PDF
This slide illustrates statistics of net promoter score NPS in banking industry. It provides information about summary, personal banking, business banking and wealth management. Pitch your topic with ease and precision using this Customer NPS Metric Statistics Of Banking Industry Ppt Styles Microsoft PDF. This layout presents information on Summary, Personal Banking, Business Banking, Wealth Management. It is also available for immediate download and adjustment. So, changes can be made in the color, design, graphics or any other component to create a unique layout.
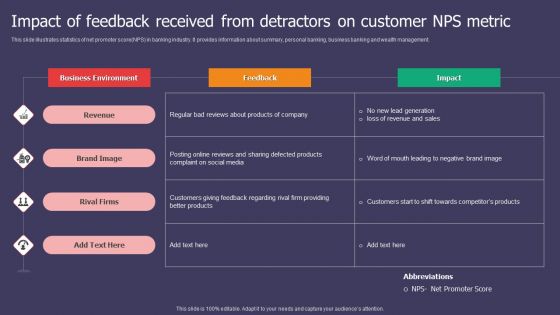
Impact Of Feedback Received From Detractors On Customer NPS Metric Ppt Inspiration Visuals PDF
This slide illustrates statistics of net promoter score NPS in banking industry. It provides information about summary, personal banking, business banking and wealth management. Pitch your topic with ease and precision using this Impact Of Feedback Received From Detractors On Customer NPS Metric Ppt Inspiration Visuals PDF. This layout presents information on Business Environment, Feedback, Revenue. It is also available for immediate download and adjustment. So, changes can be made in the color, design, graphics or any other component to create a unique layout.
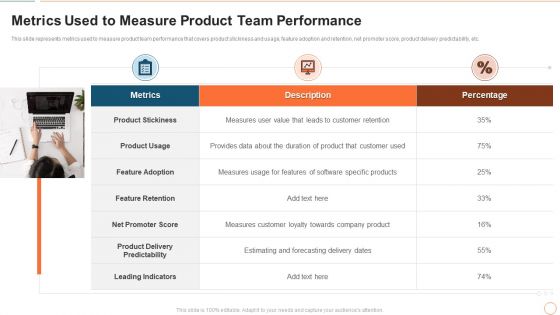
Illustrating Product Leadership Plan Incorporating Innovative Techniques Metrics Used To Measure Summary PDF
This slide represents metrics used to measure product team performance that covers product stickiness and usage, feature adoption and retention, net promoter score, product delivery predictability, etc. This is a illustrating product leadership plan incorporating innovative techniques metrics used to measure summary pdf template with various stages. Focus and dispense information on three stages using this creative set, that comes with editable features. It contains large content boxes to add your information on topics like metrics, description, percentage. You can also showcase facts, figures, and other relevant content using this PPT layout. Grab it now.
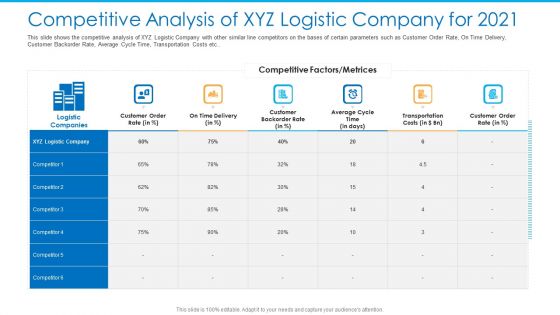
Competitive Analysis Of XYZ Logistic Company For 2021 Background PDF
This slide shows the competitive analysis of XYZ Logistic Company with other similar line competitors on the bases of certain parameters such as Customer Order Rate, On Time Delivery, Customer Backorder Rate, Average Cycle Time, Transportation Costs etc.Deliver an awe inspiring pitch with this creative competitive analysis of xyz logistic company for 2021 background pdf bundle. Topics like customer order, competitive factors or metrices, logistic companies can be discussed with this completely editable template. It is available for immediate download depending on the needs and requirements of the user.

Competitive Analysis Of GEO Energy Company For 2021 Themes PDF
This slide shows the competitive analysis of GEO Energy Company with other similar line competitors on the bases of certain parameters such as Revenue , Return on Investment, Performance Ratio , Wind Energy Level , Plant Availability, Market Share etc. Deliver an awe inspiring pitch with this creative competitive analysis of geo energy company for 2021 themes pdf bundle. Topics like renewable energy companies, performance ratio, competitive factors or metrices can be discussed with this completely editable template. It is available for immediate download depending on the needs and requirements of the user.

Strategic Plan For Organization Diversity And Inclusion With Metric Diagrams PDF
This slide showcases strategic action plan for organization to develop a diversity and inclusion program which helps in business sustainability. It provides information regarding engaging stakeholders and developing Pitch your topic with ease and precision using this Strategic Plan For Organization Diversity And Inclusion With Metric Diagrams PDF. This layout presents information on Objectives, Actionable Points, Strategies. It is also available for immediate download and adjustment. So, changes can be made in the color, design, graphics or any other component to create a unique layout.
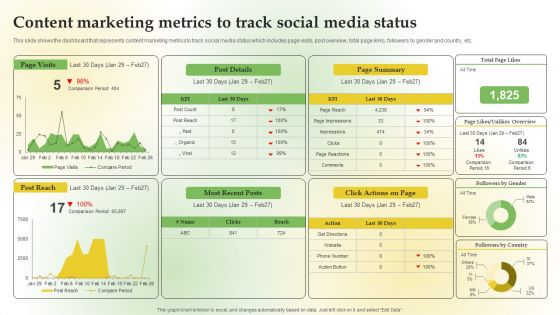
Content Marketing Metrics Track Social Media Status Content Marketing Applications For Nurturing Leads Inspiration PDF
Are you searching for a Content Marketing Metrics Track Social Media Status Content Marketing Applications For Nurturing Leads Inspiration PDF that is uncluttered, straightforward, and original Its easy to edit, and you can change the colors to suit your personal or business branding. For a presentation that expresses how much effort you have put in, this template is ideal. With all of its features, including tables, diagrams, statistics, and lists, its perfect for a business plan presentation. Make your ideas more appealing with these professional slides. Download Content Marketing Metrics Track Social Media Status Content Marketing Applications For Nurturing Leads Inspiration PDF from Slidegeeks today.

Company Product Quarterly Sales Performance Analysis Introduction PDF
This slide depicts quarterly product sales performance which helps managers to encourage productivity and increases representatives accountability. It includes performance metrics such as average profit margin, booking, conversion rate, average sales price, win rate, total ACV and average ACV.Showcasing this set of slides titled Company Product Quarterly Sales Performance Analysis Introduction PDF. The topics addressed in these templates are Average Profit Margin, Conversion Rate. All the content presented in this PPT design is completely editable. Download it and make adjustments in color, background, font etc. as per your unique business setting.
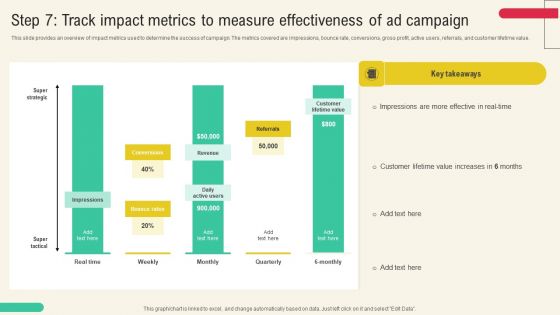
Step 7 Track Impact Metrics To Measure Effectiveness Of Ad Campaign Inspiration PDF
This slide provides an overview of impact metrics used to determine the success of campaign. The metrics covered are impressions, bounce rate, conversions, gross profit, active users, referrals, and customer lifetime value. Are you searching for a Step 7 Track Impact Metrics To Measure Effectiveness Of Ad Campaign Inspiration PDF that is uncluttered, straightforward, and original Its easy to edit, and you can change the colors to suit your personal or business branding. For a presentation that expresses how much effort you have put in, this template is ideal With all of its features, including tables, diagrams, statistics, and lists, its perfect for a business plan presentation. Make your ideas more appealing with these professional slides. Download Step 7 Track Impact Metrics To Measure Effectiveness Of Ad Campaign Inspiration PDF from Slidegeeks today.
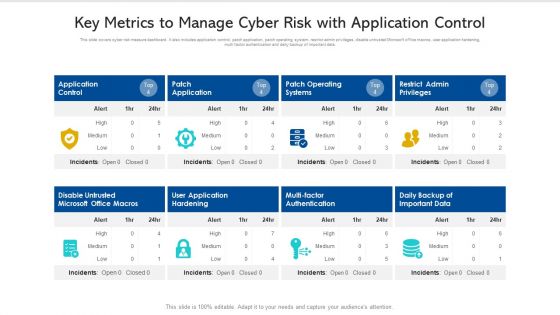
Key Metrics To Manage Cyber Risk With Application Control Ppt PowerPoint Presentation Pictures Slide PDF
This slide covers cyber risk measure dashboard. It also includes application control, patch application, patch operating system, restrict admin privileges, disable untrusted Microsoft office macros, user application hardening, multi factor authentication and daily backup of important data. Pitch your topic with ease and precision using this key metrics to manage cyber risk with application control ppt powerpoint presentation pictures slide pdf. This layout presents information on disable untrusted microsoft office macros, application control, patch operating systems. It is also available for immediate download and adjustment. So, changes can be made in the color, design, graphics or any other component to create a unique layout.

CRM Performance Metrics Dashboard Showing Sales In Real Estate Customer Information PDF
This slide represents the dashboard showing the sales performance of a real estate company. It includes details related top 5 agents US sales, sales vs target per agent, top 5 banks-sold units, sales by top 5 agencies. Pitch your topic with ease and precision using this CRM Performance Metrics Dashboard Showing Sales In Real Estate Customer Information PDF. This layout presents information on Us Sales, Sold Units, Target Per Agent. It is also available for immediate download and adjustment. So, changes can be made in the color, design, graphics or any other component to create a unique layout.
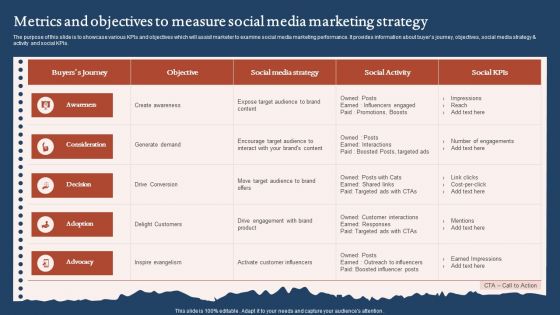
Metrics And Objectives To Measure Social Media Marketing Strategy Structure PDF
The purpose of this slide is to showcase various KPIs and objectives which will assist marketer to examine social media marketing performance. It provides information about buyers journey, objectives, social media strategy and activity and social KPIs. Pitch your topic with ease and precision using this Metrics And Objectives To Measure Social Media Marketing Strategy Structure PDF. This layout presents information on Awareness, Consideration, Advocacy. It is also available for immediate download and adjustment. So, changes can be made in the color, design, graphics or any other component to create a unique layout.
Objectives And Metrics To Measure Email Marketing Campaign Performance Icons PDF
The purpose of this slide is to showcase various objectives and KPIs of email marketing campaign. Marketers can track the success of campaign performance through click through rate CTR, unsubscribe rate, bounce rate and spam complaints rate. Pitch your topic with ease and precision using this Objectives And Metrics To Measure Email Marketing Campaign Performance Icons PDF. This layout presents information on Unsubscribe Rate, Bounce Rate, Spam Complaints Rate. It is also available for immediate download and adjustment. So, changes can be made in the color, design, graphics or any other component to create a unique layout.

Cash Flow Metrics To Measure Firm Operations Effectiveness Ppt Outline Infographic Template PDF
This slide showcases yearly cash conversion cycle to determine companys working capital management. It includes DSO, DIO, DPO and CCC that measure the average number of days organization takes to collect payment and pay bills. Pitch your topic with ease and precision using this Cash Flow Metrics To Measure Firm Operations Effectiveness Ppt Outline Infographic Template PDF. This layout presents information on Cash Conversion Cycle, 2019 To 2022, Cash Flow. It is also available for immediate download and adjustment. So, changes can be made in the color, design, graphics or any other component to create a unique layout.
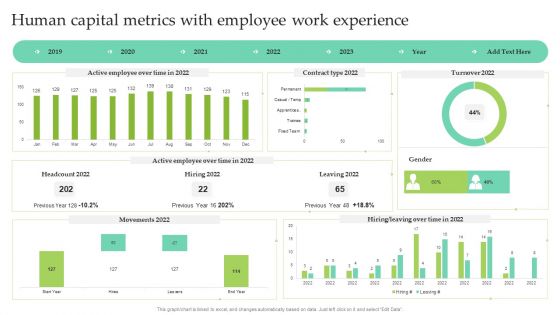
Human Capital Metrics With Employee Work Experience Ppt Show Images PDF
This graph or chart is linked to excel, and changes automatically based on data. Just left click on it and select Edit Data. Pitch your topic with ease and precision using this Human Capital Metrics With Employee Work Experience Ppt Show Images PDF. This layout presents information on Active Employee, Over Time, Contract Type 2022, Leaving 2022. It is also available for immediate download and adjustment. So, changes can be made in the color, design, graphics or any other component to create a unique layout.

Customer NPS Metric Dashboard For Call Centers Ppt Inspiration Smartart PDF
This slide shows net promoter score dashboard for call centers which contains occupancy rate, tickets unassigned, opened tickets, completed tickets and raised tickets. It also has details on resolution rate on first call, enquiries, etc. Pitch your topic with ease and precision using this Customer NPS Metric Dashboard For Call Centers Ppt Inspiration Smartart PDF. This layout presents information on Occupancy Rate, Resolution Rate, Net Promoter Score. It is also available for immediate download and adjustment. So, changes can be made in the color, design, graphics or any other component to create a unique layout.

Ecommerce Customer Survey With Customer NPS Metric Rating Scale Ppt Inspiration Visual Aids PDF
This slide shows net promoter score rating scale with ecommerce customer survey. It includes information about price fairness, customer support experience, order checkout, product quality, passives, promoters, detractors, etc. Pitch your topic with ease and precision using this Ecommerce Customer Survey With Customer NPS Metric Rating Scale Ppt Inspiration Visual Aids PDF. This layout presents information on Net Promoter Score, Price Fairness, Product Purchased. It is also available for immediate download and adjustment. So, changes can be made in the color, design, graphics or any other component to create a unique layout.
Brand Health Definition And Metrics To Track Brand Value Estimation Guide Mockup PDF
Following slide provides an overview about brand equity by covering its definition and key components such as brand loyalty, awareness, quality, association and experience.Present like a pro with Brand Health Definition And Metrics To Track Brand Value Estimation Guide Mockup PDF Create beautiful presentations together with your team, using our easy-to-use presentation slides. Share your ideas in real-time and make changes on the fly by downloading our templates. So whether you are in the office, on the go, or in a remote location, you can stay in sync with your team and present your ideas with confidence. With Slidegeeks presentation got a whole lot easier. Grab these presentations today.

Monthly Financial Metrics Graph With Operating Profit And Cost Of Goods Sold Pictures PDF
This slide showcases monthly analytics for to keep company finances organized and identify problem areas. It further includes details about marketing, professional fees, COGS and other operations. Pitch your topic with ease and precision using this Monthly Financial Metrics Graph With Operating Profit And Cost Of Goods Sold Pictures PDF. This layout presents information on Key Insights, Operating Profit, Total Revenue. It is also available for immediate download and adjustment. So, changes can be made in the color, design, graphics or any other component to create a unique layout.

Digital Marketing Strategy Dashboard To Track Social Media Marketing Campaign Metrics Diagrams PDF
This slide showcases dashboard that can help organization to track the metrics of social media marketing campaign. Its key components are followers, post reach, page impressions, visitors, avg engagement and lifetime views. Retrieve professionally designed Digital Marketing Strategy Dashboard To Track Social Media Marketing Campaign Metrics Diagrams PDF to effectively convey your message and captivate your listeners. Save time by selecting pre-made slideshows that are appropriate for various topics, from business to educational purposes. These themes come in many different styles, from creative to corporate, and all of them are easily adjustable and can be edited quickly. Access them as PowerPoint templates or as Google Slides themes. You dont have to go on a hunt for the perfect presentation because Slidegeeks got you covered from everywhere.
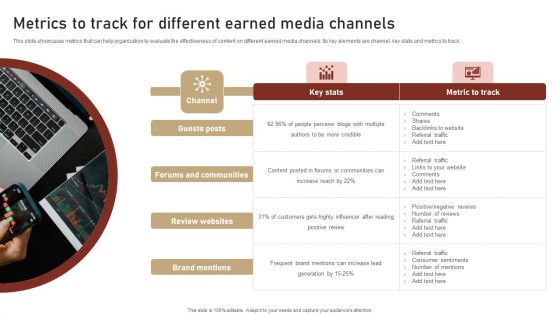
Content Delivery And Promotion Metrics To Track For Different Earned Media Topics PDF
This slide showcases metrics that can help organization to evaluate the effectiveness of content on different earned media channels. Its key elements are channel, key stats and metrics to track. Presenting this PowerPoint presentation, titled Content Delivery And Promotion Metrics To Track For Different Earned Media Topics PDF, with topics curated by our researchers after extensive research. This editable presentation is available for immediate download and provides attractive features when used. Download now and captivate your audience. Presenting this Content Delivery And Promotion Metrics To Track For Different Earned Media Topics PDF. Our researchers have carefully researched and created these slides with all aspects taken into consideration. This is a completely customizable Content Delivery And Promotion Metrics To Track For Different Earned Media Topics PDF that is available for immediate downloading. Download now and make an impact on your audience. Highlight the attractive features available with our PPTs.

Agile Group For Product Development Metrics Used By Product Leader To Measure Performance Designs PDF
This slide focuses on metrics used by product leader to measure performance such as net promoter score, feature adoption, retention rate, churn rate, customer satisfaction, stickiness, etc. Deliver an awe inspiring pitch with this creative agile group for product development metrics used by product leader to measure performance designs pdf bundle. Topics like quantifies customer happiness with product, customers that leave over certain period, customer satisfaction can be discussed with this completely editable template. It is available for immediate download depending on the needs and requirements of the user.

Agile Group For Product Development Metrics Used To Measure Product Team Performance Download PDF
This slide represents metrics used to measure product team performance that covers product stickiness and usage, feature adoption and retention, net promoter score, product delivery predictability, etc. Deliver and pitch your topic in the best possible manner with this agile group for product development metrics used to measure product team performance download pdf. Use them to share invaluable insights on leading indicators, product delivery predictability, product stickiness and impress your audience. This template can be altered and modified as per your expectations. So, grab it now.
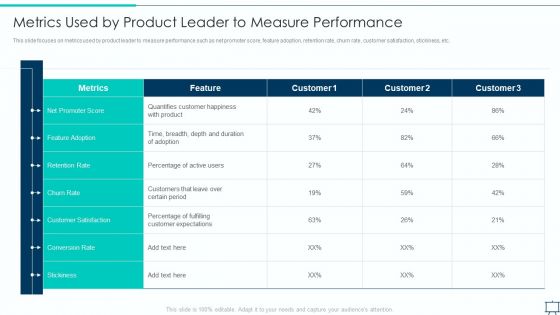
Formulating Competitive Plan Of Action For Effective Product Leadership Metrics Used By Product Leader Microsoft PDF
This slide focuses on metrics used by product leader to measure performance such as net promoter score, feature adoption, retention rate, churn rate, customer satisfaction, stickiness, etc. Deliver and pitch your topic in the best possible manner with this formulating competitive plan of action for effective product leadership metrics used by product leader microsoft pdf. Use them to share invaluable insights on conversion rate, customer satisfaction, duration of adoption and impress your audience. This template can be altered and modified as per your expectations. So, grab it now.
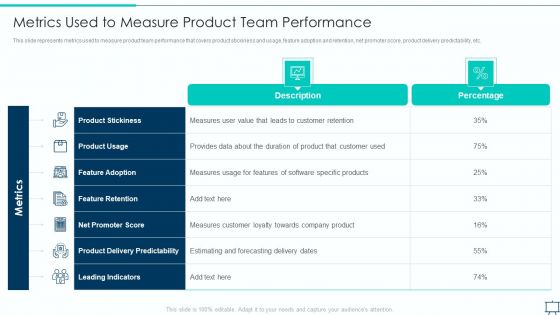
Formulating Competitive Plan Of Action For Effective Product Leadership Metrics Used To Measure Product Formats PDF
This slide represents metrics used to measure product team performance that covers product stickiness and usage, feature adoption and retention, net promoter score, product delivery predictability, etc. Deliver an awe inspiring pitch with this creative formulating competitive plan of action for effective product leadership metrics used to measure product formats pdf bundle. Topics like customer loyalty, software specific products, customer retention can be discussed with this completely editable template. It is available for immediate download depending on the needs and requirements of the user.

 Home
Home