It Operations Dashboard
Benchmarking Supplier Operation Control Procedure Inventory Turnover Tracking Dashboard Summary PDF
This slide displays inventory turnover tracking dashboard. It includes information about achievable and target inventory, it also shows various reasons for product or package return. Deliver an awe-inspiring pitch with this creative benchmarking supplier operation control procedure inventory turnover tracking dashboard summary pdf bundle. Topics like information, dashboard, target inventory can be discussed with this completely editable template. It is available for immediate download depending on the needs and requirements of the user.

Dashboard Of Shipment Logistics KPI With Operating Cost Ppt Styles Example Topics PDF
The following slide highlights dashboard of shipment transportation with operating cost illustrating transportation operating cost, monthly order completion rate, operating cost distribution, order completion trend, transportation by destination and transportation efficiency. Showcasing this set of slides titled Dashboard Of Shipment Logistics KPI With Operating Cost Ppt Styles Example Topics PDF. The topics addressed in these templates are Transportation Operating Cost, Monthly Order, Completion Rate, Operating Cost Distribution. All the content presented in this PPT design is completely editable. Download it and make adjustments in color, background, font etc. as per your unique business setting.
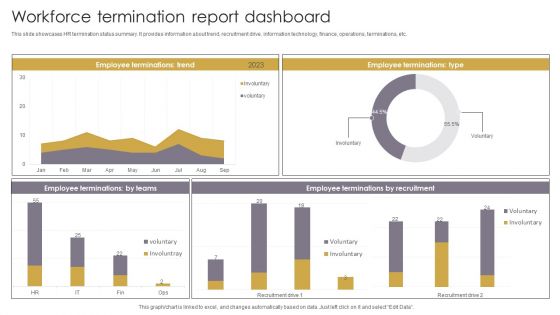
Workforce Termination Report Dashboard Professional PDF
This slide showcases HR termination status summary. It provides information about trend, recruitment drive, information technology, finance, operations, terminations, etc. Showcasing this set of slides titled Workforce Termination Report Dashboard Professional PDF. The topics addressed in these templates are Workforce Termination, Report Dashboard. All the content presented in this PPT design is completely editable. Download it and make adjustments in color, background, font etc. as per your unique business setting.
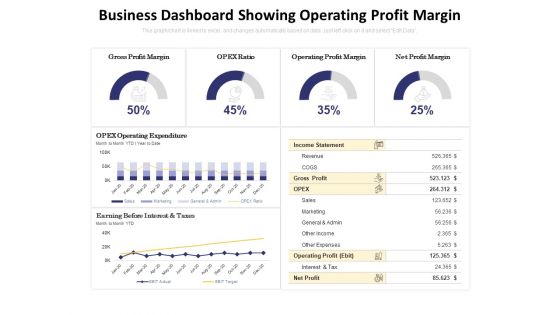
Business Dashboard Showing Operating Profit Margin Ppt PowerPoint Presentation Show Portrait PDF
Presenting this set of slides with name business dashboard showing operating profit margin ppt powerpoint presentation show portrait pdf. The topics discussed in these slides are gross profit margin, opex ratio, operating profit margin, net profit margin, opex operating expenditure. This is a completely editable PowerPoint presentation and is available for immediate download. Download now and impress your audience.
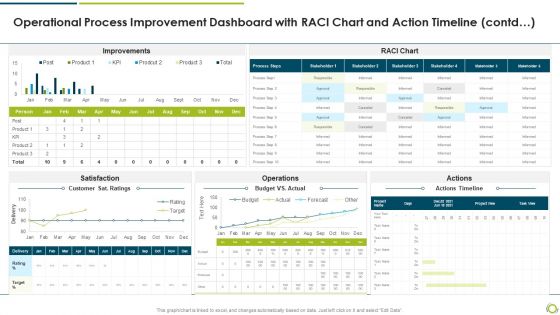
Operational Process Improvement Dashboard With RACI Chart And Action Timeline Contd Mockup PDF
Deliver and pitch your topic in the best possible manner with this operational process improvement dashboard with raci chart and action timeline contd mockup pdf. Use them to share invaluable insights on Satisfaction, operations, actions and impress your audience. This template can be altered and modified as per your expectations. So, grab it now.

Profit And Loss Dashboard Indicating Business Operational Expenditure And EBIT Formats PDF
This slide shows profit and loss dashboard indicating opex operating expenses and ebit earning before interest and taxes which can be referred by companies in management of cash inflows and outflows of operations. It contains gross profit margin, net profit margin, ratio, income statement, etc. Showcasing this set of slides titled Profit And Loss Dashboard Indicating Business Operational Expenditure And EBIT Formats PDF. The topics addressed in these templates are Revenue, Gross Profit, Sales. All the content presented in this PPT design is completely editable. Download it and make adjustments in color, background, font etc. as per your unique business setting.
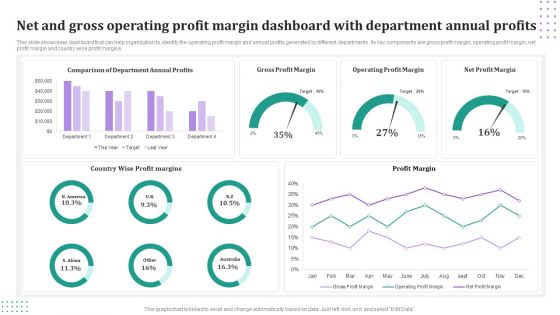
Net And Gross Operating Profit Margin Dashboard With Department Annual Profits Mockup PDF
This slide showcases dashboard that can help organization to identify the operating profit margin and annual profits generated by different departments. Its key components are gross profit margin, operating profit margin, net profit margin and country wise profit margins. Pitch your topic with ease and precision using this Net And Gross Operating Profit Margin Dashboard With Department Annual Profits Mockup PDF. This layout presents information on Gross Profit Margin, Operating Profit Margin, Net Profit Margin. It is also available for immediate download and adjustment. So, changes can be made in the color, design, graphics or any other component to create a unique layout.

Business Operational Expenditure Dashboard Indicating Revenue And Costs Metrics Pictures PDF
This slide shows operating expenses OPEX dashboard indicating revenue and costs metrics which can be referred by companies to manage various operating expenses of various departments. It contains information about cost center, revenue per company, company code, etc. Pitch your topic with ease and precision using this Business Operational Expenditure Dashboard Indicating Revenue And Costs Metrics Pictures PDF. This layout presents information on Business Operational, Costs Metrics, Revenue. It is also available for immediate download and adjustment. So, changes can be made in the color, design, graphics or any other component to create a unique layout.
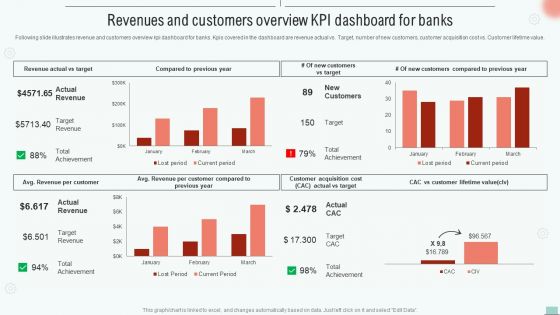
Implementing BPM Tool To Enhance Operational Efficiency Revenues And Customers Overview Kpi Dashboard Rules PDF
Following slide illustrates revenue and customers overview kpi dashboard for banks. Kpis covered in the dashboard are revenue actual vs. Target, number of new customers, customer acquisition cost vs. Customer lifetime value.This Implementing BPM Tool To Enhance Operational Efficiency Revenues And Customers Overview Kpi Dashboard Rules PDF is perfect for any presentation, be it in front of clients or colleagues. It is a versatile and stylish solution for organizing your meetings. The Implementing BPM Tool To Enhance Operational Efficiency Revenues And Customers Overview Kpi Dashboard Rules PDF features a modern design for your presentation meetings. The adjustable and customizable slides provide unlimited possibilities for acing up your presentation. Slidegeeks has done all the homework before launching the product for you. So, do not wait, grab the presentation templates today.
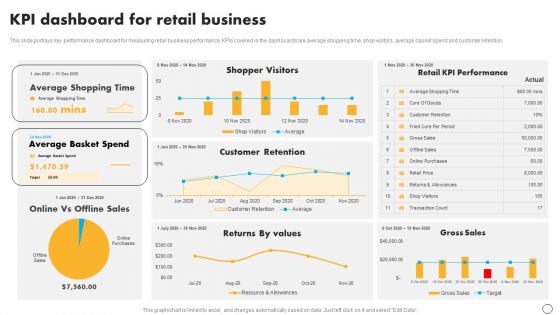
Retail Business Optimization Through Operational Excellence Strategy KPI Dashboard For Retail Business Mockup PDF
This slide portrays key performance dashboard for measuring retail business performance. KPIs covered in the dashboards are average shopping time, shop visitors, average basket spend and customer retention. Boost your pitch with our creative Retail Business Optimization Through Operational Excellence Strategy KPI Dashboard For Retail Business Mockup PDF. Deliver an awe-inspiring pitch that will mesmerize everyone. Using these presentation templates you will surely catch everyones attention. You can browse the ppts collection on our website. We have researchers who are experts at creating the right content for the templates. So you do not have to invest time in any additional work. Just grab the template now and use them.

Retail Outlet Operational Efficiency Analytics Dashboard For Retail Store Inventory Summary PDF
This slide depicts the retail store inventory dashboard providing information regarding expired items, low stock items, returned goods. It also covers details of stock demand planning. Deliver and pitch your topic in the best possible manner with this Retail Outlet Operational Efficiency Analytics Dashboard For Retail Store Inventory Summary PDF. Use them to share invaluable insights on Inventory Snapshot, Stock Demand Planning, Expired Items and impress your audience. This template can be altered and modified as per your expectations. So, grab it now.
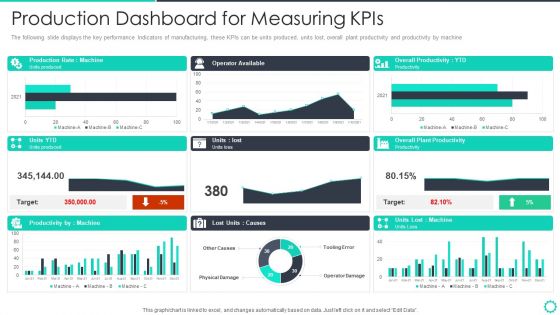
Manufacturing Operation Quality Improvement Practices Tools Templates Production Dashboard For Mockup PDF
The following slide displays the key performance Indicators of manufacturing, these KPIs can be units produced, units lost, overall plant productivity and productivity by machine. Deliver an awe inspiring pitch with this creative manufacturing operation quality improvement practices tools templates production dashboard for mockup pdf bundle. Topics like production dashboard for measuring kpis can be discussed with this completely editable template. It is available for immediate download depending on the needs and requirements of the user.
Benchmarking Vendor Operation Control Procedure Inventory Turnover Tracking Dashboard Pictures PDF
This slide displays inventory turnover tracking dashboard. It includes information about achievable and target inventory, it also shows various reasons for product or package return. Deliver and pitch your topic in the best possible manner with this benchmarking vendor operation control procedure inventory turnover tracking dashboard pictures pdf. Use them to share invaluable insights on reasons for return, inventory turnover and impress your audience. This template can be altered and modified as per your expectations. So, grab it now.
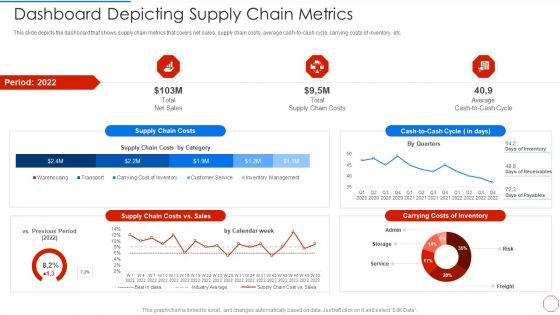
Minimizing Operational Cost Through Iot Virtual Twins Implementation Dashboard Depicting Supply Download PDF
This slide depicts the dashboard that shows supply chain metrics that covers net sales, supply chain costs, average cash to cash cycle, carrying costs of inventory, etc. Deliver an awe inspiring pitch with this creative minimizing operational cost through iot virtual twins implementation dashboard depicting supply download pdf bundle. Topics like sales, costs, supply, average can be discussed with this completely editable template. It is available for immediate download depending on the needs and requirements of the user.
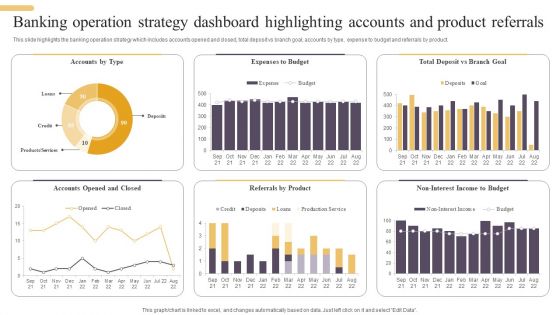
Banking Operation Strategy Dashboard Highlighting Accounts And Product Referrals Elements PDF
This slide highlights the banking operation strategy which includes accounts opened and closed, total deposit vs branch goal, accounts by type, expense to budget and referrals by product. Presenting this PowerPoint presentation, titled Banking Operation Strategy Dashboard Highlighting Accounts And Product Referrals Elements PDF, with topics curated by our researchers after extensive research. This editable presentation is available for immediate download and provides attractive features when used. Download now and captivate your audience. Presenting this Banking Operation Strategy Dashboard Highlighting Accounts And Product Referrals Elements PDF. Our researchers have carefully researched and created these slides with all aspects taken into consideration. This is a completely customizable Banking Operation Strategy Dashboard Highlighting Accounts And Product Referrals Elements PDF that is available for immediate downloading. Download now and make an impact on your audience. Highlight the attractive features available with our PPTs.
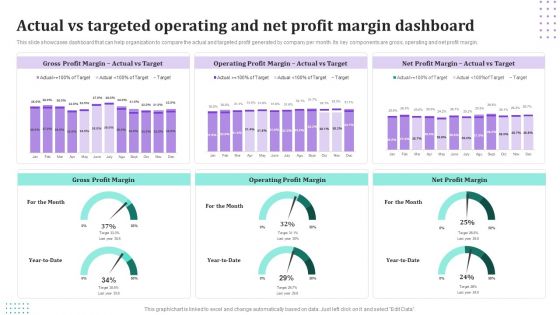
Actual Vs Targeted Operating And Net Profit Margin Dashboard Information PDF
This slide showcases dashboard that can help organization to compare the actual and targeted profit generated by company per month. Its key components are gross, operating and net profit margin. Showcasing this set of slides titled Actual Vs Targeted Operating And Net Profit Margin Dashboard Information PDF. The topics addressed in these templates are Gross Profit Margin, Operating Profit Margin, Net Profit Margin. All the content presented in this PPT design is completely editable. Download it and make adjustments in color, background, font etc. as per your unique business setting.
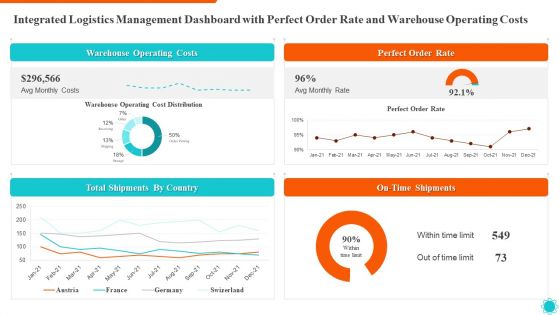
Integrated Logistics Management Dashboard With Perfect Order Rate And Warehouse Operating Costs Template PDF
Deliver an awe inspiring pitch with this creative integrated logistics management dashboard with perfect order rate and warehouse operating costs template pdf bundle. Topics like warehouse operating costs, total shipments by country, on time shipments, perfect order rate can be discussed with this completely editable template. It is available for immediate download depending on the needs and requirements of the user.
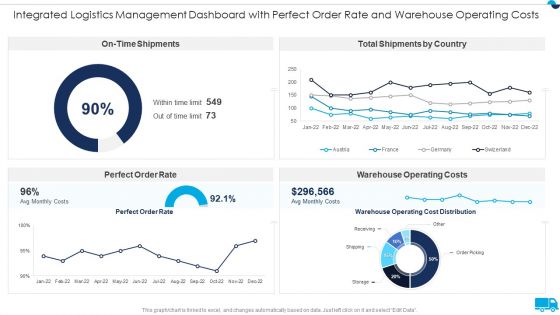
Integrated Logistics Management Dashboard With Perfect Order Rate And Warehouse Operating Costs Background PDF
Deliver an awe inspiring pitch with this creative Integrated Logistics Management Dashboard With Perfect Order Rate And Warehouse Operating Costs Background PDF bundle. Topics like Total Shipments, Operating Costs, Perfect Order can be discussed with this completely editable template. It is available for immediate download depending on the needs and requirements of the user.

Dashboard Survey Response Results KPI Report For Mobile Operating System Designs PDF
Showcasing this set of slides titled Dashboard Survey Response Results KPI Report For Mobile Operating System Designs PDF. The topics addressed in these templates are Operating System, Survey Results, Completed Survey. All the content presented in this PPT design is completely editable. Download it and make adjustments in color, background, font etc. as per your unique business setting.
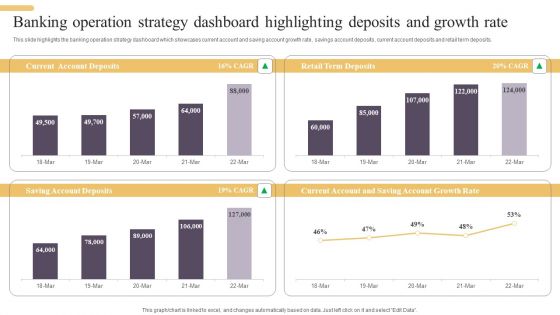
Banking Operation Strategy Dashboard Highlighting Deposits And Growth Rate Structure PDF
This slide highlights the banking operation strategy dashboard which showcases current account and saving account growth rate, savings account deposits, current account deposits and retail term deposits. Here you can discover an assortment of the finest PowerPoint and Google Slides templates. With these templates, you can create presentations for a variety of purposes while simultaneously providing your audience with an eye catching visual experience. Download Banking Operation Strategy Dashboard Highlighting Deposits And Growth Rate Structure PDF to deliver an impeccable presentation. These templates will make your job of preparing presentations much quicker, yet still, maintain a high level of quality. Slidegeeks has experienced researchers who prepare these templates and write high quality content for you. Later on, you can personalize the content by editing the Banking Operation Strategy Dashboard Highlighting Deposits And Growth Rate Structure PDF.
Banking Operation Strategy Dashboard Highlighting Deposits And Growth Rate Icons PDF
This slide highlights the banking operation strategy dashboard which showcases current account and saving account growth rate, savings account deposits, current account deposits and retail term deposits. Deliver and pitch your topic in the best possible manner with this Banking Operation Strategy Dashboard Highlighting Deposits And Growth Rate Icons PDF. Use them to share invaluable insights on Current Account Deposits, Retail Term Deposits, Growth Rate and impress your audience. This template can be altered and modified as per your expectations. So, grab it now.

Banking Operation Strategy Dashboard Highlighting Deposits And Growth Rate Themes PDF
This slide highlights the banking operation strategy dashboard which showcases current account and saving account growth rate, savings account deposits, current account deposits and retail term deposits. Deliver and pitch your topic in the best possible manner with this Banking Operation Strategy Dashboard Highlighting Deposits And Growth Rate Themes PDF. Use them to share invaluable insights on Current Account Deposits, Growth Rate, Retail Term Deposits and impress your audience. This template can be altered and modified as per your expectations. So, grab it now.
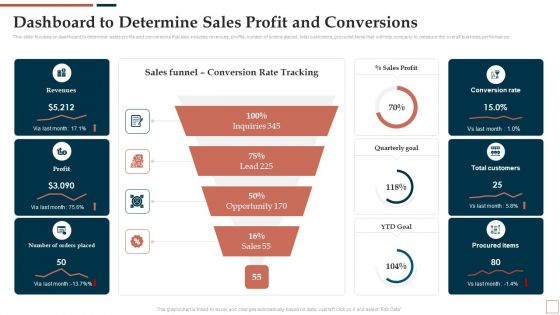
BPR To Develop Operational Effectiveness Dashboard To Determine Sales Profit And Conversions Slides PDF
This slide focuses on dashboard to determine sales profits and conversions that also includes revenues, profits, number of orders placed, total customers, procured items that will help company to measure the overall business performance. Formulating a presentation can take up a lot of effort and time, so the content and message should always be the primary focus. The visuals of the PowerPoint can enhance the presenters message, so our BPR To Develop Operational Effectiveness Dashboard To Determine Sales Profit And Conversions Slides PDF was created to help save time. Instead of worrying about the design, the presenter can concentrate on the message while our designers work on creating the ideal templates for whatever situation is needed. Slidegeeks has experts for everything from amazing designs to valuable content, we have put everything into BPR To Develop Operational Effectiveness Dashboard To Determine Sales Profit And Conversions Slides PDF.

Venture Capitalist Control Board Key Performance Indicators Dashboard For Operational Performance Analysis Formats PDF
Presenting this set of slides with name venture capitalist control board key performance indicators dashboard for operational performance analysis formats pdf. The topics discussed in these slides are revenue and volume, research production, new client onboarding, trade support staff productivity, trade error frequency. This is a completely editable PowerPoint presentation and is available for immediate download. Download now and impress your audience.
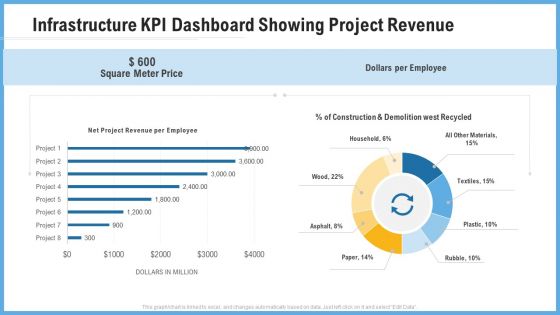
Improving Operational Activities Enterprise Infrastructure Kpi Dashboard Showing Project Revenue Professional PDF
Deliver an awe inspiring pitch with this creative improving operational activities enterprise infrastructure kpi dashboard showing project revenue professional pdf bundle. Topics like square meter price, dollars per employee can be discussed with this completely editable template. It is available for immediate download depending on the needs and requirements of the user.
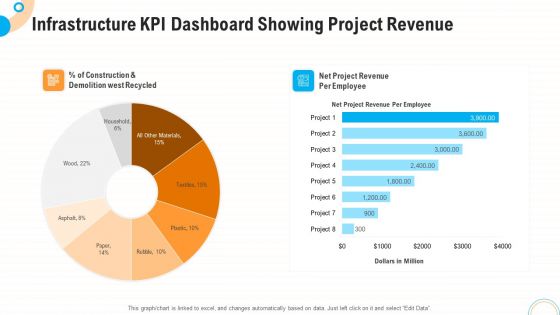
Fiscal And Operational Assessment Infrastructure KPI Dashboard Showing Project Revenue Designs PDF
Deliver an awe inspiring pitch with this creative fiscal and operational assessment infrastructure kpi dashboard showing project revenue designs pdf bundle. Topics like demolition west recycled, net project revenue per employee can be discussed with this completely editable template. It is available for immediate download depending on the needs and requirements of the user.

Improving Operational Activities Enterprise Infrastructure Kpi Dashboard Showing Resource Allocation Ideas PDF
Deliver and pitch your topic in the best possible manner with this improving operational activities enterprise infrastructure kpi dashboard showing resource allocation ideas pdf. Use them to share invaluable insights on days per project, project financial, resource allocation and impress your audience. This template can be altered and modified as per your expectations. So, grab it now.

Fiscal And Operational Assessment Infrastructure KPI Dashboard Showing Resource Allocation Mockup PDF
Deliver an awe inspiring pitch with this creative fiscal and operational assessment infrastructure kpi dashboard showing resource allocation mockup pdf bundle. Topics like resource allocation, project financial, days per project can be discussed with this completely editable template. It is available for immediate download depending on the needs and requirements of the user.

Operational Process Improvement Dashboard With RACI Chart And Action Timeline Metric Designs PDF
Deliver an awe inspiring pitch with this creative operational process improvement dashboard with raci chart and action timeline metric designs pdf bundle. Topics like metric, target, quality, customer can be discussed with this completely editable template. It is available for immediate download depending on the needs and requirements of the user.
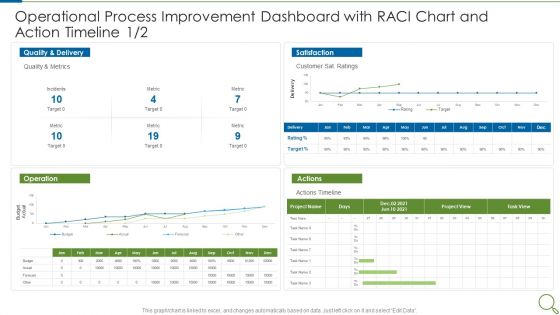
Operational Process Improvement Dashboard With RACI Chart And Action Timeline Target Summary PDF
Deliver and pitch your topic in the best possible manner with this operational process improvement dashboard with raci chart and action timeline target summary pdf. Use them to share invaluable insights on quality, metrics, customer and impress your audience. This template can be altered and modified as per your expectations. So, grab it now.

Operational Process Improvement Dashboard With RACI Chart And Action Timeline Matrix Guidelines PDF
Deliver and pitch your topic in the best possible manner with this operational process improvement dashboard with raci chart and action timeline matrix guidelines pdf. Use them to share invaluable insights on delivery metrics, target, customer and impress your audience. This template can be altered and modified as per your expectations. So, grab it now.

Integrated Logistics Management Dashboard With Perfect Order Rate And Warehouse Operating Costs Information PDF
Deliver and pitch your topic in the best possible manner with this integrated logistics management dashboard with perfect order rate and warehouse operating costs information pdf. Use them to share invaluable insights on perfect order rate, warehouse, costs and impress your audience. This template can be altered and modified as per your expectations. So, grab it now.
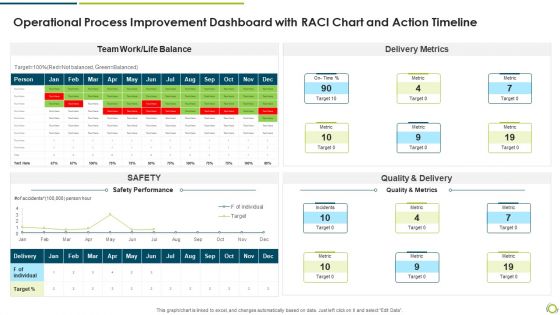
Operational Process Improvement Dashboard With RACI Chart And Action Timeline Themes PDF
Deliver an awe inspiring pitch with this creative operational process improvement dashboard with raci chart and action timeline themes pdf bundle. Topics like quality and delivery, delivery metrics, safety performance can be discussed with this completely editable template. It is available for immediate download depending on the needs and requirements of the user.
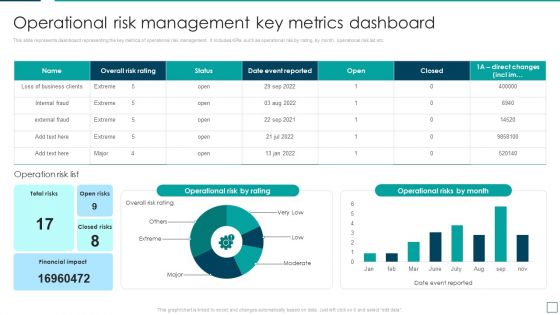
Strategic Risk Management And Mitigation Plan Operational Risk Management Key Metrics Dashboard Sample PDF
This slide represents dashboard representing the key metrics of operational risk management. It includes KPIs such as operational risk by rating, by month, operational risk list etc. Present like a pro with Strategic Risk Management And Mitigation Plan Operational Risk Management Key Metrics Dashboard Sample PDF Create beautiful presentations together with your team, using our easy to use presentation slides. Share your ideas in real time and make changes on the fly by downloading our templates. So whether you are in the office, on the go, or in a remote location, you can stay in sync with your team and present your ideas with confidence. With Slidegeeks presentation got a whole lot easier. Grab these presentations today.

Lean Operational Excellence Strategy Manufacturing Dashboard To Check Production System Efficiency Pictures PDF
This slide showcases manufacturing dashboard to track KPIs defined under lean and kaizen process improvement plans. Key performance metrics included here are TEEP, OEE, loading time, production quality, losses by hours, losses by categories etc. Pitch your topic with ease and precision using this Lean Operational Excellence Strategy Manufacturing Dashboard To Check Production System Efficiency Pictures PDF. This layout presents information on Loading, Availability, Performance. It is also available for immediate download and adjustment. So, changes can be made in the color, design, graphics or any other component to create a unique layout.
Finance Metrics Dashboard Illustrating Gross And Operating Profit Margin Icons PDF
This graph or chart is linked to excel, and changes automatically based on data. Just left click on it and select edit data. Showcasing this set of slides titled Finance Metrics Dashboard Illustrating Gross And Operating Profit Margin Icons PDF. The topics addressed in these templates are Gross Profit Margin, Operating Profit Margin, Net Profit Margin. All the content presented in this PPT design is completely editable. Download it and make adjustments in color, background, font etc. as per your unique business setting.
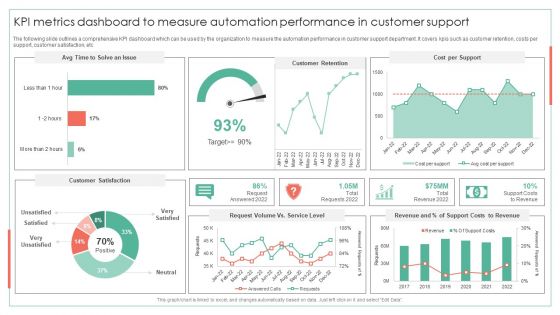
KPI Metrics Dashboard To Measure Automation Performance Achieving Operational Efficiency Guidelines PDF
The following slide outlines a comprehensive KPI dashboard which can be used by the organization to measure the automation performance in customer support department. It covers kpis such as customer retention, costs per support, customer satisfaction, etcDeliver and pitch your topic in the best possible manner with this KPI Metrics Dashboard To Measure Automation Performance Achieving Operational Efficiency Guidelines PDF. Use them to share invaluable insights on Customer Retention, Cost Per Support, Request Volume and impress your audience. This template can be altered and modified as per your expectations. So, grab it now.
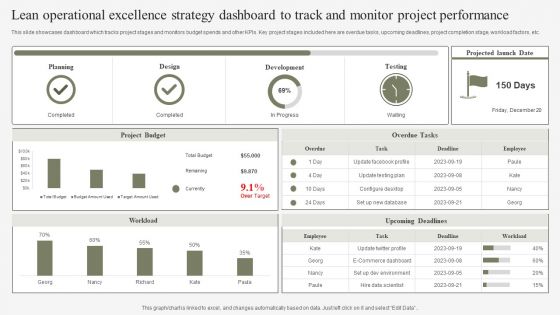
Lean Operational Excellence Strategy Dashboard To Track And Monitor Project Performance Slides PDF
This slide showcases dashboard which tracks project stages and monitors budget spends and other KPIs. Key project stages included here are overdue tasks, upcoming deadlines, project completion stage, workload factors, etc. Pitch your topic with ease and precision using this Lean Operational Excellence Strategy Dashboard To Track And Monitor Project Performance Slides PDF. This layout presents information on Planning, Design, Development. It is also available for immediate download and adjustment. So, changes can be made in the color, design, graphics or any other component to create a unique layout.
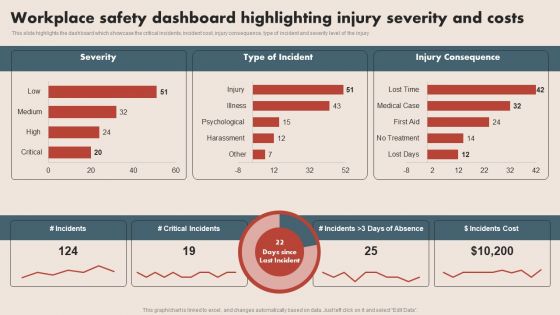
Deploying Safe Operating Procedures In The Organization Workplace Safety Dashboard Highlighting Injury Professional PDF
This slide highlights the dashboard which showcase the critical incidents, incident cost, injury consequence, type of incident and severity level of the injury. Take your projects to the next level with our ultimate collection of Deploying Safe Operating Procedures In The Organization Workplace Safety Dashboard Highlighting Injury Professional PDF. Slidegeeks has designed a range of layouts that are perfect for representing task or activity duration, keeping track of all your deadlines at a glance. Tailor these designs to your exact needs and give them a truly corporate look with your own brand colors they will make your projects stand out from the rest.

Lean Production Techniques To Enhance Operational Effectiveness Metric Dashboard To Monitor Lean Manufacturing Topics PDF
This slide represents metric dashboard to monitor lean manufacturing process. It includes production time, downtime, manufacturing cost, rework quality etc. Present like a pro with Lean Production Techniques To Enhance Operational Effectiveness Metric Dashboard To Monitor Lean Manufacturing Topics PDF Create beautiful presentations together with your team, using our easy to use presentation slides. Share your ideas in real time and make changes on the fly by downloading our templates. So whether you are in the office, on the go, or in a remote location, you can stay in sync with your team and present your ideas with confidence. With Slidegeeks presentation got a whole lot easier. Grab these presentations today.

KPI Dashboard Highlighting Automation Results In Supply Achieving Operational Efficiency Graphics PDF
The following slide outlines a comprehensive dashboard depicting the business process automation BPA results in the supply chain. Information covered in the slide is related to average order processing days, average shipping days, etc.Deliver and pitch your topic in the best possible manner with this KPI Dashboard Highlighting Automation Results In Supply Achieving Operational Efficiency Graphics PDF. Use them to share invaluable insights on Orders Progress, Late Deliveries, Deliveries Warehouse and impress your audience. This template can be altered and modified as per your expectations. So, grab it now.
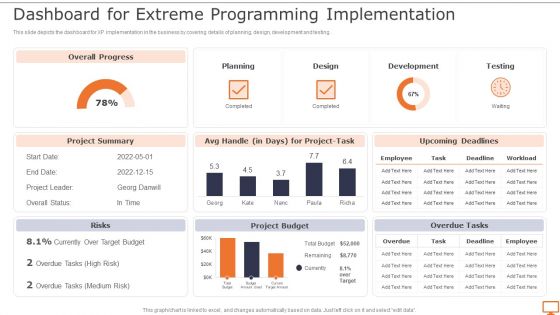
Deploying XP Practices To Enhance Operational Efficiency Dashboard For Extreme Programming Infographics PDF
This slide depicts the dashboard for XP implementation in the business by covering details of planning, design, development and testing. Welcome to our selection of theDeploying XP Practices To Enhance Operational Efficiency Dashboard For Extreme Programming Infographics PDF. These are designed to help you showcase your creativity and bring your sphere to life. Planning and Innovation are essential for any business that is just starting out. This collection contains the designs that you need for your everyday presentations. All of our PowerPoints are 100 Precent editable, so you can customize them to suit your needs. This multi-purpose template can be used in various situations. Grab these presentation templates today.
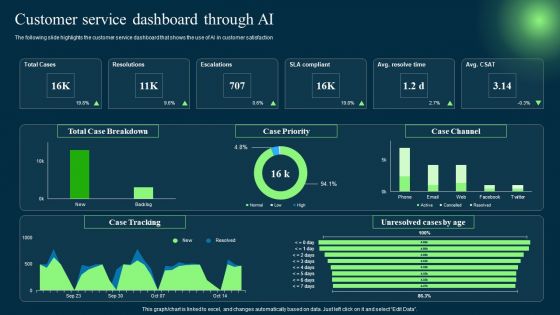
Introduction To Artificial Intelligence In Operation Management Industry Customer Service Dashboard Through AI Topics PDF
The following slide highlights the customer service dashboard that shows the use of AI in customer satisfaction. Slidegeeks is here to make your presentations a breeze with Introduction To Artificial Intelligence In Operation Management Industry Customer Service Dashboard Through AI Topics PDF With our easy-to-use and customizable templates, you can focus on delivering your ideas rather than worrying about formatting. With a variety of designs to choose from, you are sure to find one that suits your needs. And with animations and unique photos, illustrations, and fonts, you can make your presentation pop. So whether you are giving a sales pitch or presenting to the board, make sure to check out Slidegeeks first.
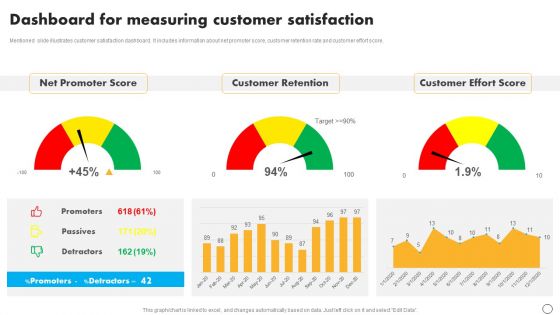
Retail Business Optimization Through Operational Excellence Strategy Dashboard Measuring Customer Template PDF
Mentioned slide illustrates customer satisfaction dashboard. It includes information about net promoter score, customer retention rate and customer effort score. Present like a pro with Retail Business Optimization Through Operational Excellence Strategy Dashboard Measuring Customer Template PDF Create beautiful presentations together with your team, using our easy to use presentation slides. Share your ideas in real time and make changes on the fly by downloading our templates. So whether you are in the office, on the go, or in a remote location, you can stay in sync with your team and present your ideas with confidence. With Slidegeeks presentation got a whole lot easier. Grab these presentations today.
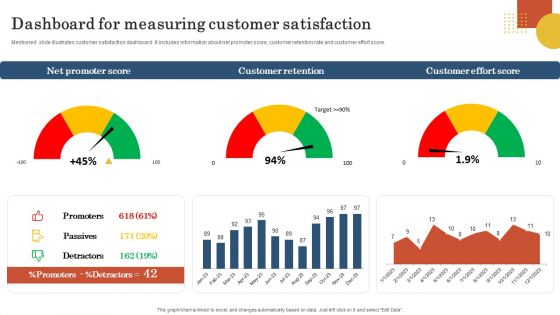
Retail Business Operation Management To Optimize Customer Experience Dashboard Measuring Customer Infographics PDF
Mentioned slide illustrates customer satisfaction dashboard. It includes information about net promoter score, customer retention rate and customer effort score. Present like a pro with Retail Business Operation Management To Optimize Customer Experience Dashboard Measuring Customer Infographics PDF Create beautiful presentations together with your team, using our easy to use presentation slides. Share your ideas in real time and make changes on the fly by downloading our templates. So whether you are in the office, on the go, or in a remote location, you can stay in sync with your team and present your ideas with confidence. With Slidegeeks presentation got a whole lot easier. Grab these presentations today.

Banking Operation Strategy Dashboard Highlighting Accounts And Product Referrals Inspiration PDF
This slide highlights the banking operation strategy which includes accounts opened and closed, total deposit vs branch goal, accounts by type, expense to budget and referrals by product. Deliver an awe inspiring pitch with this creative Banking Operation Strategy Dashboard Highlighting Accounts And Product Referrals Inspiration PDF bundle. Topics like Expenses To Budget, Income To Budget, Referrals By Product can be discussed with this completely editable template. It is available for immediate download depending on the needs and requirements of the user.

Banking Operation Strategy Dashboard Highlighting Accounts And Product Referrals Demonstration PDF
This slide highlights the banking operation strategy which includes accounts opened and closed, total deposit vs branch goal, accounts by type, expense to budget and referrals by product. Deliver an awe inspiring pitch with this creative Banking Operation Strategy Dashboard Highlighting Accounts And Product Referrals Demonstration PDF bundle. Topics like Income To Budget, Referrals By Product, Branch Goal can be discussed with this completely editable template. It is available for immediate download depending on the needs and requirements of the user.

Retail Business Operation Management To Optimize Customer Experience KPI Dashboard For Retail Business Download PDF
This slide portrays key performance dashboard for measuring retail business performance. KPIs covered in the dashboards are average shopping time, shop visitors, average basket spend and customer retention. Are you in need of a template that can accommodate all of your creative concepts This one is crafted professionally and can be altered to fit any style. Use it with Google Slides or PowerPoint. Include striking photographs, symbols, depictions, and other visuals. Fill, move around, or remove text boxes as desired. Test out color palettes and font mixtures. Edit and save your work, or work with colleagues. Download Retail Business Operation Management To Optimize Customer Experience KPI Dashboard For Retail Business Download PDF and observe how to make your presentation outstanding. Give an impeccable presentation to your group and make your presentation unforgettable.
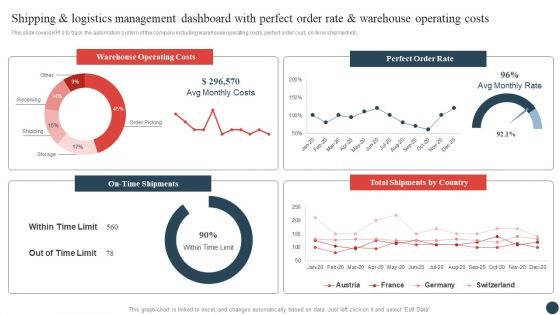
Shipping And Logistics Management Dashboard With Perfect Order Rate And Warehouse Operating Costs Topics PDF
This slide covers KPIs to track the automation system of the company including warehouse operating costs, perfect order cost, on-time shipment etc. Do you have to make sure that everyone on your team knows about any specific topic I yes, then you should give Shipping And Logistics Management Dashboard With Perfect Order Rate And Warehouse Operating Costs Topics PDF a try. Our experts have put a lot of knowledge and effort into creating this impeccable Shipping And Logistics Management Dashboard With Perfect Order Rate And Warehouse Operating Costs Topics PDF. You can use this template for your upcoming presentations, as the slides are perfect to represent even the tiniest detail. You can download these templates from the Slidegeeks website and these are easy to edit. So grab these today.
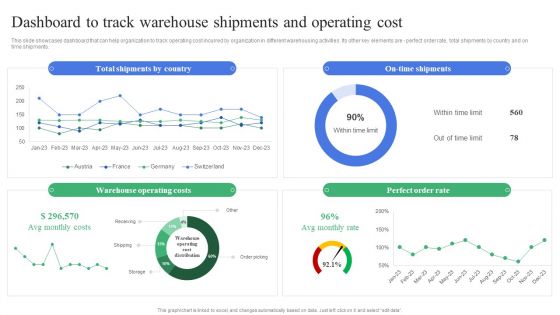
Strategic Guidelines To Administer Dashboard To Track Warehouse Shipments And Operating Sample PDF
This slide showcases dashboard that can help organization to track operating cost incurred by organization in different warehousing activities. Its other key elements are - perfect order rate, total shipments by country and on time shipments. Take your projects to the next level with our ultimate collection of Strategic Guidelines To Administer Dashboard To Track Warehouse Shipments And Operating Sample PDF. Slidegeeks has designed a range of layouts that are perfect for representing task or activity duration, keeping track of all your deadlines at a glance. Tailor these designs to your exact needs and give them a truly corporate look with your own brand colors theyll make your projects stand out from the rest.
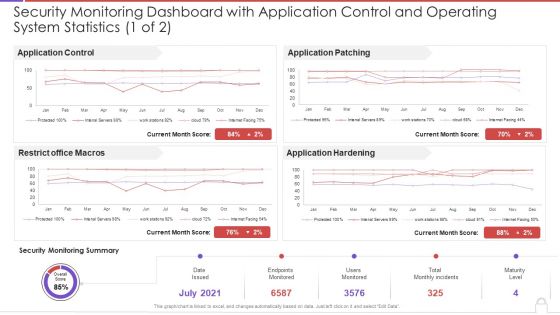
Security Monitoring Dashboard With Application Control And Operating System Statistics Template PDF
This graph or chart is linked to excel, and changes automatically based on data. Just left click on it and select Edit Data. Deliver and pitch your topic in the best possible manner with this security monitoring dashboard with application control and operating system statistics template pdf. Use them to share invaluable insights on application control, restrict office macros, application patching, application hardening and impress your audience. This template can be altered and modified as per your expectations. So, grab it now.

Degree Of Operational Leverage Dashboard With Income Statement Ppt Infographics Layout PDF
This slide illustrates graphical representation of company revenue and income statement. It includes monthly revenue, revenue by products, revenue by country etc. Pitch your topic with ease and precision using this Degree Of Operational Leverage Dashboard With Income Statement Ppt Infographics Layout PDF. This layout presents information on Monthly Revenue, Income Statement, Product. It is also available for immediate download and adjustment. So, changes can be made in the color, design, graphics or any other component to create a unique layout.

Data Quality Dashboard For Linked Data Integrating Linked Data To Enhance Operational Template PDF
This slide describes the data quality dashboard for linked data by covering details of account information quality, contact details quality, financial data quality, and missing account information.This Data Quality Dashboard For Linked Data Integrating Linked Data To Enhance Operational Template PDF from Slidegeeks makes it easy to present information on your topic with precision. It provides customization options, so you can make changes to the colors, design, graphics, or any other component to create a unique layout. It is also available for immediate download, so you can begin using it right away. Slidegeeks has done good research to ensure that you have everything you need to make your presentation stand out. Make a name out there for a brilliant performance.
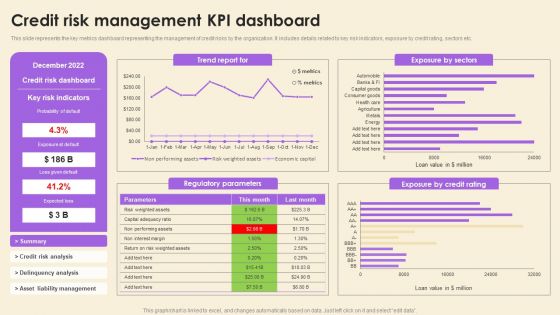
Operational Risk Assessment And Management Plan Credit Risk Management KPI Dashboard Guidelines PDF
This slide represents the key metrics dashboard representing the management of credit risks by the organization. It includes details related to key risk indicators, exposure by credit rating, sectors etc. Present like a pro with Operational Risk Assessment And Management Plan Credit Risk Management KPI Dashboard Guidelines PDF Create beautiful presentations together with your team, using our easy-to-use presentation slides. Share your ideas in real-time and make changes on the fly by downloading our templates. So whether you are in the office, on the go, or in a remote location, you can stay in sync with your team and present your ideas with confidence. With Slidegeeks presentation got a whole lot easier. Grab these presentations today.
Operational Risk Assessment And Management Plan Enterprise Cyber Risk Management Dashboard Icons PDF
This slide represents dashboard representing details related to management of strategic risks in the organization. It includes details related to risk rating breakdown, risk heat map, top 5 vulnerabilities etc. Slidegeeks is here to make your presentations a breeze with Operational Risk Assessment And Management Plan Enterprise Cyber Risk Management Dashboard Icons PDF With our easy-to-use and customizable templates, you can focus on delivering your ideas rather than worrying about formatting. With a variety of designs to choose from, you are sure to find one that suits your needs. And with animations and unique photos, illustrations, and fonts, you can make your presentation pop. So whether you are giving a sales pitch or presenting to the board, make sure to check out Slidegeeks first.
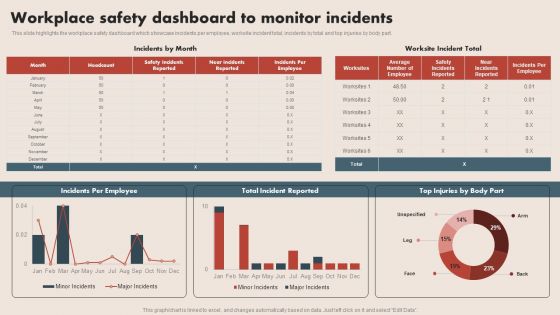
Deploying Safe Operating Procedures In The Organization Workplace Safety Dashboard To Monitor Incidents Professional PDF
This slide highlights the workplace safety dashboard which showcase incidents per employee, worksite incident total, incidents by total and top injuries by body part. Do you know about Slidesgeeks Deploying Safe Operating Procedures In The Organization Workplace Safety Dashboard To Monitor Incidents Professional PDF. These are perfect for delivering any kind od presentation. Using it, create PowerPoint presentations that communicate your ideas and engage audiences. Save time and effort by using our pre designed presentation templates that are perfect for a wide range of topic. Our vast selection of designs covers a range of styles, from creative to business, and are all highly customizable and easy to edit. Download as a PowerPoint template or use them as Google Slides themes.

BPR To Develop Operational Effectiveness Dashboard To Measure Business Financial Performance Elements PDF
This slide shows the dashboard to measure business financial performance which focuses on revenues, debt to equity, net profit margin, gross profit margin and return on equity. Coming up with a presentation necessitates that the majority of the effort goes into the content and the message you intend to convey. The visuals of a PowerPoint presentation can only be effective if it supplements and supports the story that is being told. Keeping this in mind our experts created BPR To Develop Operational Effectiveness Dashboard To Measure Business Financial Performance Elements PDF to reduce the time that goes into designing the presentation. This way, you can concentrate on the message while our designers take care of providing you with the right template for the situation.
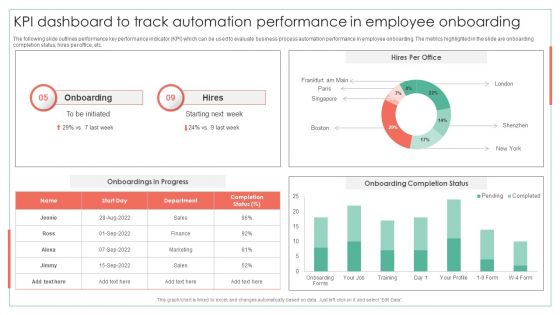
KPI Dashboard To Track Automation Performance In Employee Onboarding Achieving Operational Efficiency Download PDF
The following slide outlines performance key performance indicator KPI which can be used to evaluate business process automation performance in employee onboarding. The metrics highlighted in the slide are onboarding completion status, hires per office, etc.Deliver an awe inspiring pitch with this creative KPI Dashboard To Track Automation Performance In Employee Onboarding Achieving Operational Efficiency Download PDF bundle. Topics like Onboarding Completion, Onboarding, Onboarding Completion can be discussed with this completely editable template. It is available for immediate download depending on the needs and requirements of the user.
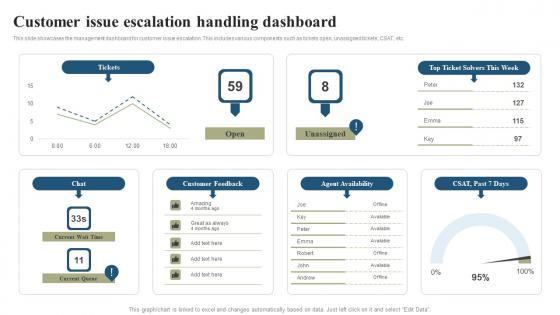
Customer Issue Escalation Handling Dashboard Download Pdf
This slide showcases the management dashboard for customer issue escalation. This includes various components such as tickets open, unassigned tickets, CSAT, etc. Pitch your topic with ease and precision using this Customer Issue Escalation Handling Dashboard Download Pdf This layout presents information on Customer Feedback, Agent Availability, Customer Issue It is also available for immediate download and adjustment. So, changes can be made in the color, design, graphics or any other component to create a unique layout.

Dashboard Employee Attrition Rate Sale Microsoft PDF
This slide shows the dashboard related to the growth in attrition rate of the employees in the company. Deliver an awe inspiring pitch with this creative dashboard employee attrition rate sale microsoft pdf bundle. Topics like dashboard employee attrition rate can be discussed with this completely editable template. It is available for immediate download depending on the needs and requirements of the user.

 Home
Home