It Change Management Kpis
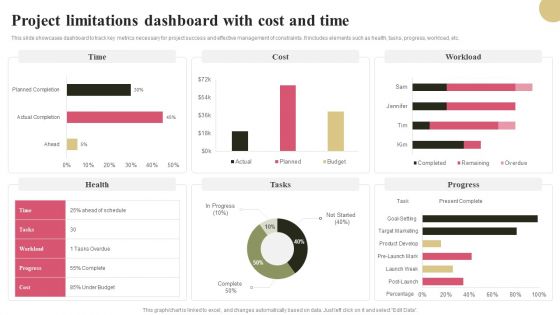
Project Limitations Dashboard With Cost And Time Graphics PDF
This slide showcases dashboard to track key metrics necessary for project success and effective management of constraints. It includes elements such as health, tasks, progress, workload, etc. Pitch your topic with ease and precision using this Project Limitations Dashboard With Cost And Time Graphics PDF. This layout presents information on Time, Workload, Tasks, Progress. It is also available for immediate download and adjustment. So, changes can be made in the color, design, graphics or any other component to create a unique layout.

Sprint Metrics And Backlog Summary Report Brochure PDF
This slide illustrates summary of Jira project management sprint testing. It includes sprint highlights, overall issues and risks, retrospective points, sprint spillover, etc. Pitch your topic with ease and precision using this Sprint Metrics And Backlog Summary Report Brochure PDF. This layout presents information on Sprint Metrics And Backlog, Summary Report. It is also available for immediate download and adjustment. So, changes can be made in the color, design, graphics or any other component to create a unique layout.
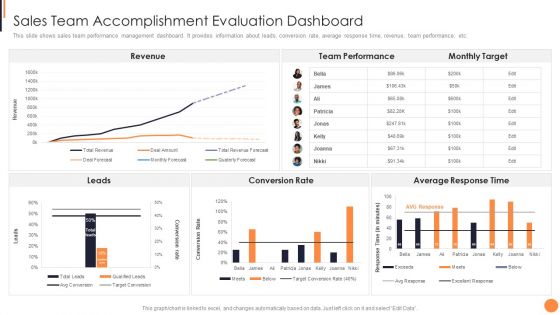
Sales Team Accomplishment Evaluation Dashboard Portrait PDF
This slide shows sales team performance management dashboard. It provides information about leads, conversion rate, average response time, revenue, team performance, etc. Pitch your topic with ease and precision using this sales team accomplishment evaluation dashboard portrait pdf This layout presents information on sales team accomplishment evaluation dashboard It is also available for immediate download and adjustment. So, changes can be made in the color, design, graphics or any other component to create a unique layout.

ITIL Incident Regulation Kpi Dashboard Background PDF
This slide covers ITIL problem management KPI dashboard to track status of problems. It involves KPI such as total number of incidents, problems, requests, average time to solve incidents.Pitch your topic with ease and precision using this ITIL Incident Regulation Kpi Dashboard Background PDF. This layout presents information on Active Problems, Average Incidents, Opened Problems. It is also available for immediate download and adjustment. So, changes can be made in the color, design, graphics or any other component to create a unique layout.
Project Tracking And Evaluation Dashboard Portrait PDF
This slide illustrates graphical representation and facts and figures relating to project management data. It includes budget by employee, overdue tasks, workload charts etc. Pitch your topic with ease and precision using this Project Tracking And Evaluation Dashboard Portrait PDF. This layout presents information on Employee Budget, Target, Design, Development. It is also available for immediate download and adjustment. So, changes can be made in the color, design, graphics or any other component to create a unique layout.

Credit Administration Dashboard With Administration Details Formats PDF
This slide illustrates credit management dashboard with administration details. It also provides information on debtors, invoices, current payment plans, says sales outstanding, credit maturity analysis, outstanding amount, etc. Pitch your topic with ease and precision using this Credit Administration Dashboard With Administration Details Formats PDF. This layout presents information on Sales, Payment, Plans. It is also available for immediate download and adjustment. So, changes can be made in the color, design, graphics or any other component to create a unique layout.
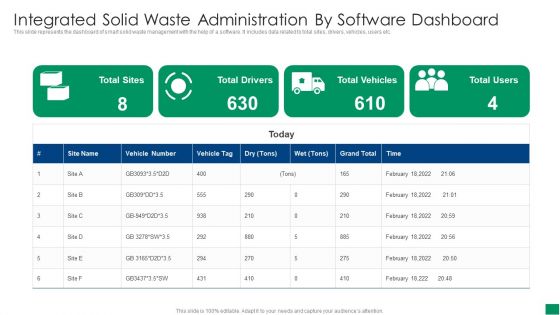
Integrated Solid Waste Administration By Software Dashboard Ideas PDF
This slide represents the dashboard of smart solid waste management with the help of a software. It includes data related to total sites, drivers, vehicles, users etc. Pitch your topic with ease and precision using this Integrated Solid Waste Administration By Software Dashboard Ideas PDF. This layout presents information on Dashboard, Administration, Integrated. It is also available for immediate download and adjustment. So, changes can be made in the color, design, graphics or any other component to create a unique layout.
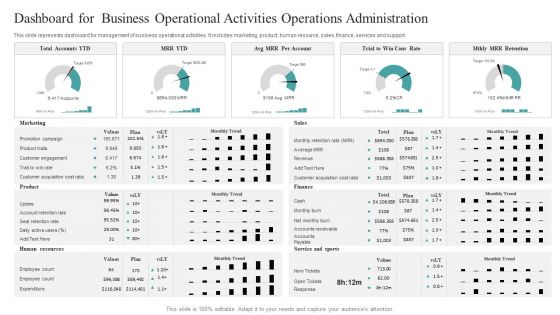
Dashboard For Business Operational Activities Operations Administration Designs PDF
This slide represents dashboard for management of business operational activities. It includes marketing, product, human resource, sales, finance, services and support. Pitch your topic with ease and precision using this Dashboard For Business Operational Activities Operations Administration Designs PDF. This layout presents information on Marketing, Product, Human Resources. It is also available for immediate download and adjustment. So, changes can be made in the color, design, graphics or any other component to create a unique layout.
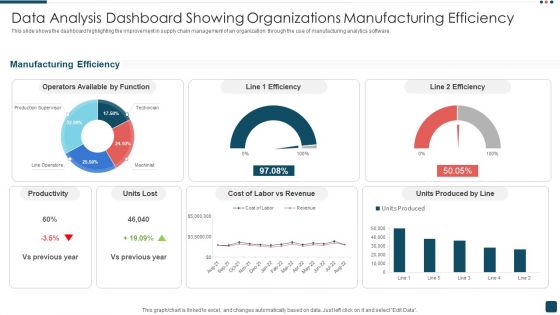
Data Analysis Dashboard Showing Organizations Manufacturing Efficiency Demonstration PDF
This slide shows the dashboard highlighting the improvement in supply chain management of an organization through the use of manufacturing analytics software. Pitch your topic with ease and precision using this Data Analysis Dashboard Showing Organizations Manufacturing Efficiency Demonstration PDF. This layout presents information on Productivity, Revenue, Manufacturing Efficiency. It is also available for immediate download and adjustment. So, changes can be made in the color, design, graphics or any other component to create a unique layout.
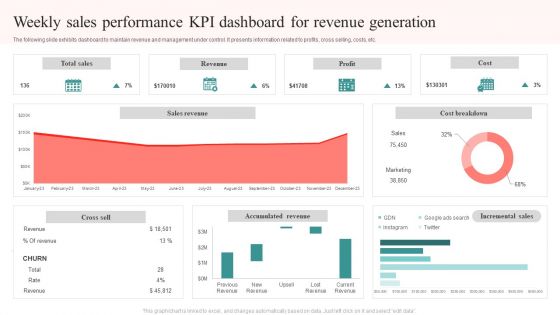
Weekly Sales Performance KPI Dashboard For Revenue Generation Brochure PDF
The following slide exhibits dashboard to maintain revenue and management under control. It presents information related to profits, cross selling, costs, etc. Pitch your topic with ease and precision using this Weekly Sales Performance KPI Dashboard For Revenue Generation Brochure PDF. This layout presents information on Total Sales, Revenue, Profit, Cost. It is also available for immediate download and adjustment. So, changes can be made in the color, design, graphics or any other component to create a unique layout.

Dashboard Depicting Customer Engagement In Marketing Campaigns Inspiration PDF
This slide illustrates a dashboard showcasing digital customer management in the campaign. It covers emails sent, delivered, and opened by customers, website clicks, and bounce rate. Pitch your topic with ease and precision using this Dashboard Depicting Customer Engagement In Marketing Campaigns Inspiration PDF. This layout presents information on Program, Campaign, Email Message. It is also available for immediate download and adjustment. So, changes can be made in the color, design, graphics or any other component to create a unique layout.

Agile PM Dashboard With Backlog Status Summary PDF
This template covers backlog description and status for agile project management with risk and issues mitigation. Further, it includes scope showing activities completion. Pitch your topic with ease and precision using this Agile PM Dashboard With Backlog Status Summary PDF. This layout presents information on Service For Developer Login, Risk And Issues, Service Development. It is also available for immediate download and adjustment. So, changes can be made in the color, design, graphics or any other component to create a unique layout.

SHRM Dashboard Of Employee Satisfaction Ppt PowerPoint Presentation Styles Example File PDF
This slide showcases the advanced statistics of employees satisfaction. It offers information about employee turnover, project employment, and working format that makes management convenient.Pitch your topic with ease and precision using this SHRM Dashboard Of Employee Satisfaction Ppt PowerPoint Presentation Styles Example File PDF. This layout presents information on Total Employees, Happiness Rate, Project Employment. It is also available for immediate download and adjustment. So, changes can be made in the color, design, graphics or any other component to create a unique layout.
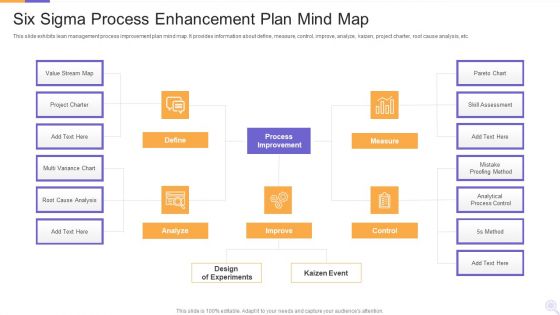
Six Sigma Process Enhancement Plan Mind Map Mockup PDF
This slide exhibits lean management process improvement plan mind map. It provides information about define, measure, control, improve, analyze, kaizen, project charter, root cause analysis, etc.Pitch your topic with ease and precision using this Six Sigma Process Enhancement Plan Mind Map Mockup PDF. This layout presents information on Measure, Analyze, Process Improvement. It is also available for immediate download and adjustment. So, changes can be made in the color, design, graphics or any other component to create a unique layout.
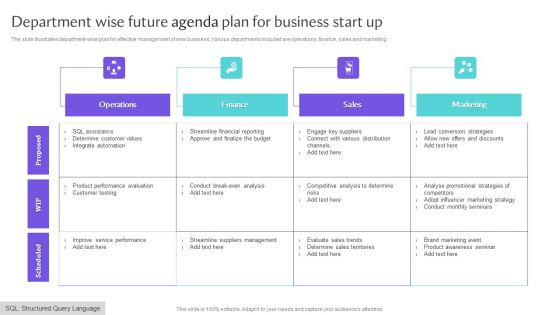
Department Wise Future Agenda Plan For Business Start Up Template PDF
The slide illustrates department-wise plan for effective management of new business. Various departments included are operations, finance, sales and marketing. Pitch your topic with ease and precision using this Department Wise Future Agenda Plan For Business Start Up Template PDF. This layout presents information on Integrate Automation, Product Performance, Service Performance. It is also available for immediate download and adjustment. So, changes can be made in the color, design, graphics or any other component to create a unique layout.
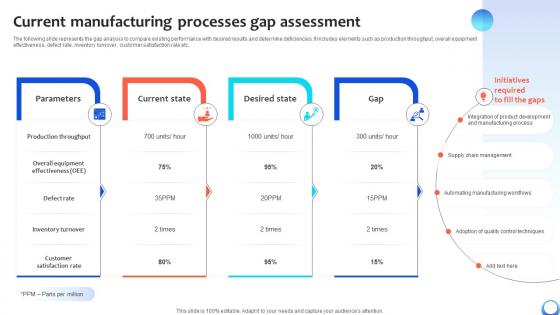
Current Manufacturing Processes Gap Assessment Automating Production Process Strategy SS V
The following slide represents the gap analysis to compare existing performance with desired results and determine deficiencies. It includes elements such as production throughput, overall equipment effectiveness, defect rate, inventory turnover, customer satisfaction rate etc. If your project calls for a presentation, then Slidegeeks is your go-to partner because we have professionally designed, easy-to-edit templates that are perfect for any presentation. After downloading, you can easily edit Current Manufacturing Processes Gap Assessment Automating Production Process Strategy SS V and make the changes accordingly. You can rearrange slides or fill them with different images. Check out all the handy templates
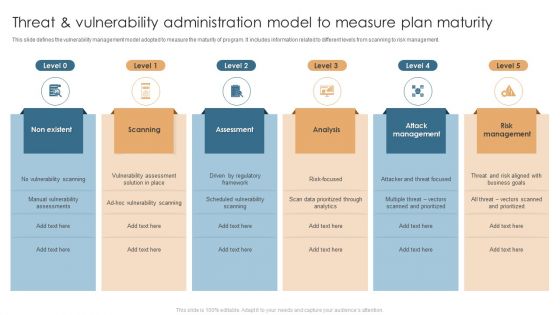
Threat And Vulnerability Administration Model To Measure Plan Maturity Structure PDF
This slide defines the vulnerability management model adopted to measure the maturity of program. It includes information related to different levels from scanning to risk management. Persuade your audience using this Threat And Vulnerability Administration Model To Measure Plan Maturity Structure PDF. This PPT design covers six stages, thus making it a great tool to use. It also caters to a variety of topics including Non Existent, Scanning, Assessment, Analysis, Attack Management. Download this PPT design now to present a convincing pitch that not only emphasizes the topic but also showcases your presentation skills.
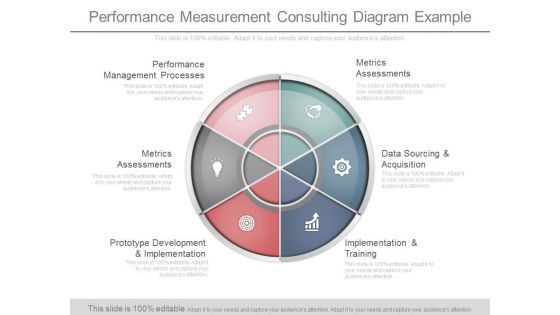
Performance Measurement Consulting Diagram Example
This is a performance measurement consulting diagram example. This is a six stage process. The stages in this process are performance management processes, metrics assessments, prototype development and implementation, metrics assessments, data sourcing and acquisition, implementation and training.
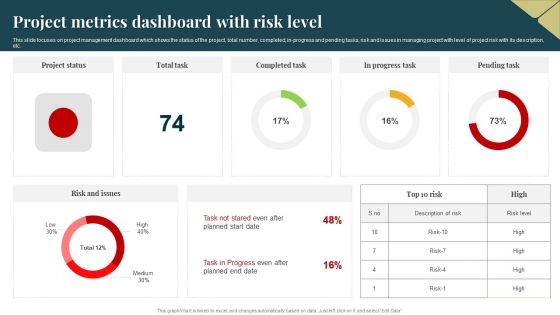
Project Metrics Dashboard With Risk Level Guidelines PDF
This slide focuses on project management dashboard which shows the status of the project, total number, completed, in progress and pending tasks, risk and issues in managing project with level of project risk with its description, etc. Pitch your topic with ease and precision using this Project Metrics Dashboard With Risk Level Guidelines PDF. This layout presents information on Project Metrics Dashboard, Risk Level. It is also available for immediate download and adjustment. So, changes can be made in the color, design, graphics or any other component to create a unique layout.

Project Metrics Dashboard With Due Tasks Microsoft PDF
This slide shows the project management dashboard which includes hours taken by client, account manager, service, actual working hours, description of services such as web programming, search engine optimization, graphic designing, etc. Pitch your topic with ease and precision using this Project Metrics Dashboard With Due Tasks Microsoft PDF. This layout presents information on Service, Optimization, Graphic Design. It is also available for immediate download and adjustment. So, changes can be made in the color, design, graphics or any other component to create a unique layout.

Project Metrics Dashboard With Task Status Rules PDF
This slide shows the project management dashboard which shows the number of team members of managing project activities, estimated and actual time to complete the project task, hours taken by employees with achieved and open milestones and progress status. Pitch your topic with ease and precision using this Project Metrics Dashboard With Task Status Rules PDF. This layout presents information on Team Members, Employee. It is also available for immediate download and adjustment. So, changes can be made in the color, design, graphics or any other component to create a unique layout.

Project Metrics Dashboard With Responsibilities Graphics PDF
This slide focuses on project management dashboard which shows the number of projects, types of objects, key performance indicators, viewpoints, overall project status with actions and progress, responsibilities with linked object types and actions, etc. Pitch your topic with ease and precision using this Project Metrics Dashboard With Responsibilities Graphics PDF. This layout presents information on Project Metrics, Dashboard With Responsibilities. It is also available for immediate download and adjustment. So, changes can be made in the color, design, graphics or any other component to create a unique layout.

Consulting Business ORMF Ppt PowerPoint Presentation Summary Example Topics PDF
This slide covers framework designed to address risk management challenges and bring business value. It includes critical elements such as risk strategy and appetite, risk governance, risk culture, operational risk assessment and measurement, operational risk management and monitoring, etc.Persuade your audience using this Consulting Business ORMF Ppt PowerPoint Presentation Summary Example Topics PDF. This PPT design covers seven stages, thus making it a great tool to use. It also caters to a variety of topics including Management Strategy, Operative Technology, Reporting Operational. Download this PPT design now to present a convincing pitch that not only emphasizes the topic but also showcases your presentation skills.
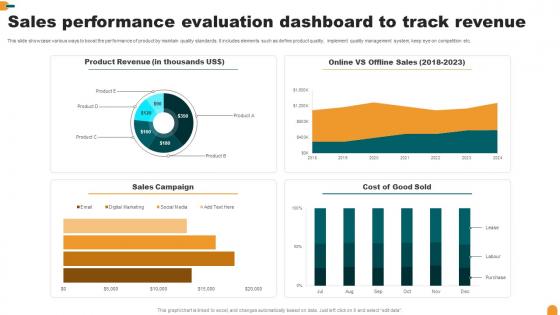
Sales Performance Evaluation Dashboard To Track Revenue Summary Pdf
This slide showcase various ways to boost the performance of product by maintain quality standards. It includes elements such as define product quality, implement quality management system, keep eye on competition etc.Pitch your topic with ease and precision using this Sales Performance Evaluation Dashboard To Track Revenue Summary Pdf This layout presents information on Sales Campaign, Product Revenue, Cost Good Sold It is also available for immediate download and adjustment. So, changes can be made in the color, design, graphics or any other component to create a unique layout.
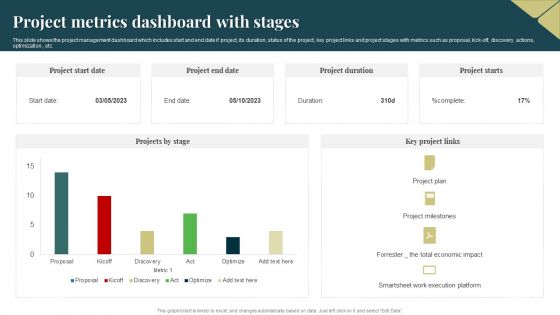
Project Metrics Dashboard With Stages Download PDF
This slide shows the project management dashboard which includes start and end date if project, its duration, status of the project, key project links and project stages with metrics such as proposal, kick off, discovery, actions, optimization , etc. Pitch your topic with ease and precision using this Project Metrics Dashboard With Stages Download PDF. This layout presents information on Economic, Project Plan, Execution. It is also available for immediate download and adjustment. So, changes can be made in the color, design, graphics or any other component to create a unique layout.
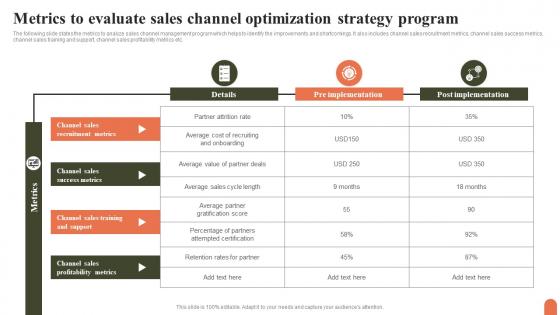
Metrics To Evaluate Sales Channel Optimization Strategy Program Infographics Pdf
The following slide states the metrics to analyze sales channel management program which helps to identify the improvements and shortcomings. It also includes channel sales recruitment metrics, channel sales success metrics, channel sales training and support, channel sales profitability metrics etc. Pitch your topic with ease and precision using this Metrics To Evaluate Sales Channel Optimization Strategy Program Infographics Pdf. This layout presents information on Channel Sales Success Metrics, Channel Sales Profitability Metrics, Channel Sales Recruitment Metrics. It is also available for immediate download and adjustment. So, changes can be made in the color, design, graphics or any other component to create a unique layout.

IT Infrastructure Governance Content Ppt Slides Graphic Tips PDF
Deliver an awe inspiring pitch with this creative it infrastructure governance content ppt slides graphic tips pdf. bundle. Topics like introduction to infrastructure, asset management process, inventory and condition assessment, contract and workflow management, commissioning new facilities, capital budgeting, kpi metrics and dashboard can be discussed with this completely editable template. It is available for immediate download depending on the needs and requirements of the user.
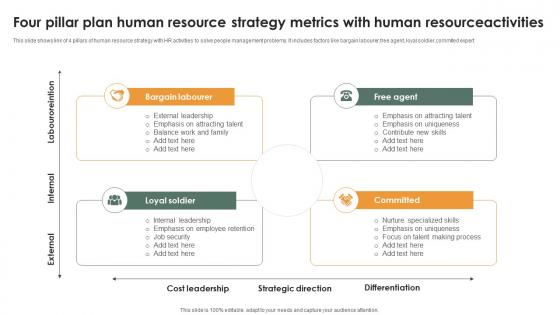
Four Pillar Plan Human Resource Strategy Metrics With Human Resourceactivities Elements Pdf
This slide shows link of 4 pillars of human resource strategy with HR activities to solve people management problems. It includes factors like bargain labourer,free agent, loyal soldier,commited expert. Pitch your topic with ease and precision using this Four Pillar Plan Human Resource Strategy Metrics With Human Resourceactivities Elements Pdf. This layout presents information on Bargain Labourer, Free Agent, Committed. It is also available for immediate download and adjustment. So, changes can be made in the color, design, graphics or any other component to create a unique layout.

Table Of Contents For Project Security Administration IT Pictures PDF
Presenting table of contents for project security administration it pictures pdf to provide visual cues and insights. Share and navigate important information on eight stages that need your due attention. This template can be used to pitch topics like project safety management, security centre implementation, budget assessment, dashboard analysis, project management team. In addtion, this PPT design contains high resolution images, graphics, etc, that are easily editable and available for immediate download.

Project Metrics Dashboard With Budgets Topics PDF
This slide shows the project management dashboard which covers the overall budget, project status with legends such as done, working on it, to do and stuck, high priority projects that helps company to analyze the requirements of business for achieving objective. Pitch your topic with ease and precision using this Project Metrics Dashboard With Budgets Topics PDF. This layout presents information on Budgets, Projects, Banners Design. It is also available for immediate download and adjustment. So, changes can be made in the color, design, graphics or any other component to create a unique layout.
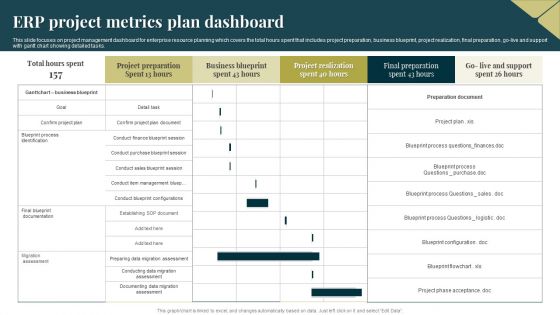
Erp Project Metrics Plan Dashboard Slides PDF
This slide focuses on project management dashboard for enterprise resource planning which covers the total hours spent that includes project preparation, business blueprint, project realization, final preparation, go live and support with gantt chart showing detailed tasks. Pitch your topic with ease and precision using this Erp Project Metrics Plan Dashboard Slides PDF. This layout presents information on Business Blueprint, Project Preparation, Project Realization. It is also available for immediate download and adjustment. So, changes can be made in the color, design, graphics or any other component to create a unique layout.

Ways To Improve Performance Evaluation To Boost Sales Diagrams Pdf
This slide showcase various ways to boost the performance of product by maintain quality standards. It includes elements such as define product quality, implement quality management system, keep eye on competition etc.Pitch your topic with ease and precision using this Ways To Improve Performance Evaluation To Boost Sales Diagrams Pdf This layout presents information on Implement Quality, Train Employees, Customer Requirements It is also available for immediate download and adjustment. So, changes can be made in the color, design, graphics or any other component to create a unique layout.
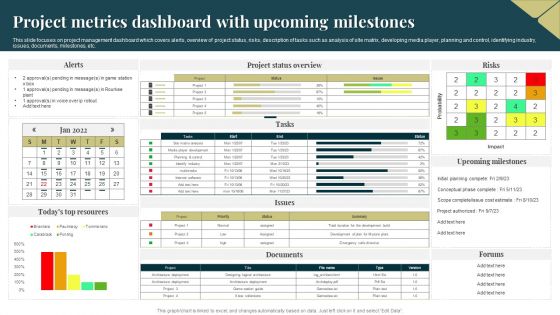
Project Metrics Dashboard With Upcoming Milestones Demonstration PDF
This slide focuses on project management dashboard which covers alerts, overview of project status, risks, description of tasks such as analysis of site matrix, developing media player, planning and control, identifying industry, issues, documents, milestones, etc. Pitch your topic with ease and precision using this Project Metrics Dashboard With Upcoming Milestones Demonstration PDF. This layout presents information on Probability, Project, Risks. It is also available for immediate download and adjustment. So, changes can be made in the color, design, graphics or any other component to create a unique layout.
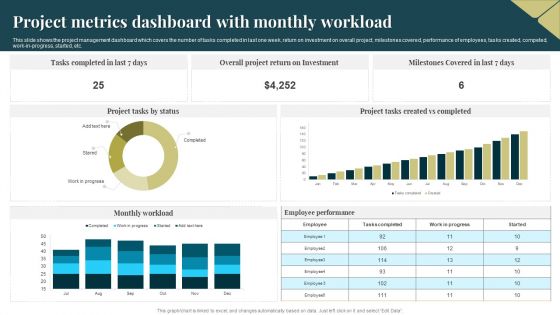
Project Metrics Dashboard With Monthly Workload Topics PDF
This slide shows the project management dashboard which covers the number of tasks completed in last one week, return on investment on overall project, milestones covered, performance of employees, tasks created, competed, work in progress, started, etc. Pitch your topic with ease and precision using this Project Metrics Dashboard With Monthly Workload Topics PDF. This layout presents information on Investment, Employee Performance, Project Metrics Dashboard. It is also available for immediate download and adjustment. So, changes can be made in the color, design, graphics or any other component to create a unique layout.
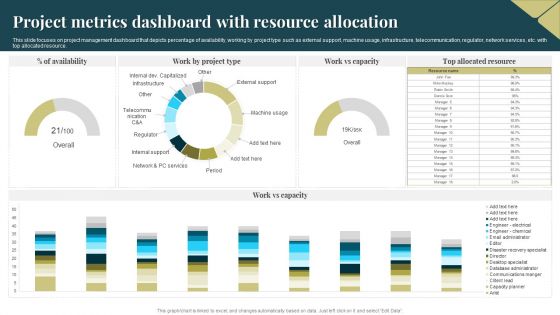
Project Metrics Dashboard With Resource Allocation Portrait PDF
This slide focuses on project management dashboard that depicts percentage of availability, working by project type such as external support, machine usage, infrastructure, telecommunication, regulator, network services, etc. with top allocated resource. Pitch your topic with ease and precision using this Project Metrics Dashboard With Resource Allocation Portrait PDF. This layout presents information on Project Metrics Dashboard, Resource Allocation. It is also available for immediate download and adjustment. So, changes can be made in the color, design, graphics or any other component to create a unique layout.
Project Metrics Dashboard Depicting Tracking System Inspiration PDF
This slide focuses on project management dashboard which covers the four spirit teams, iteration defects by priority with quarterly roadmap with legends such as high attention, low, none, normal and resolved immediately with time in iteration, etc. Pitch your topic with ease and precision using this Project Metrics Dashboard Depicting Tracking System Inspiration PDF. This layout presents information on Project Metrics, Dashboard Depicting, Tracking System. It is also available for immediate download and adjustment. So, changes can be made in the color, design, graphics or any other component to create a unique layout.
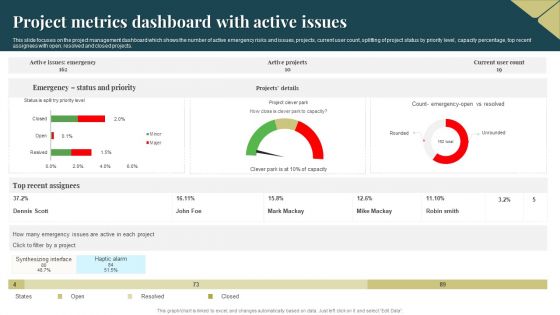
Project Metrics Dashboard With Active Issues Topics PDF
This slide focuses on the project management dashboard which shows the number of active emergency risks and issues, projects, current user count, splitting of project status by priority level, capacity percentage, top recent assignees with open, resolved and closed projects. Pitch your topic with ease and precision using this Project Metrics Dashboard With Active Issues Topics PDF. This layout presents information on Project Metrics, Dashboard With Active Issues. It is also available for immediate download and adjustment. So, changes can be made in the color, design, graphics or any other component to create a unique layout.

Project Metrics Dashboard With Team Requests Background PDF
This slide focuses on the project management dashboard which shows the creation of monthly number of requests, requests made by departmental teams, average completion time in days with the number of requests created on week days, etc. Pitch your topic with ease and precision using this Project Metrics Dashboard With Team Requests Background PDF. This layout presents information on Project Metrics Dashboard, Team Requests. It is also available for immediate download and adjustment. So, changes can be made in the color, design, graphics or any other component to create a unique layout.

Dashboard For Monthly Earnings And Loss Summary With Net Revenue Background Pdf
This slide displays a dashboard to effectively visualize major profitability indicators and communicate crucial information to upper management of the company. It includes details such as cost of goods sold, earnings before interest and taxes, interest expense, etc. Pitch your topic with ease and precision using this Dashboard For Monthly Earnings And Loss Summary With Net Revenue Background Pdf. This layout presents information on Dashboard For Monthly Earnings, Loss Summary, Net Revenue. It is also available for immediate download and adjustment. So, changes can be made in the color, design, graphics or any other component to create a unique layout.
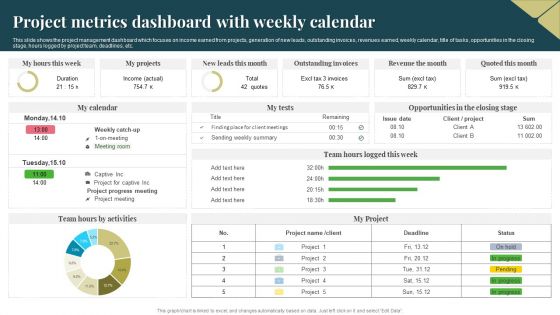
Project Metrics Dashboard With Weekly Calendar Download PDF
This slide shows the project management dashboard which focuses on income earned from projects, generation of new leads, outstanding invoices, revenues earned, weekly calendar, title of tasks, opportunities in the closing stage, hours logged by project team, deadlines, etc. Pitch your topic with ease and precision using this Project Metrics Dashboard With Weekly Calendar Download PDF. This layout presents information on Income, Revenue, Project. It is also available for immediate download and adjustment. So, changes can be made in the color, design, graphics or any other component to create a unique layout.
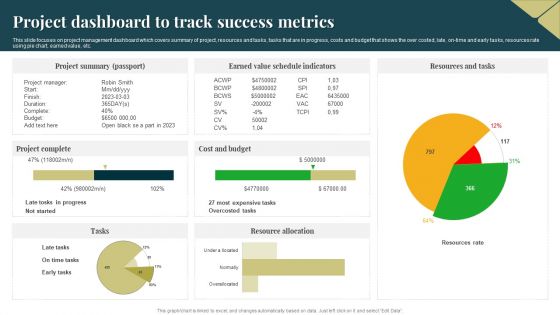
Project Dashboard To Track Success Metrics Background PDF
This slide focuses on project management dashboard which covers summary of project, resources and tasks, tasks that are in progress, costs and budget that shows the over costed, late, on time and early tasks, resources rate using pie chart, earned value, etc. Pitch your topic with ease and precision using this Project Dashboard To Track Success Metrics Background PDF. This layout presents information on Cost And Budget, Project Summary, Resource Allocation. It is also available for immediate download and adjustment. So, changes can be made in the color, design, graphics or any other component to create a unique layout.

Project Metrics Dashboard Showing Organizational Progress Demonstration PDF
This slide covers the project management dashboard that shows the two year timeline of project tasks and activities such as hiring survey consultants, writing curriculum, creating employees training programs with initiative, its description, budget, end date, milestones, etc. Pitch your topic with ease and precision using this Project Metrics Dashboard Showing Organizational Progress Demonstration PDF. This layout presents information on Budget, Survey, Employees. It is also available for immediate download and adjustment. So, changes can be made in the color, design, graphics or any other component to create a unique layout.

Project Metrics Dashboard With Average Margin Sample PDF
This slide focuses on project management dashboard which covers number of active projects, average margin, revenues, costs, tasks status, resources with planned and actual efforts, available hours, tasks assignments with project deadlines, client, etc. Pitch your topic with ease and precision using this Project Metrics Dashboard With Average Margin Sample PDF. This layout presents information on Average Margin, Revenue, Cost. It is also available for immediate download and adjustment. So, changes can be made in the color, design, graphics or any other component to create a unique layout.

Project Metrics Dashboard With Monthly Sales Professional PDF
This slide focuses on project management dashboard which states the progress of the project, spending on designing, developing and testing of project, monthly sales graph using bar and line chart with number of sales and referrals in 12 months. Pitch your topic with ease and precision using this Project Metrics Dashboard With Monthly Sales Professional PDF. This layout presents information on Project Progress, Project Spend, Sales Graph. It is also available for immediate download and adjustment. So, changes can be made in the color, design, graphics or any other component to create a unique layout.
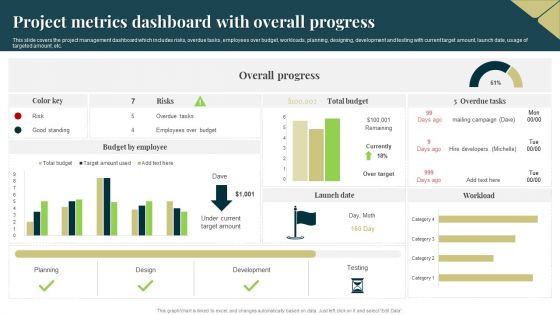
Project Metrics Dashboard With Overall Progress Brochure PDF
This slide covers the project management dashboard which includes risks, overdue tasks, employees over budget, workloads, planning, designing, development and testing with current target amount, launch date, usage of targeted amount, etc. Pitch your topic with ease and precision using this Project Metrics Dashboard With Overall Progress Brochure PDF. This layout presents information on Design, Planning, Development. It is also available for immediate download and adjustment. So, changes can be made in the color, design, graphics or any other component to create a unique layout.

Project Portfolio Metrics Dashboard With Activity Plan Clipart PDF
This slide focuses on project portfolio management dashboard which includes completed projects, budget spent, number of team members, associated risks and issues, activity plan with duration, status percentage, budget allocation, critical issues, tasks, comments, etc. Pitch your topic with ease and precision using this Project Portfolio Metrics Dashboard With Activity Plan Clipart PDF. This layout presents information on Budgets, Team, Risks. It is also available for immediate download and adjustment. So, changes can be made in the color, design, graphics or any other component to create a unique layout.
Critical Measures For Ensuring Threats Handling Activities Tracking Dashboard Summary PDF
This slide provides details regarding various threats management activities tracking dashboard in terms of breach risk trends, risk issues by owner, breach likelihood, etc. If your project calls for a presentation, then Slidegeeks is your go-to partner because we have professionally designed, easy-to-edit templates that are perfect for any presentation. After downloading, you can easily edit Critical Measures For Ensuring Threats Handling Activities Tracking Dashboard Summary PDF and make the changes accordingly. You can rearrange slides or fill them with different images. Check out all the handy templates.

Case Administration Dashboard With Resolved Cases Graphics PDF
This slide shows dashboard which can be used to monitor the status of case management solved in the organizations. It includes key performance indicators such as active cases by priority, by subject, by age, by branch, etc. Pitch your topic with ease and precision using this Case Administration Dashboard With Resolved Cases Graphics PDF. This layout presents information on Case Administration Dashboard, Resolved Cases. It is also available for immediate download and adjustment. So, changes can be made in the color, design, graphics or any other component to create a unique layout.

Current Manufacturing Processes Gap Assessment Implementing Manufacturing Strategy SS V
The following slide represents the gap analysis to compare existing performance with desired results and determine deficiencies. It includes elements such as production throughput, overall equipment effectiveness, defect rate, inventory turnover, customer satisfaction rate etc. If your project calls for a presentation, then Slidegeeks is your go-to partner because we have professionally designed, easy-to-edit templates that are perfect for any presentation. After downloading, you can easily edit Current Manufacturing Processes Gap Assessment Implementing Manufacturing Strategy SS V and make the changes accordingly. You can rearrange slides or fill them with different images. Check out all the handy templates

Research Objectives To Understand Global Security Industry PPT Template IR SS V
The slide highlights the SWOT analysis of Defense industry. The main purpose of this side is to understand and measure the comprehensive assessment of defense market. It further helps in mitigating the potential risks. Key components include strengths, weakness opportunities and threats. The slide portrays the research objectives overview of the defense industry report. It aims to cover the different objectives which are used to understand the research conducted while preparing the report. It includes market research objectives, technological objectives, future purpose objectives for understanding the global defense market. Are you searching for a Research Objectives To Understand Global Security Industry PPT Template IR SS V that is uncluttered, straightforward, and original Its easy to edit, and you can change the colors to suit your personal or business branding. For a presentation that expresses how much effort you have put in, this template is ideal With all of its features, including tables, diagrams, statistics, and lists, its perfect for a business plan presentation. Make your ideas more appealing with these professional slides. Download Research Objectives To Understand Global Security Industry PPT Template IR SS V from Slidegeeks today.

Toolkit For Measuring And Assessing Communication Tactics Activities Background PDF
This slide demonstrates toolkit to assess and gauge communication acuities implemented by organisations to achieve higher level of workforce performance management and engagement. This slide includes communication activities and strategies and evaluation and measurement tools. Pitch your topic with ease and precision using this Toolkit For Measuring And Assessing Communication Tactics Activities Background PDF. This layout presents information on Communication Activities, Evaluation Tools, Measurement Tools. It is also available for immediate download and adjustment. So, changes can be made in the color, design, graphics or any other component to create a unique layout.
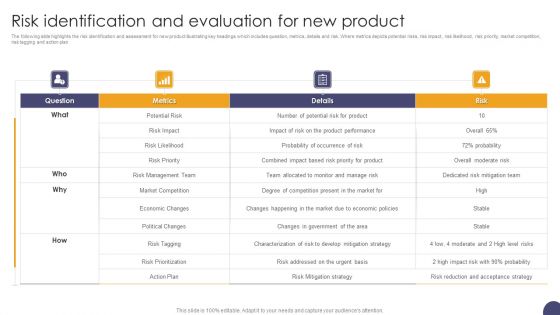
Risk Identification And Evaluation For New Product Ppt Styles Portfolio PDF
The following slide highlights the risk identification and assessment for new product illustrating key headings which includes question, metrics, details and risk. Where metrics depicts potential risks, risk impact, risk likelihood, risk priority, market competition, risk tagging and action plan. Pitch your topic with ease and precision using this Risk Identification And Evaluation For New Product Ppt Styles Portfolio PDF. This layout presents information on Metrics, Risk, Risk Priority, Risk Management Team. It is also available for immediate download and adjustment. So, changes can be made in the color, design, graphics or any other component to create a unique layout.
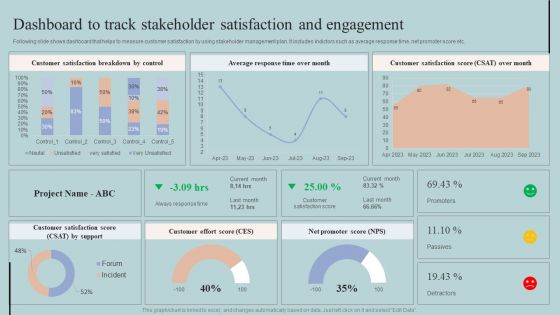
Dashboard To Track Stakeholder Satisfaction And Engagement Rules PDF
Following slide shows dashboard that helps to measure customer satisfaction by using stakeholder management plan. It includes indictors such as average response time, net promoter score etc. Present like a pro with Dashboard To Track Stakeholder Satisfaction And Engagement Rules PDF Create beautiful presentations together with your team, using our easy-to-use presentation slides. Share your ideas in real-time and make changes on the fly by downloading our templates. So whether you are in the office, on the go, or in a remote location, you can stay in sync with your team and present your ideas with confidence. With Slidegeeks presentation got a whole lot easier. Grab these presentations today.
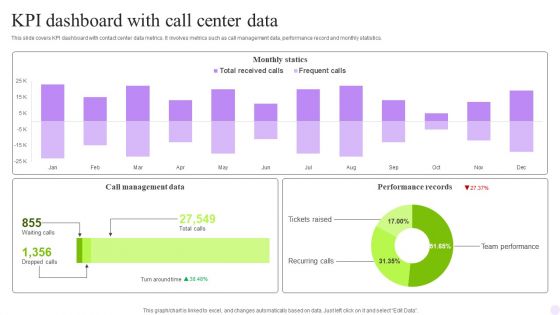
KPI Dashboard With Call Center Data Rules PDF
This slide covers contact center performance metrics KPI dashboard. It involves details such as number of total calls, average answer speed, abandon rate, data of agents performance and call abandon rate by departments. Pitch your topic with ease and precision using this KPI Dashboard With Call Center Data Rules PDF. This layout presents information on Monthly Statics, Management Data, Performance Records. It is also available for immediate download and adjustment. So, changes can be made in the color, design, graphics or any other component to create a unique layout.

Statistics Indicating Impact Of Coaching On Company Performance Formats PDF
This slide delineates statistics indicating impact of coaching on company performance which can be referred by mentors who can assess this data to benchmark their training modules and post coaching effectiveness. It includes information about productivity, quality, business strength, consumer service, less consumer grievances, top level management retention and cost reductions. Pitch your topic with ease and precision using this Statistics Indicating Impact Of Coaching On Company Performance Formats PDF. This layout presents information on Productivity, Quality, Business Strength. It is also available for immediate download and adjustment. So, changes can be made in the color, design, graphics or any other component to create a unique layout.
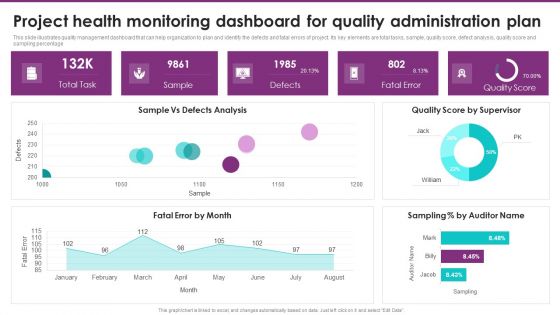
Project Health Monitoring Dashboard For Quality Administration Plan Clipart PDF
This slide illustrates quality management dashboard that can help organization to plan and identify the defects and fatal errors of project. Its key elements are total tasks, sample, quality score, defect analysis, quality score and sampling percentage. Pitch your topic with ease and precision using this Project Health Monitoring Dashboard For Quality Administration Plan Clipart PDF. This layout presents information on Quality Score, Quality Administration Plan, Defects Analysis. It is also available for immediate download and adjustment. So, changes can be made in the color, design, graphics or any other component to create a unique layout.
Hoshin Kanri Strategic Planning System Chart With Measurable Output Ppt PowerPoint Presentation File Icon PDF
This slide describes the strategic planning document. It includes information about the company goals, objectives, key tactics, owners, measurable output and respective recommendations of the same. Pitch your topic with ease and precision using this hoshin kanri strategic planning system chart with measurable output ppt powerpoint presentation file icon pdf. This layout presents information on management level, annual objective, measurable output. It is also available for immediate download and adjustment. So, changes can be made in the color, design, graphics or any other component to create a unique layout.
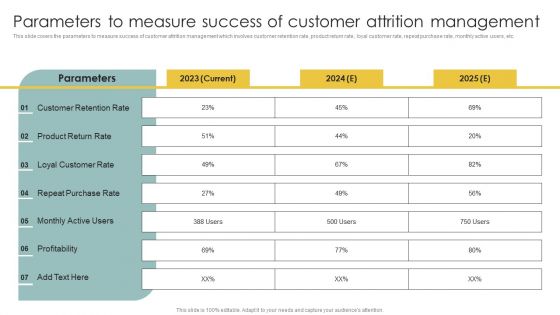
Implementing CRM To Optimize Parameters To Measure Success Of Customer Attrition Guidelines PDF
This slide covers the parameters to measure success of customer attrition management which involves customer retention rate, product return rate, loyal customer rate, repeat purchase rate, monthly active users, etc. If your project calls for a presentation, then Slidegeeks is your go-to partner because we have professionally designed, easy-to-edit templates that are perfect for any presentation. After downloading, you can easily edit Implementing CRM To Optimize Parameters To Measure Success Of Customer Attrition Guidelines PDF and make the changes accordingly. You can rearrange slides or fill them with different images. Check out all the handy templates
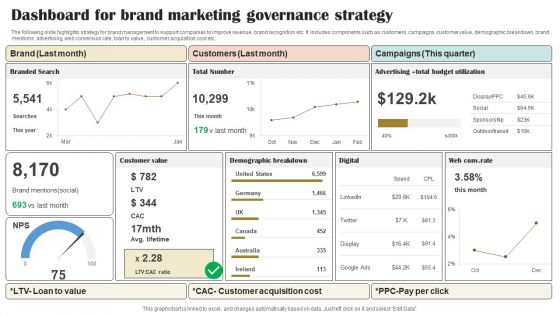
Dashboard For Brand Marketing Governance Strategy Portrait PDF
The following slide highlights strategy for brand management to support companies to improve revenue, brand recognition etc. It includes components such as customers, campaigns, customer value, demographic breakdown, brand mentions, advertising, web conversion rate, loan to value, customer acquisition cost etc. Pitch your topic with ease and precision using this Dashboard For Brand Marketing Governance Strategy Portrait PDF. This layout presents information on Brand, Customers, Campaigns. It is also available for immediate download and adjustment. So, changes can be made in the color, design, graphics or any other component to create a unique layout.
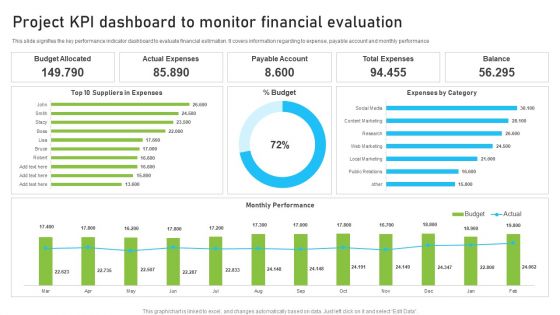
Project KPI Dashboard To Monitor Financial Evaluation Background PDF
This slide signifies the construction project management projection plan. It covers information regarding to the estimate ID, Task, effort hours, resource quantity, performance factor and duration evaluation. Pitch your topic with ease and precision using this Project KPI Dashboard To Monitor Financial Evaluation Background PDF. This layout presents information on Actual Expenses, Payable Account, Budget Allocated. It is also available for immediate download and adjustment. So, changes can be made in the color, design, graphics or any other component to create a unique layout.

 Home
Home