Investment Dashboard

Customer Service KPI Dashboard For Technical Support Ppt Model Vector PDF
This slide covers customer service KPI dashboard for technical support. It involves details such as total number of issues arise daily, overall average response time, number of issues by channel and top performing technical engineers. Pitch your topic with ease and precision using this Customer Service KPI Dashboard For Technical Support Ppt Model Vector PDF. This layout presents information on Overall Average, Response Time, Total Number, Issues Arise Daily. It is also available for immediate download and adjustment. So, changes can be made in the color, design, graphics or any other component to create a unique layout.

Managing Cyber Security Incident Response KPI Dashboard Ppt Layouts Shapes PDF
This slide covers cyber security incident response KPI dashboard. It involves details such as intent alarm, event trend sources, event trend, sensor activity, major operating systems and asset information. Pitch your topic with ease and precision using this Managing Cyber Security Incident Response KPI Dashboard Ppt Layouts Shapes PDF. This layout presents information on Top Alarms Method, Alarms Intent, Timely Event Trend. It is also available for immediate download and adjustment. So, changes can be made in the color, design, graphics or any other component to create a unique layout.

Managing Cyber Security Incident Management KPI Dashboard To Measure Performance Download PDF
This slide covers cyber security incident management KPI dashboard to measure performance. It involves details such as average resolution time, new incidents, incident status, resolved vs unresolved incidents and created vs closed incidents. Showcasing this set of slides titled Managing Cyber Security Incident Management KPI Dashboard To Measure Performance Download PDF. The topics addressed in these templates are Average Resolution Time, Incident Status, New Incidents. All the content presented in this PPT design is completely editable. Download it and make adjustments in color, background, font etc. as per your unique business setting.
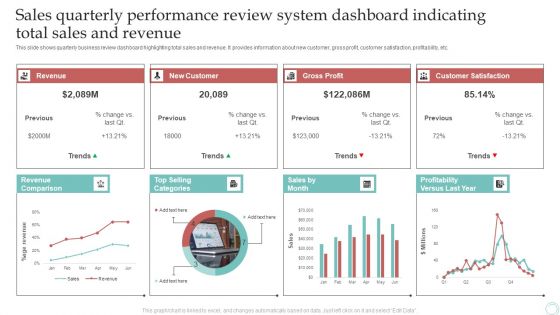
Sales Quarterly Performance Review System Dashboard Indicating Total Sales And Revenue Download PDF
This slide shows quarterly business review dashboard highlighting total sales and revenue. It provides information about new customer, gross profit, customer satisfaction, profitability, etc. Pitch your topic with ease and precision using this Sales Quarterly Performance Review System Dashboard Indicating Total Sales And Revenue Download PDF. This layout presents information on Revenue, New Customer, Gross Profit. It is also available for immediate download and adjustment. So, changes can be made in the color, design, graphics or any other component to create a unique layout.

Business Threats Landscape Dashboard For Cyber Security Program Management Ppt Gallery Images PDF
This slide shows risk landscape dashboard for cyber security program management which contains threat level by month, current threat posture, threats by source, threats by owner, risks by threat and threat register. This can help businesses in effective management of risks and counter measures. Showcasing this set of slides titled Business Threats Landscape Dashboard For Cyber Security Program Management Ppt Gallery Images PDF. The topics addressed in these templates are Current Threat Posture, Threat Register, Source. All the content presented in this PPT design is completely editable. Download it and make adjustments in color, background, font etc. as per your unique business setting.
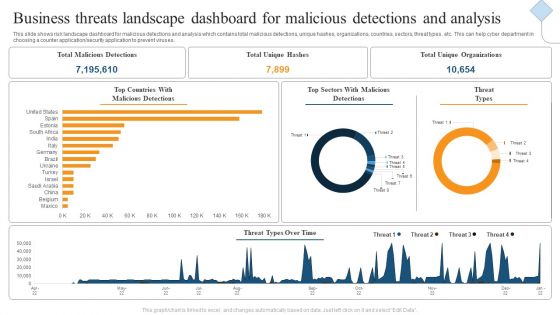
Business Threats Landscape Dashboard For Malicious Detections And Analysis Ppt Gallery Show PDF
This slide shows risk landscape dashboard for malicious detections and analysis which contains total malicious detections, unique hashes, organizations, countries, sectors, threat types, etc. This can help cyber department in choosing a counter application or security application to prevent viruses. Showcasing this set of slides titled Business Threats Landscape Dashboard For Malicious Detections And Analysis Ppt Gallery Show PDF. The topics addressed in these templates are Total Malicious Detections, Total Unique Hashes, Total Unique Organizations. All the content presented in this PPT design is completely editable. Download it and make adjustments in color, background, font etc. as per your unique business setting.

Business Threats Landscape Dashboard With Cyber Attacks Analysis Ppt Summary Brochure PDF
This slide illustrates risk landscape dashboard with cyber attacks analysis which contains malware attack frequency, country wise attacks, top 10 attacks, etc. It can assist IT managers in analyzing top threats so that they can be dealt with proper efficiency. Pitch your topic with ease and precision using this Business Threats Landscape Dashboard With Cyber Attacks Analysis Ppt Summary Brochure PDF. This layout presents information on Malware Attack Frequency, Every Minute, Every Second. It is also available for immediate download and adjustment. So, changes can be made in the color, design, graphics or any other component to create a unique layout.

Change Order Administration Dashboard With Priority Assessment Ppt Portfolio Inspiration PDF
This slide showcases change order management dashboard with priority assessment. It provides information about order stats, summary, latest change orders and priority according to rank. Pitch your topic with ease and precision using this Change Order Administration Dashboard With Priority Assessment Ppt Portfolio Inspiration PDF. This layout presents information on Change Orders Priority, Change Order Stats, Change Orders Summary. It is also available for immediate download and adjustment. So, changes can be made in the color, design, graphics or any other component to create a unique layout.
Performance Tracking Dashboard For 5G Technology Difference Between 4G And 5G Network Introduction PDF
This slide describes the performance tracking dashboard for 5G technology by covering the details of subscribers, qoe, consumption, customer support, coverage, devices, and dimensions.Find a pre-designed and impeccable Performance Tracking Dashboard For 5G Technology Difference Between 4G And 5G Network Introduction PDF. The templates can ace your presentation without additional effort. You can download these easy-to-edit presentation templates to make your presentation stand out from others. So, what are you waiting for Download the template from Slidegeeks today and give a unique touch to your presentation.

IT System Risk Management Guide Enterprise IT Risk Management Reporting Dashboard Formats PDF
This slide highlights the enterprise information technology risk management reporting dashboard which includes risk rating breakdown risk heat map, action plan breakdown and thresholds. From laying roadmaps to briefing everything in detail, our templates are perfect for you. You can set the stage with your presentation slides. All you have to do is download these easy to edit and customizable templates. IT System Risk Management Guide Enterprise IT Risk Management Reporting Dashboard Formats PDF will help you deliver an outstanding performance that everyone would remember and praise you for. Do download this presentation today.

Dashboard To Track Product Sales Performance Implementing Focus Strategy To Improve Designs PDF
This slide showcases dashboard that can help organization to analyse the sales of product after entering into niche market. Its key elements are sales, sales target, sales growth, sales by channel, inventory days outstanding etc.Take your projects to the next level with our ultimate collection of Dashboard To Track Product Sales Performance Implementing Focus Strategy To Improve Designs PDF. Slidegeeks has designed a range of layouts that are perfect for representing task or activity duration, keeping track of all your deadlines at a glance. Tailor these designs to your exact needs and give them a truly corporate look with your own brand colors they all make your projects stand out from the rest.
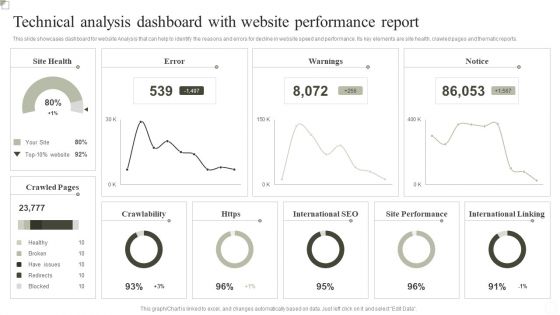
Technical Analysis Dashboard With Website Performance Report Ppt Inspiration Outline PDF
This slide showcases dashboard for website Analysis that can help to identify the reasons and errors for decline in website speed and performance. Its key elements are site health, crawled pages and thematic reports. Showcasing this set of slides titled Technical Analysis Dashboard With Website Performance Report Ppt Inspiration Outline PDF. The topics addressed in these templates are Crawlability, International SEO, Site Performance, International Linking. All the content presented in this PPT design is completely editable. Download it and make adjustments in color, background, font etc. as per your unique business setting.

Automobile Company Actual And Forecasted Monthly Sales Dashboard Ppt Infographic Template Aids PDF
This slide shows the dashboard for forecasting the sales of an automobile company for the current month. It represents details related to revenue by pipeline, new deals, sales forecast, revenue goal attainment by owner for the current month and pipeline coverage by next month. Showcasing this set of slides titled Automobile Company Actual And Forecasted Monthly Sales Dashboard Ppt Infographic Template Aids PDF. The topics addressed in these templates are Forecast Month, Revenue Goal Attainment, Revenue Goal Attainment. All the content presented in this PPT design is completely editable. Download it and make adjustments in color, background, font etc. as per your unique business setting.

Dashboard Of Product Sales Growth And Gross Analysis Analysis Ppt Styles Good PDF
The following slide highlights the dashboard o product sales growth and gross margin analysis illustrating key headings which includes sales by product, sales by month, sales product by margin, sales product by quantity, gross margin growth, gross margin trend and product inventory. Showcasing this set of slides titled Dashboard Of Product Sales Growth And Gross Analysis Analysis Ppt Styles Good PDF. The topics addressed in these templates are Gross Margin Growth, Gross Margin Trend, Product Inventory. All the content presented in this PPT design is completely editable. Download it and make adjustments in color, background, font etc. as per your unique business setting.
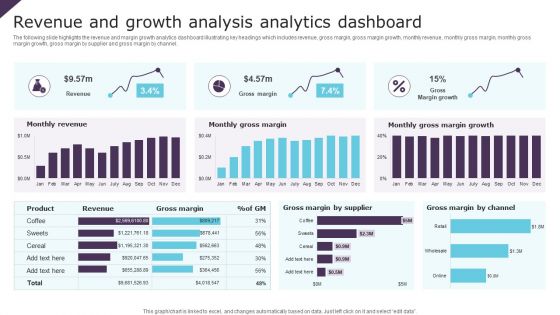
Revenue And Growth Analysis Analytics Dashboard Ppt Infographic Template Brochure PDF
The following slide highlights the revenue and margin growth analytics dashboard illustrating key headings which includes revenue, gross margin, gross margin growth, monthly revenue, monthly gross margin, monthly gross margin growth, gross margin by supplier and gross margin by channel. Pitch your topic with ease and precision using this Revenue And Growth Analysis Analytics Dashboard Ppt Infographic Template Brochure PDF. This layout presents information on Monthly Revenue, Monthly Gross Margin, Gross Margin Growth. It is also available for immediate download and adjustment. So, changes can be made in the color, design, graphics or any other component to create a unique layout.
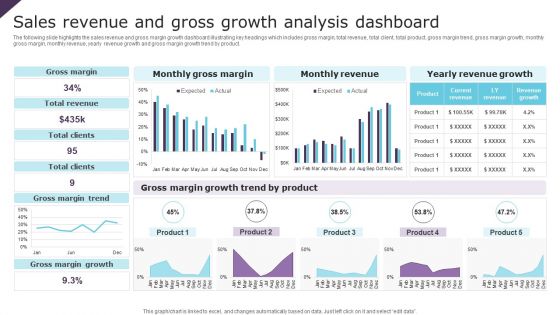
Sales Revenue And Gross Growth Analysis Dashboard Ppt Inspiration Background Image PDF
The following slide highlights the sales revenue and gross margin growth dashboard illustrating key headings which includes gross margin, total revenue, total client, total product, gross margin trend, gross margin growth, monthly gross margin, monthly revenue, yearly revenue growth and gross margin growth trend by product. Showcasing this set of slides titled Sales Revenue And Gross Growth Analysis Dashboard Ppt Inspiration Background Image PDF. The topics addressed in these templates are Gross Margin, Total Revenue, Total Clients. All the content presented in this PPT design is completely editable. Download it and make adjustments in color, background, font etc. as per your unique business setting.
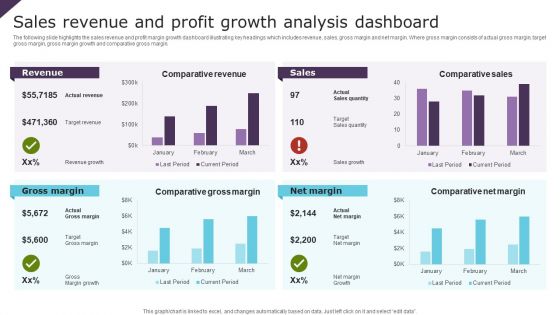
Sales Revenue And Profit Growth Analysis Dashboard Ppt Portfolio Slide PDF
The following slide highlights the sales revenue and profit margin growth dashboard illustrating key headings which includes revenue, sales, gross margin and net margin. Where gross margin consists of actual gross margin, target gross margin, gross margin growth and comparative gross margin. Showcasing this set of slides titled Sales Revenue And Profit Growth Analysis Dashboard Ppt Portfolio Slide PDF. The topics addressed in these templates are Revenue, Sales, Gross Margin, Net Margin. All the content presented in this PPT design is completely editable. Download it and make adjustments in color, background, font etc. as per your unique business setting.

Profit Growth Analysis Dashboard Ppt PowerPoint Presentation File Design Templates PDF
The following slide highlights the profit margin growth analysis dashboard illustrating key headings which includes product category, gross margin, net margin, target profit, product name, quantity, profit by product category, sales by product category and profit margin growth. Showcasing this set of slides titled Profit Growth Analysis Dashboard Ppt PowerPoint Presentation File Design Templates PDF. The topics addressed in these templates are Gross Margin, Net Margin, Target Profit. All the content presented in this PPT design is completely editable. Download it and make adjustments in color, background, font etc. as per your unique business setting.

Network Risks Management And Barriers Dashboard Ppt PowerPoint Presentation Gallery Graphic Tips PDF
This slide represents a dashboard of network risk management. It also includes problem servers , workstations and their status, unmonitored network devices. Pitch your topic with ease and precision using this Network Risks Management And Barriers Dashboard Ppt PowerPoint Presentation Gallery Graphic Tips PDF. This layout presents information on Problem Servers, Server Status, Problem Workstations, Workstation Status. It is also available for immediate download and adjustment. So, changes can be made in the color, design, graphics or any other component to create a unique layout.

Continuous Integration Dashboard For Automated Testing Framework Ppt Layouts Layout Ideas PDF
This slide shows continuous integration dashboard for test automation framework which can be referred by authors to review their testing performance. It contains information about weekly change volume by author, monthly change volume by author, repository, etc. Pitch your topic with ease and precision using this Continuous Integration Dashboard For Automated Testing Framework Ppt Layouts Layout Ideas PDF. This layout presents information on Total Changes Volume, Monthly Change Volume, Weekly Change Volume. It is also available for immediate download and adjustment. So, changes can be made in the color, design, graphics or any other component to create a unique layout.

Automated Testing Framework Dashboard Indicating Reported Issues And Results Ideas PDF
This slide showcase test automation framework dashboard indicating reported issues and results which can benefit IT firms in quick resolution of these problems. It contains information about weekly total, test results and details. It also includes information about passed, known issue, avoided, ended, queued, etc. Showcasing this set of slides titled Automated Testing Framework Dashboard Indicating Reported Issues And Results Ideas PDF. The topics addressed in these templates are Weekly Total, Test Results, Last 7 Days. All the content presented in this PPT design is completely editable. Download it and make adjustments in color, background, font etc. as per your unique business setting.

Customer NPS Metric Dashboard For Call Centers Ppt Inspiration Smartart PDF
This slide shows net promoter score dashboard for call centers which contains occupancy rate, tickets unassigned, opened tickets, completed tickets and raised tickets. It also has details on resolution rate on first call, enquiries, etc. Pitch your topic with ease and precision using this Customer NPS Metric Dashboard For Call Centers Ppt Inspiration Smartart PDF. This layout presents information on Occupancy Rate, Resolution Rate, Net Promoter Score. It is also available for immediate download and adjustment. So, changes can be made in the color, design, graphics or any other component to create a unique layout.

Dashboard Depicting Client And Employee Customer NPS Metric Ppt Gallery Deck PDF
This slide shows dashboard depicting client and employee net promoter score NPS. It contains information about customer refer probability, recent service review and repeated use of service. Showcasing this set of slides titled Dashboard Depicting Client And Employee Customer NPS Metric Ppt Gallery Deck PDF. The topics addressed in these templates are Client NPS, Employee NPS, Customer Probability. All the content presented in this PPT design is completely editable. Download it and make adjustments in color, background, font etc. as per your unique business setting.
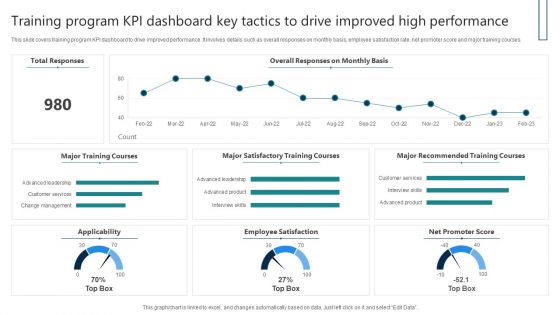
Training Program KPI Dashboard Key Tactics To Drive Improved High Performance Download PDF
This slide covers training program KPI dashboard to drive improved performance. It involves details such as overall responses on monthly basis, employee satisfaction rate, net promoter score and major training courses. Showcasing this set of slides titled Training Program KPI Dashboard Key Tactics To Drive Improved High Performance Download PDF. The topics addressed in these templates are Total Responses, Major Training Courses, Employee Satisfaction. All the content presented in this PPT design is completely editable. Download it and make adjustments in color, background, font etc. as per your unique business setting.
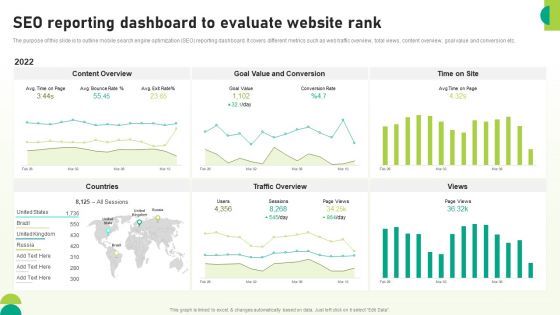
Utilizing SEO To Boost Customer SEO Reporting Dashboard To Evaluate Website Rank Background PDF
The purpose of this slide is to outline mobile search engine optimization SEO reporting dashboard. It covers different metrics such as web traffic overview, total views, content overview, goal value and conversion etc. Take your projects to the next level with our ultimate collection of Utilizing SEO To Boost Customer SEO Reporting Dashboard To Evaluate Website Rank Background PDF. Slidegeeks has designed a range of layouts that are perfect for representing task or activity duration, keeping track of all your deadlines at a glance. Tailor these designs to your exact needs and give them a truly corporate look with your own brand colors theyll make your projects stand out from the rest.

Deploy Merchandise Program To Enhance Sales Dashboard Depicting Sales And Customer Analytics Sample PDF
This slide focuses on dashboard that depicts sales and customer analytics which covers sales revenue, average transaction rate, out of stock items, sales by division, monthly visitors, etc. Make sure to capture your audiences attention in your business displays with our gratis customizable Deploy Merchandise Program To Enhance Sales Dashboard Depicting Sales And Customer Analytics Sample PDF. These are great for business strategies, office conferences, capital raising or task suggestions. If you desire to acquire more customers for your tech business and ensure they stay satisfied, create your own sales presentation with these plain slides.

Kpi Dashboard To Track Applicant Selection Process Ppt PowerPoint Presentation File Graphics Template PDF
This slide shows dashboard which can be used to monitor the progress of recruitment process. It includes metrics such as applications received, shortlisted applicant, selected candidates, etc. Pitch your topic with ease and precision using this Kpi Dashboard To Track Applicant Selection Process Ppt PowerPoint Presentation File Graphics Template PDF. This layout presents information on Applications Received, Shortlisted Candidates, Selected Candidates. It is also available for immediate download and adjustment. So, changes can be made in the color, design, graphics or any other component to create a unique layout.
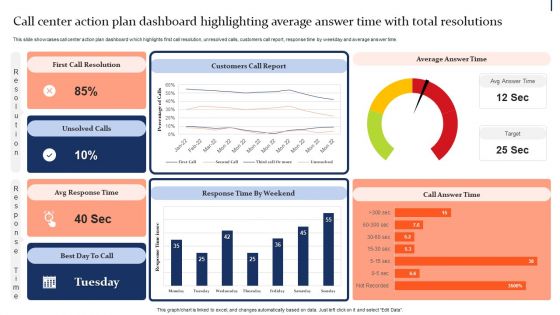
Quality Enhancement Strategic Call Center Action Plan Dashboard Highlighting Average Professional PDF
This slide showcases call center action plan dashboard which highlights first call resolution, unresolved calls, customers call report, response time by weekday and average answer time. From laying roadmaps to briefing everything in detail, our templates are perfect for you. You can set the stage with your presentation slides. All you have to do is download these easy-to-edit and customizable templates. Quality Enhancement Strategic Call Center Action Plan Dashboard Highlighting Average Professional PDF will help you deliver an outstanding performance that everyone would remember and praise you for. Do download this presentation today.
Agile Approaches For IT Team Playbook Agile Project Management Activities Tracking Dashboard Rules PDF
This slide provides information regarding the dashboard which will help team in managing different activities associated to agile projects and keep track on the time, task summary, etc. Find a pre designed and impeccable Agile Approaches For IT Team Playbook Agile Project Management Activities Tracking Dashboard Rules PDF. The templates can ace your presentation without additional effort. You can download these easy to edit presentation templates to make your presentation stand out from others. So, what are you waiting for Download the template from Slidegeeks today and give a unique touch to your presentation.
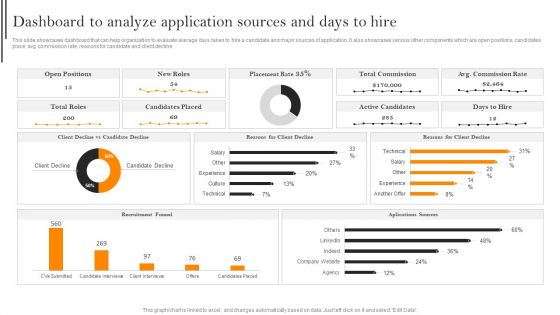
Dashboard To Analyze Application Sources And Days To Hire Template PDF
This slide showcases dashboard that can help organization to evaluate average days taken to hire a candidate and major sources of application. It also showcases various other components which are open positions, candidates place, avg commission rate, reasons for candidate and client decline. Find a pre designed and impeccable Dashboard To Analyze Application Sources And Days To Hire Template PDF. The templates can ace your presentation without additional effort. You can download these easy to edit presentation templates to make your presentation stand out from others. So, what are you waiting for Download the template from Slidegeeks today and give a unique touch to your presentation.
Developing Brand Awareness To Gain Customer Attention Different Brands Performance Tracking Dashboard Introduction PDF
This slide provides information regarding different brands performance tracking dashboard in terms of brand metric, brand commitment, advertising metrics, and purchase metrics. Make sure to capture your audiences attention in your business displays with our gratis customizable Developing Brand Awareness To Gain Customer Attention Different Brands Performance Tracking Dashboard Introduction PDF. These are great for business strategies, office conferences, capital raising or task suggestions. If you desire to acquire more customers for your tech business and ensure they stay satisfied, create your own sales presentation with these plain slides.

Facilities Management Dashboard With Repair Services And Work Orders Mockup PDF
This slide highlights dashboard for facilities management services which includes tasks by work order type, task by status, lobs logged, repair services and priority work orders.Present like a pro with Facilities Management Dashboard With Repair Services And Work Orders Mockup PDF Create beautiful presentations together with your team, using our easy-to-use presentation slides. Share your ideas in real-time and make changes on the fly by downloading our templates. So whether you are in the office, on the go, or in a remote location, you can stay in sync with your team and present your ideas with confidence. With Slidegeeks presentation got a whole lot easier. Grab these presentations today.
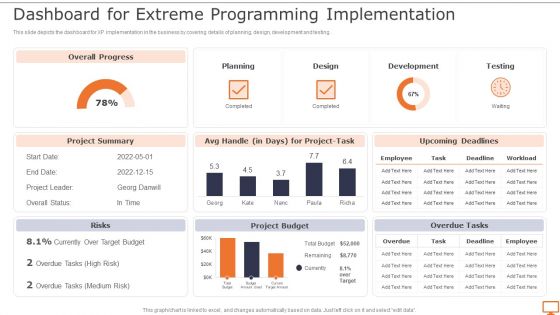
Deploying XP Practices To Enhance Operational Efficiency Dashboard For Extreme Programming Infographics PDF
This slide depicts the dashboard for XP implementation in the business by covering details of planning, design, development and testing. Welcome to our selection of theDeploying XP Practices To Enhance Operational Efficiency Dashboard For Extreme Programming Infographics PDF. These are designed to help you showcase your creativity and bring your sphere to life. Planning and Innovation are essential for any business that is just starting out. This collection contains the designs that you need for your everyday presentations. All of our PowerPoints are 100 Precent editable, so you can customize them to suit your needs. This multi-purpose template can be used in various situations. Grab these presentation templates today.
Reverse Proxy Web Server Dashboard For Reverse Proxy Performance Tracking Elements PDF
This slide represents the dashboard for reverse proxy performance tracking by covering details of CPU load, available memory, and connections. If your project calls for a presentation, then Slidegeeks is your go-to partner because we have professionally designed, easy-to-edit templates that are perfect for any presentation. After downloading, you can easily edit Reverse Proxy Web Server Dashboard For Reverse Proxy Performance Tracking Elements PDF and make the changes accordingly. You can rearrange slides or fill them with different images. Check out all the handy templates

Dashboard To Assess IT Security Awareness Training Program Efficiency Brochure PDF
This slide covers KPI dashboard to assess training program efficiency. It involves details such as overall responses on monthly basis, employee satisfaction rate, net promoter score and major training courses. Pitch your topic with ease and precision using this Dashboard To Assess IT Security Awareness Training Program Efficiency Brochure PDF. This layout presents information on Major Training Course, Major Satisfactory, Training Course. It is also available for immediate download and adjustment. So, changes can be made in the color, design, graphics or any other component to create a unique layout.

IT Security Incident Management Dashboard For Effective Awareness Training Pictures PDF
This slide covers cyber security incident management dashboard for effective awareness training. It involves details such as average resolution time, new incidents, incident status, resolved vs unresolved incidents and created vs closed incidents. Showcasing this set of slides titled IT Security Incident Management Dashboard For Effective Awareness Training Pictures PDF. The topics addressed in these templates are Average Resolution Time, Incident Status, New Incidents. All the content presented in this PPT design is completely editable. Download it and make adjustments in color, background, font etc. as per your unique business setting.
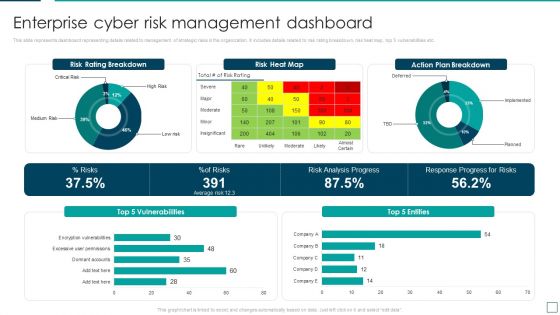
Strategic Risk Management And Mitigation Plan Enterprise Cyber Risk Management Dashboard Diagrams PDF
This slide represents dashboard representing details related to management of strategic risks in the organization. It includes details related to risk rating breakdown, risk heat map, top 5 vulnerabilities etc. From laying roadmaps to briefing everything in detail, our templates are perfect for you. You can set the stage with your presentation slides. All you have to do is download these easy to edit and customizable templates. Strategic Risk Management And Mitigation Plan Enterprise Cyber Risk Management Dashboard Diagrams PDF will help you deliver an outstanding performance that everyone would remember and praise you for. Do download this presentation today.

Metric Dashboard To Measure Product Performance Product Development And Management Plan Demonstration PDF
This slide represents dashboard for tracking product success. It covers new customer, total sessions, purchase, total inquires, total crashes etc.If your project calls for a presentation, then Slidegeeks is your go to partner because we have professionally designed, easy to edit templates that are perfect for any presentation. After downloading, you can easily edit Metric Dashboard To Measure Product Performance Product Development And Management Plan Demonstration PDF and make the changes accordingly. You can rearrange slides or fill them with different images. Check out all the handy templates.
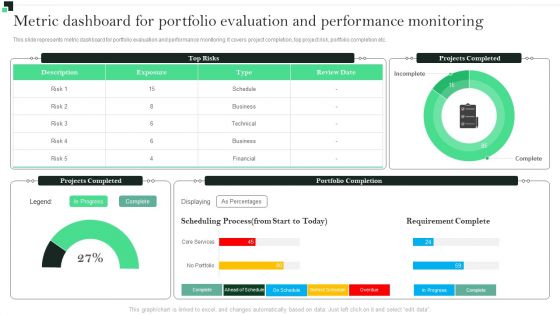
Metric Dashboard For Portfolio Performance Monitoring Strategies To Enhance Portfolio Management Information PDF
This slide represents metric dashboard for portfolio evaluation and performance monitoring. It covers project completion, top project risk, portfolio completion etc.Want to ace your presentation in front of a live audience Our Metric Dashboard For Portfolio Performance Monitoring Strategies To Enhance Portfolio Management Information PDF can help you do that by engaging all the users towards you.. Slidegeeks experts have put their efforts and expertise into creating these impeccable powerpoint presentations so that you can communicate your ideas clearly. Moreover, all the templates are customizable, and easy-to-edit and downloadable. Use these for both personal and commercial use.

Facilities Management Dashboard With Repair Services And Work Orders Background PDF
This slide highlights dashboard for facilities management services which includes tasks by work order type, task by status, lobs logged, repair services and priority work orders. Take your projects to the next level with our ultimate collection of Facilities Management Dashboard With Repair Services And Work Orders Background PDF. Slidegeeks has designed a range of layouts that are perfect for representing task or activity duration, keeping track of all your deadlines at a glance. Tailor these designs to your exact needs and give them a truly corporate look with your own brand colors they will make your projects stand out from the rest.

Dashboard Indicating Online Store Accounts Overview Financial Management Strategies Clipart PDF
The following slide showcases ecommerce accounts management dashboard. It provides information about income, expenses, cash collected, cash spent, tax collected, tax claim, stock sold, invoice, etc.From laying roadmaps to briefing everything in detail, our templates are perfect for you. You can set the stage with your presentation slides. All you have to do is download these easy-to-edit and customizable templates. Dashboard Indicating Online Store Accounts Overview Financial Management Strategies Clipart PDF will help you deliver an outstanding performance that everyone would remember and praise you for. Do download this presentation today.
Corporate Financial Performance Tracking Dashboard Ppt PowerPoint Presentation File Pictures PDF
This slide provides information regarding dashboard utilized by firm to monitor financial performance. The performance is tracked through revenues generated, vendors associated, profit generated, etc. Find a pre designed and impeccable Corporate Financial Performance Tracking Dashboard Ppt PowerPoint Presentation File Pictures PDF. The templates can ace your presentation without additional effort. You can download these easy to edit presentation templates to make your presentation stand out from others. So, what are you waiting for Download the template from Slidegeeks today and give a unique touch to your presentation.
Construction Project Instructions Playbook Ongoing Construction Project Progress Tracking Dashboard Infographics PDF
This slide provides information regarding ongoing construction project progress tracking dashboard along with details such as project status, project type, project progress, etc. This modern and well arranged Construction Project Instructions Playbook Ongoing Construction Project Progress Tracking Dashboard Infographics PDF provides lots of creative possibilities. It is very simple to customize and edit with the Powerpoint Software. Just drag and drop your pictures into the shapes. All facets of this template can be edited with Powerpoint no extra software is necessary. Add your own material, put your images in the places assigned for them, adjust the colors, and then you can show your slides to the world, with an animated slide included.
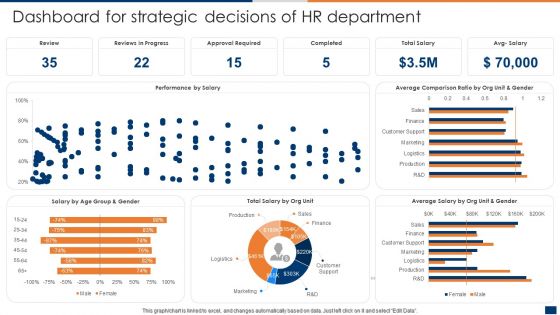
Dashboard For Strategic Decisions Of HR Department Ppt PowerPoint Presentation File Example File PDF
Crafting an eye catching presentation has never been more straightforward. Let your presentation shine with this tasteful yet straightforward Dashboard For Strategic Decisions Of HR Department Ppt PowerPoint Presentation File Example File PDF template. It offers a minimalistic and classy look that is great for making a statement. The colors have been employed intelligently to add a bit of playfulness while still remaining professional. Construct the ideal Dashboard For Strategic Decisions Of HR Department Ppt PowerPoint Presentation File Example File PDF that effortlessly grabs the attention of your audience Begin now and be certain to wow your customers.
Process Enhancement Plan To Boost Sales Performance Website Performance Tracking And Monitoring Dashboard Diagrams PDF
The following slide showcases a dashboard to track and measure website performance. It includes key elements such as visits, average session duration, bounce rate, page views, goal conversion, visits by week, traffic sources, top channels by conversions, etc. From laying roadmaps to briefing everything in detail, our templates are perfect for you. You can set the stage with your presentation slides. All you have to do is download these easy to edit and customizable templates. Process Enhancement Plan To Boost Sales Performance Website Performance Tracking And Monitoring Dashboard Diagrams PDF will help you deliver an outstanding performance that everyone would remember and praise you for. Do download this presentation today.
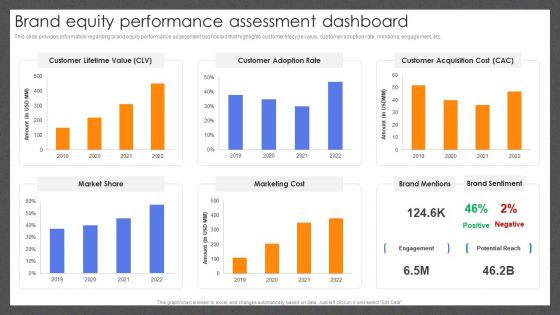
Guide For Effective Brand Brand Equity Performance Assessment Dashboard Diagrams PDF
This slide provides information regarding brand equity performance assessment dashboard that highlights customer lifecycle value, customer adoption rate, mentions, engagement, etc. Present like a pro with Guide For Effective Brand Brand Equity Performance Assessment Dashboard Diagrams PDF Create beautiful presentations together with your team, using our easy-to-use presentation slides. Share your ideas in real-time and make changes on the fly by downloading our templates. So whether youre in the office, on the go, or in a remote location, you can stay in sync with your team and present your ideas with confidence. With Slidegeeks presentation got a whole lot easier. Grab these presentations today.
Guide For Effective Brand Customer Tracking Dashboard To Monitor Brand Loyalty Sample PDF
This slide provides information brand loyalty tracking dashboard in order to monitor customer engagement, average revenues, new vs. returning visitors performance, etc. This modern and well-arranged Guide For Effective Brand Customer Tracking Dashboard To Monitor Brand Loyalty Sample PDF provides lots of creative possibilities. It is very simple to customize and edit with the Powerpoint Software. Just drag and drop your pictures into the shapes. All facets of this template can be edited with Powerpoint, no extra software is necessary. Add your own material, put your images in the places assigned for them, adjust the colors, and then you can show your slides to the world, with an animated slide included.

Guide For Effective Brand Performance Monitoring Dashboard To Track Brand Progress Ideas PDF
This slide provides information regarding monitoring dashboard to track brand performance through monitoring of session, new users, bounce rate, etc. Want to ace your presentation in front of a live audience Our Guide For Effective Brand Performance Monitoring Dashboard To Track Brand Progress Ideas PDF can help you do that by engaging all the users towards you. Slidegeeks experts have put their efforts and expertise into creating these impeccable powerpoint presentations so that you can communicate your ideas clearly. Moreover, all the templates are customizable, and easy-to-edit and downloadable. Use these for both personal and commercial use.
Guide For Effective Brand Rebranding Performance Tracking Dashboard To Track Microsoft PDF
This slide provides information regarding rebranding performance tracking dashboard in order to track renewed brand. It includes details about total spent, total link clicks, total conversations, etc. From laying roadmaps to briefing everything in detail, our templates are perfect for you. You can set the stage with your presentation slides. All you have to do is download these easy-to-edit and customizable templates. Guide For Effective Brand Rebranding Performance Tracking Dashboard To Track Microsoft PDF will help you deliver an outstanding performance that everyone would remember and praise you for. Do download this presentation today.
Efficient Administration Of Product Business And Umbrella Branding Product Branding Performance Tracking Dashboard Background PDF
This slide provides information regarding product branding performance tracking dashboard in terms of revenues, new customers, customer satisfaction rate. Make sure to capture your audiences attention in your business displays with our gratis customizable Efficient Administration Of Product Business And Umbrella Branding Product Branding Performance Tracking Dashboard Background PDF. These are great for business strategies, office conferences, capital raising or task suggestions. If you desire to acquire more customers for your tech business and ensure they stay satisfied, create your own sales presentation with these plain slides.
Essential Retail Store Activities Tracking Dashboard Customer Engagement Administration Infographics PDF
This slide provides details regarding the dashboard for tracking retail store activities in terms of sales, conversion rate, traffic, average transaction value, recommendations, etc. This modern and well-arranged Essential Retail Store Activities Tracking Dashboard Customer Engagement Administration Infographics PDF provides lots of creative possibilities. It is very simple to customize and edit with the Powerpoint Software. Just drag and drop your pictures into the shapes. All facets of this template can be edited with Powerpoint no extra software is necessary. Add your own material, put your images in the places assigned for them, adjust the colors, and then you can show your slides to the world, with an animated slide included.

Brand Awareness Strategy Dashboard To Track Website Traffic After Brand Awareness Rules PDF
This slide showcases dashboard that can help organization to track the website traffic after running online brand awareness marketing campaigns. Its key components are new visitors, traffic by source, traffic by lead source, customers wins by lead source and bounce rate. From laying roadmaps to briefing everything in detail, our templates are perfect for you. You can set the stage with your presentation slides. All you have to do is download these easy-to-edit and customizable templates. Brand Awareness Strategy Dashboard To Track Website Traffic After Brand Awareness Rules PDF will help you deliver an outstanding performance that everyone would remember and praise you for. Do download this presentation today.
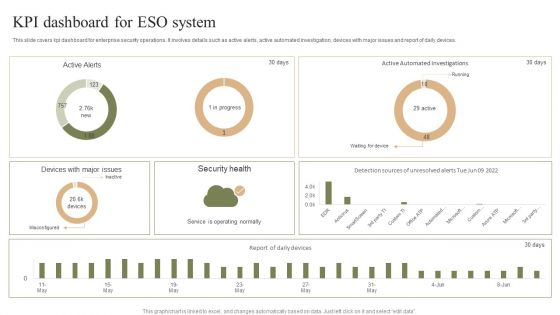
KPI Dashboard For ESO System Ppt PowerPoint Presentation File Template PDF
This slide covers kpi dashboard for enterprise security operations. It involves details such as active alerts, active automated investigation, devices with major issues and report of daily devices. Pitch your topic with ease and precision using this KPI Dashboard For ESO System Ppt PowerPoint Presentation File Template PDF. This layout presents information on Security Health, Misconfigured, Service Operating Normally. It is also available for immediate download and adjustment. So, changes can be made in the color, design, graphics or any other component to create a unique layout.

ESO System Incident Management KPI Dashboard Ppt PowerPoint Presentation File Graphic Images PDF
This slide covers enterprise security operation incident management kpi dashboard. It involves details such as average resolution time, new incidents, incident status and new incidents by category. Pitch your topic with ease and precision using this ESO System Incident Management KPI Dashboard Ppt PowerPoint Presentation File Graphic Images PDF. This layout presents information on Average Resolution Time, Incident Status, New Incidents. It is also available for immediate download and adjustment. So, changes can be made in the color, design, graphics or any other component to create a unique layout.
Issues Tracking Dashboard For Organizational Building Management Ppt Infographics Topics PDF
This slide showcases dashboard which can help organization to keep track of issues plus faults during facility management and rectify them within stipulated time. Its key elements are issues reported, fault tracking, etc. Pitch your topic with ease and precision using this Issues Tracking Dashboard For Organizational Building Management Ppt Infographics Topics PDF. This layout presents information on Fault Tracking, Issues Reported, Location. It is also available for immediate download and adjustment. So, changes can be made in the color, design, graphics or any other component to create a unique layout.
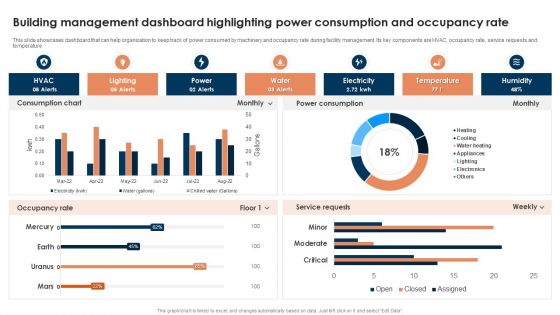
Building Management Dashboard Highlighting Power Consumption And Occupancy Rate Template PDF
This slide showcases dashboard that can help organization to keep track of power consumed by machinery and occupancy rate during facility management. Its key components are HVAC, occupancy rate, service requests and temperature. Pitch your topic with ease and precision using this Building Management Dashboard Highlighting Power Consumption And Occupancy Rate Template PDF. This layout presents information on Lighting, Power, Water, Electricity, Temperature. It is also available for immediate download and adjustment. So, changes can be made in the color, design, graphics or any other component to create a unique layout.

Social Media Marketing Dashboard To Measure Integrated Marketing Communication Performance Clipart PDF
This slide covers online marketing dashboard to improve sales. It involves details such as web performance, conversion funnel, revenue this month, traffic sources and number of followers on social media. Pitch your topic with ease and precision using this Social Media Marketing Dashboard To Measure Integrated Marketing Communication Performance Clipart PDF. This layout presents information on Web Performance, Email List Performance, Followers Social Media. It is also available for immediate download and adjustment. So, changes can be made in the color, design, graphics or any other component to create a unique layout.
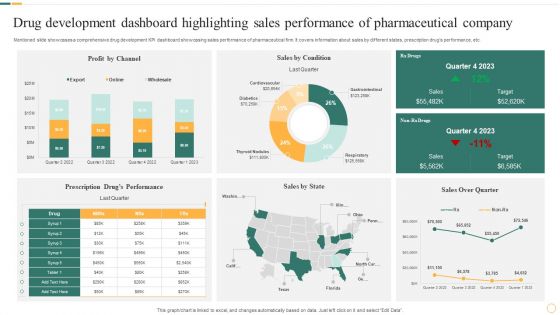
Drug Development Dashboard Highlighting Sales Performance Of Pharmaceutical Company Microsoft PDF
Mentioned slide showcases a comprehensive drug development KPI dashboard showcasing sales performance of pharmaceutical firm. It covers information about sales by different states, prescription drugs performance, etc. Pitch your topic with ease and precision using this Drug Development Dashboard Highlighting Sales Performance Of Pharmaceutical Company Microsoft PDF. This layout presents information on Sales By Condition, Profit By Channel, Sales By State. It is also available for immediate download and adjustment. So, changes can be made in the color, design, graphics or any other component to create a unique layout.
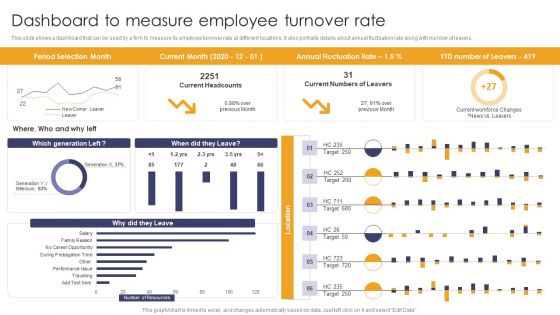
Implementing Succession Planning Dashboard To Measure Employee Turnover Rate Mockup PDF
This slide shows a dashboard that can be used by a firm to measure its employee turnover rate at different locations. It also portraits details about annual fluctuation rate along with number of leavers. There are so many reasons you need a Implementing Succession Planning Dashboard To Measure Employee Turnover Rate Mockup PDF. The first reason is you cant spend time making everything from scratch, Thus, Slidegeeks has made presentation templates for you too. You can easily download these templates from our website easily.
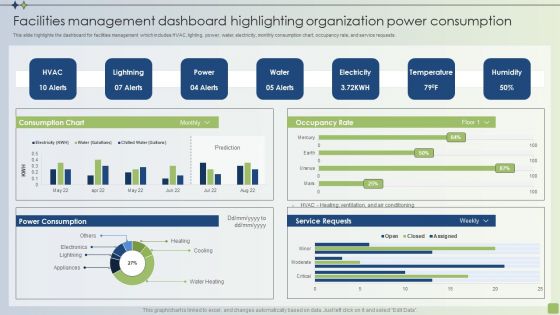
Strategic FM Services Facilities Management Dashboard Highlighting Organization Power Consumption Brochure PDF
This slide highlights the dashboard for facilities management which includes HVAC, lighting, power, water, electricity, monthly consumption chart, occupancy rate, and service requests. Make sure to capture your audiences attention in your business displays with our gratis customizable Strategic FM Services Facilities Management Dashboard Highlighting Organization Power Consumption Brochure PDF. These are great for business strategies, office conferences, capital raising or task suggestions. If you desire to acquire more customers for your tech business and ensure they stay satisfied, create your own sales presentation with these plain slides.

 Home
Home