Investment Dashboard
Implementing CRM To Optimize Dashboard Depicting Customer Retention Analytics Icons PDF
This slide shows the dashboard that depicts customer retention analytics which includes net promoter score, customer loyalty rate, customer lifetime value, customer and revenue churn, monthly recurring revenue growth, etc. Slidegeeks is one of the best resources for PowerPoint templates. You can download easily and regulate Implementing CRM To Optimize Dashboard Depicting Customer Retention Analytics Icons PDF for your personal presentations from our wonderful collection. A few clicks is all it takes to discover and get the most relevant and appropriate templates. Use our Templates to add a unique zing and appeal to your presentation and meetings. All the slides are easy to edit and you can use them even for advertisement purposes.

Dashboard To Track Essential Activities Associated With IT Department Brochure PDF
This slide provides information regarding dashboard to monitor critical activities related to IT in terms of incident tracker, outage report, IT spend per employee, application trends, etc. Slidegeeks is one of the best resources for PowerPoint templates. You can download easily and regulate Dashboard To Track Essential Activities Associated With IT Department Brochure PDF for your personal presentations from our wonderful collection. A few clicks is all it takes to discover and get the most relevant and appropriate templates. Use our Templates to add a unique zing and appeal to your presentation and meetings. All the slides are easy to edit and you can use them even for advertisement purposes.
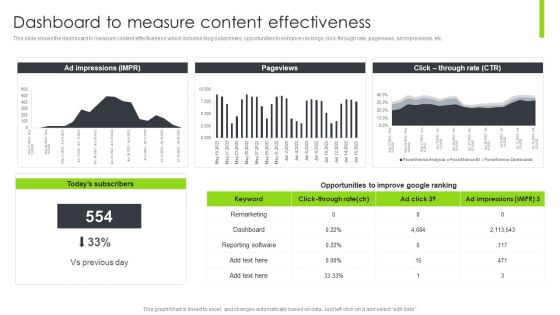
Optimizing Content Marketing Strategies To Enhance Conversion Rate Dashboard To Measure Content Effectiveness Elements PDF
This slide shows the dashboard to measure content effectiveness which includes blog subscribers, opportunities to enhance rankings, click-through rate, pageviews, ad impressions, etc. Slidegeeks is one of the best resources for PowerPoint templates. You can download easily and regulate Optimizing Content Marketing Strategies To Enhance Conversion Rate Dashboard To Measure Content Effectiveness Elements PDF for your personal presentations from our wonderful collection. A few clicks is all it takes to discover and get the most relevant and appropriate templates. Use our Templates to add a unique zing and appeal to your presentation and meetings. All the slides are easy to edit and you can use them even for advertisement purposes.
Performance Tracking Dashboard For 5G Architecture 5G Network Functional Architecture Mockup PDF
This slide describes the performance tracking dashboard for 5G architecture by covering the details of subscribers, quality of experience, consumption, customer support, coverage, devices, and dimensions.The best PPT templates are a great way to save time, energy, and resources. Slidegeeks have 100precent editable powerpoint slides making them incredibly versatile. With these quality presentation templates, you can create a captivating and memorable presentation by combining visually appealing slides and effectively communicating your message. Download Performance Tracking Dashboard For 5G Architecture 5G Network Functional Architecture Mockup PDF from Slidegeeks and deliver a wonderful presentation.
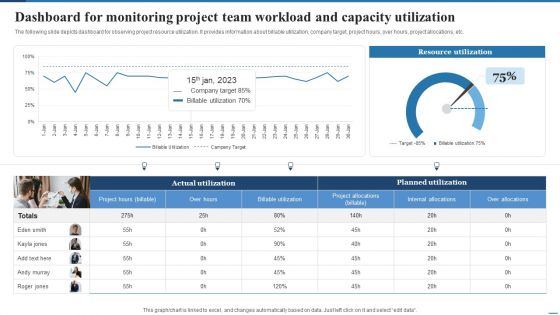
Dashboard For Monitoring Project Team Workload And Capacity Utilization Background PDF
The following slide depicts dashboard for observing project resource utilization. It provides information about billable utilization, company target, project hours, over hours, project allocations, etc.Present like a pro with Dashboard For Monitoring Project Team Workload And Capacity Utilization Background PDF Create beautiful presentations together with your team, using our easy-to-use presentation slides. Share your ideas in real-time and make changes on the fly by downloading our templates. So whether you are in the office, on the go, or in a remote location, you can stay in sync with your team and present your ideas with confidence. With Slidegeeks presentation got a whole lot easier. Grab these presentations today.

Digital Marketing Plan For Restaurant Business Food And Beverages Revenue Analysis Dashboard Template PDF
This slide showcases dashboard that can help restaurant keep track of revenue generated from food and beverages. Its key elements are revenue by location, top expenses, revenue by type etc.The best PPT templates are a great way to save time, energy, and resources. Slidegeeks have 100precent editable powerpoint slides making them incredibly versatile. With these quality presentation templates, you can create a captivating and memorable presentation by combining visually appealing slides and effectively communicating your message. Download Digital Marketing Plan For Restaurant Business Food And Beverages Revenue Analysis Dashboard Template PDF from Slidegeeks and deliver a wonderful presentation.
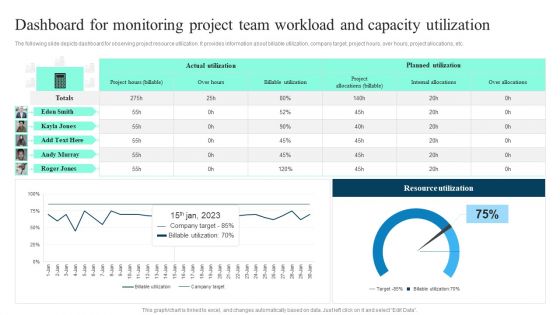
Dashboard For Monitoring Project Team Workload And Capacity Utilization Topics PDF
The following slide depicts dashboard for observing project resource utilization. It provides information about billable utilization, company target, project hours, over hours, project allocations, etc. Take your projects to the next level with our ultimate collection of Dashboard For Monitoring Project Team Workload And Capacity Utilization Topics PDF. Slidegeeks has designed a range of layouts that are perfect for representing task or activity duration, keeping track of all your deadlines at a glance. Tailor these designs to your exact needs and give them a truly corporate look with your own brand colors they will make your projects stand out from the rest.
Brand Awareness Activities Tracking Dashboard Comprehensive Guide For Brand Recognition Download PDF
This slide provides information regarding brand activities tracking dashboard in terms of site traffic, attention, search, brand mentions, inbound traffic, etc. Slidegeeks is one of the best resources for PowerPoint templates. You can download easily and regulate Brand Awareness Activities Tracking Dashboard Comprehensive Guide For Brand Recognition Download PDF for your personal presentations from our wonderful collection. A few clicks is all it takes to discover and get the most relevant and appropriate templates. Use our Templates to add a unique zing and appeal to your presentation and meetings. All the slides are easy to edit and you can use them even for advertisement purposes.

Strategies To Enhance Call Center Management Call Center Action Plan Dashboard Introduction PDF
This slide showcases call center action plan dashboard which highlights first call resolution, unresolved calls, customers call report, response time by weekday and average answer time. The best PPT templates are a great way to save time, energy, and resources. Slidegeeks have 100 percent editable powerpoint slides making them incredibly versatile. With these quality presentation templates, you can create a captivating and memorable presentation by combining visually appealing slides and effectively communicating your message. Download Strategies To Enhance Call Center Management Call Center Action Plan Dashboard Introduction PDF from Slidegeeks and deliver a wonderful presentation.

Core Components Of Strategic Brand Administration Performance Monitoring Dashboard Sample PDF
This slide provides information regarding monitoring dashboard to track brand performance through monitoring of session, new users, bounce rate, etc. Slidegeeks is one of the best resources for PowerPoint templates. You can download easily and regulate Core Components Of Strategic Brand Administration Performance Monitoring Dashboard Sample PDF for your personal presentations from our wonderful collection. A few clicks is all it takes to discover and get the most relevant and appropriate templates. Use our Templates to add a unique zing and appeal to your presentation and meetings. All the slides are easy to edit and you can use them even for advertisement purposes.
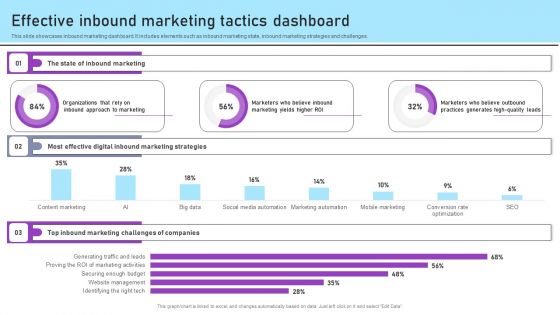
Inbound And Outbound Marketing Tactics Effective Inbound Marketing Tactics Dashboard Background PDF
This slide showcases inbound marketing dashboard. It includes elements such as inbound marketing state, inbound marketing strategies and challenges. Slidegeeks is one of the best resources for PowerPoint templates. You can download easily and regulate Inbound And Outbound Marketing Tactics Effective Inbound Marketing Tactics Dashboard Background PDF for your personal presentations from our wonderful collection. A few clicks is all it takes to discover and get the most relevant and appropriate templates. Use our Templates to add a unique zing and appeal to your presentation and meetings. All the slides are easy to edit and you can use them even for advertisement purposes.

Techniques For Effective Supply Chain Management Dashboard To Analyze Impact Warehouse Management Background PDF
This slide covers KPI dashboard to assess performance of supply chain after implementing effective logistics strategies. It involves details such as delivery status, number of shipments and average delivery time. The best PPT templates are a great way to save time, energy, and resources. Slidegeeks have 100 percent editable powerpoint slides making them incredibly versatile. With these quality presentation templates, you can create a captivating and memorable presentation by combining visually appealing slides and effectively communicating your message. Download Techniques For Effective Supply Chain Management Dashboard To Analyze Impact Warehouse Management Portrait PDF from Slidegeeks and deliver a wonderful presentation.
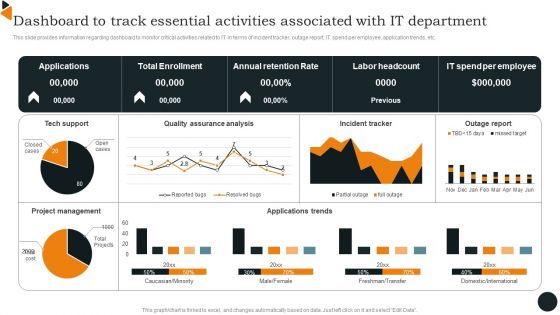
Dashboard To Track Essential Activities Associated With IT Department Demonstration PDF
This slide provides information regarding dashboard to monitor critical activities related to IT in terms of incident tracker, outage report, IT spend per employee, application trends, etc. Slidegeeks is one of the best resources for PowerPoint templates. You can download easily and regulate Dashboard To Track Essential Activities Associated With IT Department Demonstration PDF for your personal presentations from our wonderful collection. A few clicks is all it takes to discover and get the most relevant and appropriate templates. Use our Templates to add a unique zing and appeal to your presentation and meetings. All the slides are easy to edit and you can use them even for advertisement purposes.
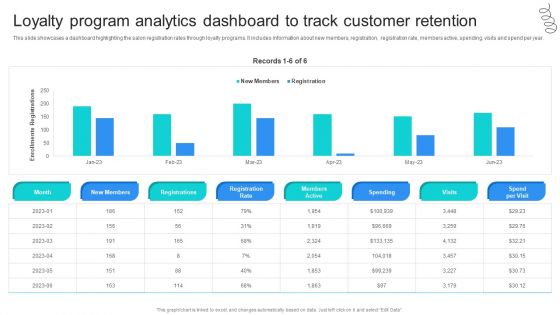
Strategic Marketing For Hair And Beauty Salon To Increase Loyalty Program Analytics Dashboard Clipart PDF
This slide showcases a dashboard highlighting the salon registration rates through loyalty programs. It includes information about new members, registration, registration rate, members active, spending, visits and spend per year. The best PPT templates are a great way to save time, energy, and resources. Slidegeeks have 100 percent editable powerpoint slides making them incredibly versatile. With these quality presentation templates, you can create a captivating and memorable presentation by combining visually appealing slides and effectively communicating your message. Download Strategic Marketing For Hair And Beauty Salon To Increase Loyalty Program Analytics Dashboard Clipart PDF from Slidegeeks and deliver a wonderful presentation.
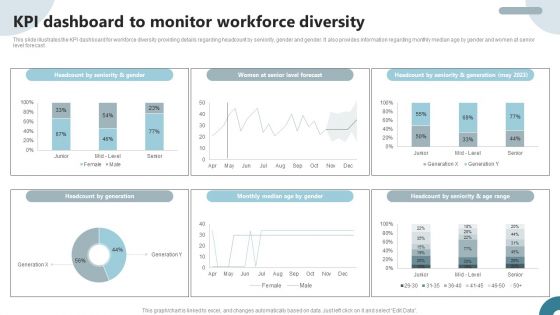
Strategies To Deploy Diversity In Workplace KPI Dashboard To Monitor Workforce Diversity Infographics PDF
This slide illustrates the KPI dashboard for workforce diversity providing details regarding headcount by seniority, gender and gender. It also provides information regarding monthly median age by gender and women at senior level forecast. Crafting an eye-catching presentation has never been more straightforward. Let your presentation shine with this tasteful yet straightforward Strategies To Deploy Diversity In Workplace KPI Dashboard To Monitor Workforce Diversity Infographics PDF template. It offers a minimalistic and classy look that is great for making a statement. The colors have been employed intelligently to add a bit of playfulness while still remaining professional. Construct the ideal Strategies To Deploy Diversity In Workplace KPI Dashboard To Monitor Workforce Diversity Infographics PDF that effortlessly grabs the attention of your audience Begin now and be certain to wow your customers.

KPI Dashboard To Track Risk Events Ppt Infographic Template Layout Ideas PDF
This slide displays KPI dashboard that can be used by a firm to track multiple risk events. Metrics covered in the dashboard are residual risks by period and risk category by total risk rating. Are you in need of a template that can accommodate all of your creative concepts This one is crafted professionally and can be altered to fit any style. Use it with Google Slides or PowerPoint. Include striking photographs, symbols, depictions, and other visuals. Fill, move around, or remove text boxes as desired. Test out color palettes and font mixtures. Edit and save your work, or work with colleagues. Download KPI Dashboard To Track Risk Events Ppt Infographic Template Layout Ideas PDF and observe how to make your presentation outstanding. Give an impeccable presentation to your group and make your presentation unforgettable.

Integrating Data Privacy System Risk Evaluation Dashboard For Data Privacy Guidelines PDF
This slide depicts the risk evaluation dashboard for data privacy based on audits with open findings, GDPR processing per region, control and measure trends, average response time. Do you have to make sure that everyone on your team knows about any specific topic I yes, then you should give Integrating Data Privacy System Risk Evaluation Dashboard For Data Privacy Guidelines PDF a try. Our experts have put a lot of knowledge and effort into creating this impeccable Integrating Data Privacy System Risk Evaluation Dashboard For Data Privacy Guidelines PDF. You can use this template for your upcoming presentations, as the slides are perfect to represent even the tiniest detail. You can download these templates from the Slidegeeks website and these are easy to edit. So grab these today.

Tourism And Hospitality Industry Hospitality Management KPI Dashboard Average Fixed Infographics PDF
Deliver an awe inspiring pitch with this creative tourism and hospitality industry hospitality management kpi dashboard average fixed infographics pdf bundle. Topics like average direct costs per seat, average fixed costs per seat, average serving time, average total costs per table can be discussed with this completely editable template. It is available for immediate download depending on the needs and requirements of the user.

Business To Business Social Dashboard To Track Social Media Marketing Campaign Metrics Microsoft PDF
This slide showcases dashboard that can help organization to track the metrics of social media marketing campaign. Its key components are followers, post reach, page impressions, visitors, avg engagement and lifetime views. Here you can discover an assortment of the finest PowerPoint and Google Slides templates. With these templates, you can create presentations for a variety of purposes while simultaneously providing your audience with an eye-catching visual experience. Download Business To Business Social Dashboard To Track Social Media Marketing Campaign Metrics Microsoft PDF to deliver an impeccable presentation. These templates will make your job of preparing presentations much quicker, yet still, maintain a high level of quality. Slidegeeks has experienced researchers who prepare these templates and write high-quality content for you. Later on, you can personalize the content by editing the Business To Business Social Dashboard To Track Social Media Marketing Campaign Metrics Microsoft PDF.

Ecommerce Website Performance Overview Dashboard Deploying Ecommerce Order Management Infographics PDF
This slide represents the dashboard to analyze and monitor the performance of ecommerce website. It includes key metrics such as transactions, revenue, users and sessions, ecommerce rate, revenue by channels etc.If you are looking for a format to display your unique thoughts, then the professionally designed Ecommerce Website Performance Overview Dashboard Deploying Ecommerce Order Management Infographics PDF is the one for you. You can use it as a Google Slides template or a PowerPoint template. Incorporate impressive visuals, symbols, images, and other charts. Modify or reorganize the text boxes as you desire. Experiment with shade schemes and font pairings. Alter, share or cooperate with other people on your work. Download Ecommerce Website Performance Overview Dashboard Deploying Ecommerce Order Management Infographics PDF and find out how to give a successful presentation. Present a perfect display to your team and make your presentation unforgettable.
Customer Relationship Strategy For Building Loyalty Business Revenue Dashboard Icons PDF
This slide highlights business dashboard with multiple statistics to estimate the revenue and profitability of company as a result of new customer intimacy strategy. Deliver an awe inspiring pitch with this creative customer relationship strategy for building loyalty business revenue dashboard icons pdf bundle. Topics like average revenue per customer, compared to previous year, customer acquisition cost, cac vs customer lifetime value, revenue can be discussed with this completely editable template. It is available for immediate download depending on the needs and requirements of the user.

Risk Analysis Strategies For Real Estate Construction Project Vendor Supplier Analysis Dashboard Sample PDF
Here in this slide we include Dashboard covering supplier order value, defect rate, and quality score for making decisions regarding supplier selection. Deliver an awe inspiring pitch with this creative risk analysis strategies for real estate construction project vendor supplier analysis dashboard sample pdf bundle. Topics like value ordered, value rejected, vendor rejection rate, return to vendor costs, emergency purchase ratio, spend under management can be discussed with this completely editable template. It is available for immediate download depending on the needs and requirements of the user.
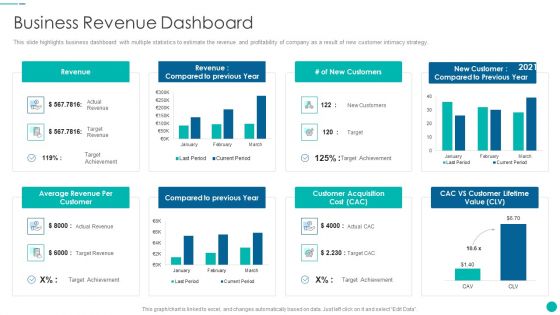
Tactical Procedure For Increasing Customer Intimacy Business Revenue Dashboard Diagrams PDF
This slide highlights business dashboard with multiple statistics to estimate the revenue and profitability of company as a result of new customer intimacy strategy. Deliver an awe inspiring pitch with this creative tactical procedure for increasing customer intimacy business revenue dashboard diagrams pdf bundle. Topics like average revenue per customer, compared to previous year, customer acquisition cost, cac vs customer lifetime value, revenue can be discussed with this completely editable template. It is available for immediate download depending on the needs and requirements of the user.
Improvising Hiring Process Essential Activities In Recruitment Process Tracking Dashboard Seniority Designs PDF
This slide provides information regarding tracking of essential activities associated to recruitment process and presented in dashboard. Deliver an awe inspiring pitch with this creative improvising hiring process essential activities in recruitment process tracking dashboard seniority designs pdf bundle. Topics like recruitment conversion rate, avg cost of hiring by seniority level, recruiting funnel, avg time to fill by department, turnover rate by age group year can be discussed with this completely editable template. It is available for immediate download depending on the needs and requirements of the user.

Performance Analysis Of New Product Development Product Performance Dashboard Download PDF
The following slide displays the product performance dashboard as it highlights the top product by revenue, online vs. in store purchase, the sales by campaign. Deliver an awe inspiring pitch with this creative performance analysis of new product development product performance dashboard download pdf bundle. Topics like top products in revenue, sales by campaign, cost of goods sold, store vs online purchase can be discussed with this completely editable template. It is available for immediate download depending on the needs and requirements of the user.

Incident And Issue Management Procedure Dashboard For Managing Project Issues In The Organization Designs PDF
This slide provides the glimpse about the KPI for managing project issues in the organization wherein focus is on project health, tasks, progress, time, cost and workload. Deliver and pitch your topic in the best possible manner with this incident and issue management procedure dashboard for managing project issues in the organization designs pdf. Use them to share invaluable insights on dashboard for managing project issues in the organization and impress your audience. This template can be altered and modified as per your expectations. So, grab it now.

Sustainability Calculation With KPI Customer Service Dashboard Revenue Ideas PDF Graphics PDF
Following slide illustrates customer service dashboard covering details such as request answered, total requests, total revenue and support cost revenue. It also includes customer satisfaction score, customer retention in a 12 months format. Deliver and pitch your topic in the best possible manner with this sustainability calculation with kpi customer service dashboard microsoft pdf. Use them to share invaluable insights on customer satisfaction, revenue, customer retention and impress your audience. This template can be altered and modified as per your expectations. So, grab it now.
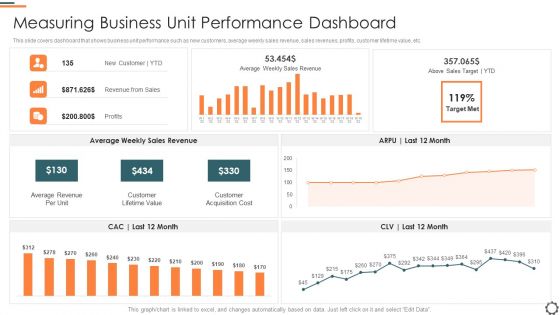
Agile Group For Product Development Measuring Business Unit Performance Dashboard Pictures PDF
This slide covers dashboard that shows business unit performance such as new customers, average weekly sales revenue, sales revenues, profits, customer lifetime value, etc. Deliver and pitch your topic in the best possible manner with this agile group for product development measuring business unit performance dashboard pictures pdf. Use them to share invaluable insights on average revenue per unit, customer lifetime value, customer acquisition cost and impress your audience. This template can be altered and modified as per your expectations. So, grab it now.

Social Media Hiring Process Optimization Dashboard Depicting Social Media Recruitment Metrics Elements PDF
This slide depicts the dashboard showing metrics to measure social media recruitment status which covers sourcing status, bounce rate, filled positions, recruitment expenses, cost per hire, top referrers, etc.Deliver an awe inspiring pitch with this creative social media hiring process optimization dashboard depicting social media recruitment metrics elements pdf bundle. Topics like accelerating the hiring process, recruitment marketing efforts, build talent community can be discussed with this completely editable template. It is available for immediate download depending on the needs and requirements of the user.
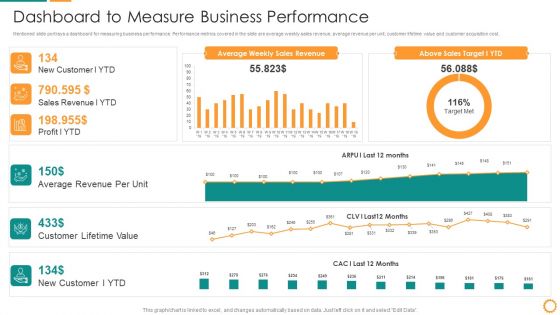
IT Consolidation Post Mergers And Acquisition Dashboard To Measure Business Performance Clipart PDF
Mentioned slide portrays a dashboard for measuring business performance. Performance metrics covered in the slide are average weekly sales revenue, average revenue per unit, customer lifetime value and customer acquisition cost. Deliver and pitch your topic in the best possible manner with this IT Consolidation Post Mergers And Acquisition Dashboard To Measure Business Performance Clipart PDF. Use them to share invaluable insights on Average Revenue, Customer Lifetime Value, Sales Revenue, Sales Target and impress your audience. This template can be altered and modified as per your expectations. So, grab it now.
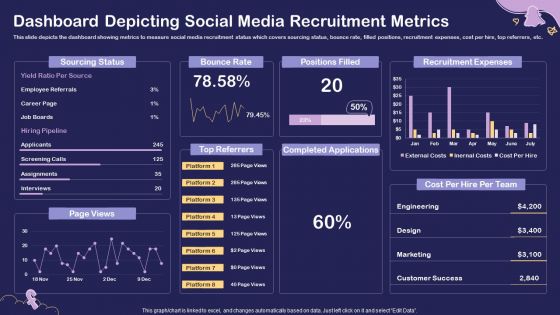
Social Media Hiring For Potential Candidate Dashboard Depicting Social Media Recruitment Structure PDF
This slide depicts the dashboard showing metrics to measure social media recruitment status which covers sourcing status, bounce rate, filled positions, recruitment expenses, cost per hire, top referrers, etc. Deliver an awe inspiring pitch with this creative Social Media Hiring For Potential Candidate Dashboard Depicting Social Media Recruitment Structure PDF bundle. Topics like Sourcing Status, Bounce Rate, Positions Filled, Recruitment Expenses can be discussed with this completely editable template. It is available for immediate download depending on the needs and requirements of the user.

Business Performance Review Dashboard To Measure Overall Business Performance Formats PDF
The following slide highlights a comprehensive quarterly business review QBR dashboard which can be used by the organization to evaluate business performance. The metrics used for review are total revenue, new customers, gross profit, overall costs, sales comparison, sales by different products and top performing channels. Showcasing this set of slides titled Business Performance Review Dashboard To Measure Overall Business Performance Formats PDF. The topics addressed in these templates are Sales Comparison, Sales Product, High Performing. All the content presented in this PPT design is completely editable. Download it and make adjustments in color, background, font etc. as per your unique business setting.
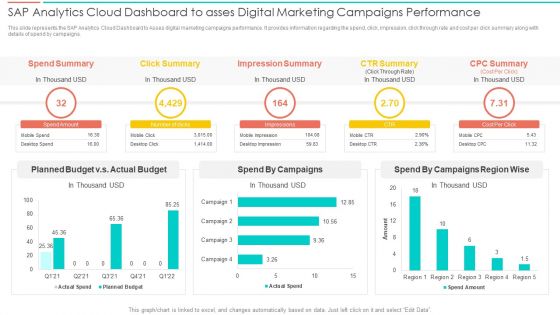
SAC Planning And Implementation SAP Analytics Cloud Dashboard To Asses Digital Marketing Pictures PDF
This slide represents the SAP Analytics Cloud Dashboard to Asses digital marketing campaigns performance. It provides information regarding the spend, click, impression, click through rate and cost per click summary along with details of spend by campaigns. Deliver an awe inspiring pitch with this creative SAC Planning And Implementation SAP Analytics Cloud Dashboard To Asses Digital Marketing Pictures PDF bundle. Topics like Spend Summary, Click Summary, Impression Summary, CTR Summary can be discussed with this completely editable template. It is available for immediate download depending on the needs and requirements of the user.

Brand Promotion Communication Strategy Dashboard For Analyzing Brand Perception Introduction PDF
This slide covers the dashboard for tracking brand reputation. It also includes metrics such as new customer lifetime value, customer acquisition cost, target met, above sales target, average weekly sales revenue, etc. Deliver an awe inspiring pitch with this creative Brand Promotion Communication Strategy Dashboard For Analyzing Brand Perception Introduction PDF bundle. Topics like New customer YTD, Sales revenue YTD, Profit YTD can be discussed with this completely editable template. It is available for immediate download depending on the needs and requirements of the user.
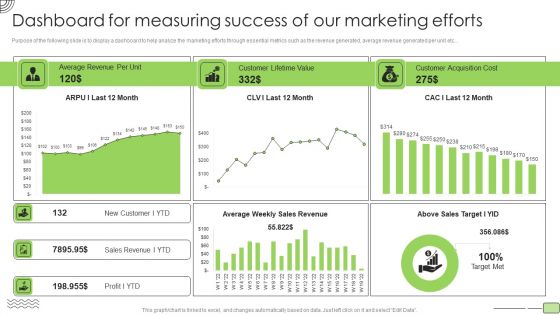
Organic Business Growth Strategies Dashboard For Measuring Success Of Our Marketing Efforts Diagrams PDF
Purpose of the following slide is to display a dashboard to help analyze the marketing efforts through essential metrics such as the revenue generated, average revenue generated per unit etc. Deliver an awe inspiring pitch with this creative Organic Business Growth Strategies Dashboard For Measuring Success Of Our Marketing Efforts Diagrams PDF bundle. Topics like Average Revenue, Customer Lifetime Value, Customer Acquisition Cost can be discussed with this completely editable template. It is available for immediate download depending on the needs and requirements of the user.
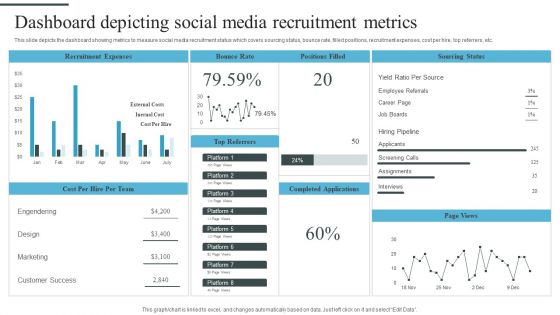
Tactical Process For Social Dashboard Depicting Social Media Recruitment Metrics Themes PDF
This slide depicts the dashboard showing metrics to measure social media recruitment status which covers sourcing status, bounce rate, filled positions, recruitment expenses, cost per hire, top referrers, etc. Deliver and pitch your topic in the best possible manner with this Tactical Process For Social Dashboard Depicting Social Media Recruitment Metrics Themes PDF. Use them to share invaluable insights on Recruitment Expenses, Bounce Rate, Positions Filled and impress your audience. This template can be altered and modified as per your expectations. So, grab it now.
Dashboard For Analyzing IT Hiring Status Ppt PowerPoint Presentation Icon Slides PDF
This slide defines the analysis dashboard for information technology IT recruitment status. It includes information related to technical and non- technical hiring, hiring pipeline, etc. Showcasing this set of slides titled Dashboard For Analyzing IT Hiring Status Ppt PowerPoint Presentation Icon Slides PDF. The topics addressed in these templates are Current Hiring Pipeline, Recruitment Costs YTD, Acceptance Rate. All the content presented in this PPT design is completely editable. Download it and make adjustments in color, background, font etc. as per your unique business setting.
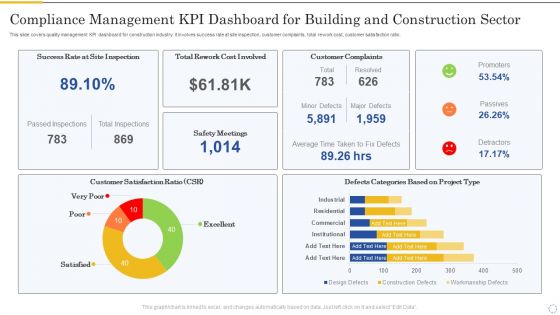
Compliance Management Kpi Dashboard For Building And Construction Sector Inspiration PDF
This slide covers quality management KPI dashboard for construction industry. It involves success rate at site inspection, customer complaints, total rework cost, customer satisfaction ratio. Pitch your topic with ease and precision using this Compliance Management Kpi Dashboard For Building And Construction Sector Inspiration PDF. This layout presents information on Customer Complaints, Customer Satisfaction, Safety Meetings. It is also available for immediate download and adjustment. So, changes can be made in the color, design, graphics or any other component to create a unique layout.
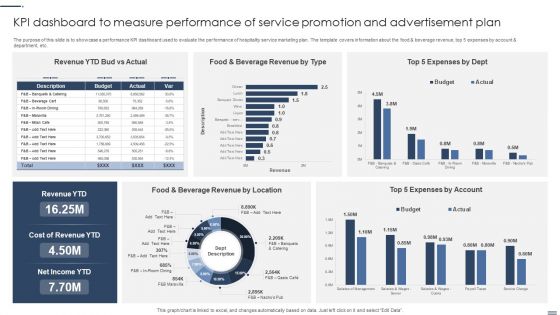
Kpi Dashboard To Measure Performance Of Service Promotion And Advertisement Plan Background PDF
The purpose of this slide is to showcase a performance KPI dashboard used to evaluate the performance of hospitality service marketing plan. The template covers information about the food and beverage revenue, top 5 expenses by account and department, etc. Showcasing this set of slides titled Kpi Dashboard To Measure Performance Of Service Promotion And Advertisement Plan Background PDF. The topics addressed in these templates areLocation, Account, Cost Revenue. All the content presented in this PPT design is completely editable. Download it and make adjustments in color, background, font etc. as per your unique business setting.

Promotion Strategies For New Service Launch Service Subscription And Revenue Assessment Dashboard Mockup PDF
This slide showcases dashboard that can help organization to identify the new customers acquired and revenue generated by service subscriptions. Its key components are average weekly subscription revenue, subscription sales target, customer lifetime value and customer acquisition cost. There are so many reasons you need a Promotion Strategies For New Service Launch Service Subscription And Revenue Assessment Dashboard Mockup PDF. The first reason is you can not spend time making everything from scratch, Thus, Slidegeeks has made presentation templates for you too. You can easily download these templates from our website easily.
Staff Awareness Playbook Determine Workforce Training Performance Tracking Dashboard Slides PDF
This slide provides information regarding workforce training performance tracking dashboard with training cost, number of participants, hours of training, etc. This Staff Awareness Playbook Determine Workforce Training Performance Tracking Dashboard Slides PDF from Slidegeeks makes it easy to present information on your topic with precision. It provides customization options, so you can make changes to the colors, design, graphics, or any other component to create a unique layout. It is also available for immediate download, so you can begin using it right away. Slidegeeks has done good research to ensure that you have everything you need to make your presentation stand out. Make a name out there for a brilliant performance.
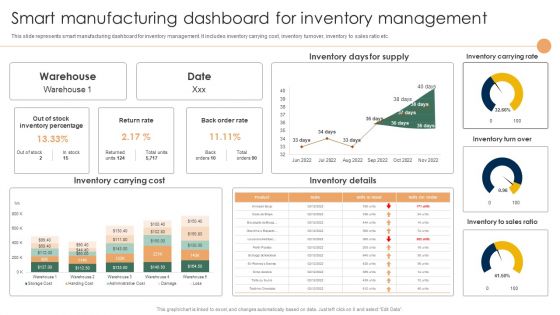
Smart Manufacturing Deployment Improve Production Procedures Smart Manufacturing Dashboard Summary PDF
This slide represents smart manufacturing dashboard for inventory management. It includes inventory carrying cost, inventory turnover, inventory to sales ratio etc.Slidegeeks has constructed Smart Manufacturing Deployment Improve Production Procedures Smart Manufacturing Dashboard Summary PDF after conducting extensive research and examination. These presentation templates are constantly being generated and modified based on user preferences and critiques from editors. Here, you will find the most attractive templates for a range of purposes while taking into account ratings and remarks from users regarding the content. This is an excellent jumping-off point to explore our content and will give new users an insight into our top-notch PowerPoint Templates.
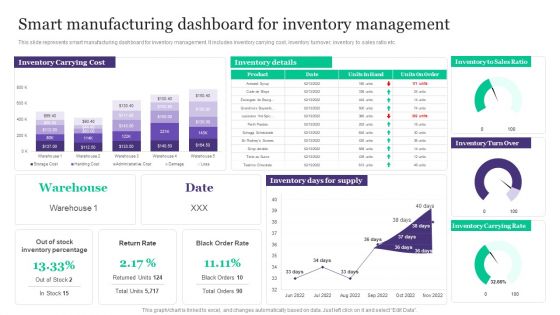
Deployment Of Automated Production Technology Smart Manufacturing Dashboard For Inventory Management Brochure PDF
This slide represents smart manufacturing dashboard for inventory management. It includes inventory carrying cost, inventory turnover, inventory to sales ratio etc.Welcome to our selection of the Deployment Of Automated Production Technology Smart Manufacturing Dashboard For Inventory Management Brochure PDF. These are designed to help you showcase your creativity and bring your sphere to life. Planning and Innovation are essential for any business that is just starting out. This collection contains the designs that you need for your everyday presentations. All of our PowerPoints are 100 precent editable, so you can customize them to suit your needs. This multi-purpose template can be used in various situations. Grab these presentation templates today.
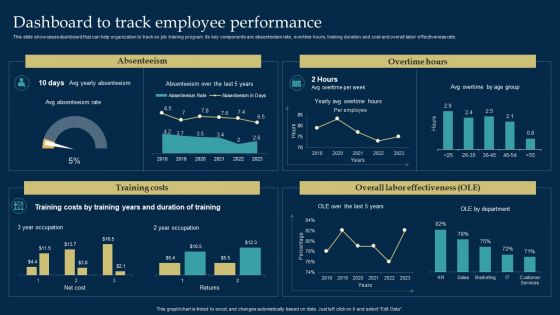
Employee Training And Development Strategy Dashboard To Track Employee Performance Slides PDF
This slide showcases dashboard that can help organization to track on job training program. Its key components are absenteeism rate, overtime hours, training duration and cost and overall labor effectiveness rate. Take your projects to the next level with our ultimate collection of Employee Training And Development Strategy Dashboard To Track Employee Performance Slides PDF. Slidegeeks has designed a range of layouts that are perfect for representing task or activity duration, keeping track of all your deadlines at a glance. Tailor these designs to your exact needs and give them a truly corporate look with your own brand colors they will make your projects stand out from the rest.

Dashboard For Analyzing Brand Perception Building A Comprehensive Brand Elements PDF
This slide covers the dashboard for tracking brand reputation. It also includes metrics such as new customer lifetime value, customer acquisition cost, target met, above sales target, average weekly sales revenue, etc. Find a pre-designed and impeccable Dashboard For Analyzing Brand Perception Building A Comprehensive Brand Elements PDF. The templates can ace your presentation without additional effort. You can download these easy-to-edit presentation templates to make your presentation stand out from others. So, what are you waiting for Download the template from Slidegeeks today and give a unique touch to your presentation.
System Deployment Project Software Implementation Project Progress Tracking Dashboard Structure PDF
This slide represents the dashboard to track the progress of software implementation project. It includes details related to health, tasks, project, time, cost and workload of software implementation project. Take your projects to the next level with our ultimate collection of System Deployment Project Software Implementation Project Progress Tracking Dashboard Structure PDF. Slidegeeks has designed a range of layouts that are perfect for representing task or activity duration, keeping track of all your deadlines at a glance. Tailor these designs to your exact needs and give them a truly corporate look with your own brand colors theyll make your projects stand out from the rest
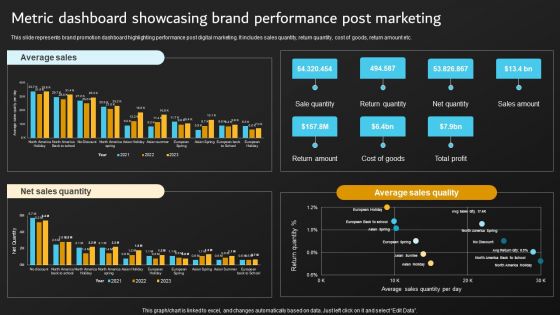
Implementation Of Digital Marketing Metric Dashboard Showcasing Brand Performance Diagrams PDF
This slide represents brand promotion dashboard highlighting performance post digital marketing. It includes sales quantity, return quantity, cost of goods, return amount etc. Slidegeeks has constructed Implementation Of Digital Marketing Metric Dashboard Showcasing Brand Performance Diagrams PDF after conducting extensive research and examination. These presentation templates are constantly being generated and modified based on user preferences and critiques from editors. Here, you will find the most attractive templates for a range of purposes while taking into account ratings and remarks from users regarding the content. This is an excellent jumping-off point to explore our content and will give new users an insight into our top-notch PowerPoint Templates.
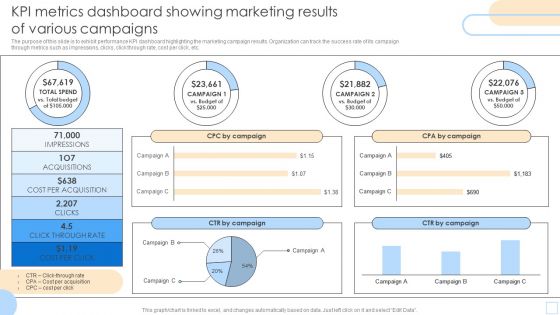
KPI Metrics Dashboard Showing Marketing Results Of Various Campaigns Pictures PDF
The purpose of this slide is to exhibit performance KPI dashboard highlighting the marketing campaign results. Organization can track the success rate of its campaign through metrics such as impressions, clicks, click through rate, cost per click, etc. Pitch your topic with ease and precision using this KPI Metrics Dashboard Showing Marketing Results Of Various Campaigns Pictures PDF. This layout presents information on Impressions, Acquisitions, CPA By Campaign. It is also available for immediate download and adjustment. So, changes can be made in the color, design, graphics or any other component to create a unique layout.
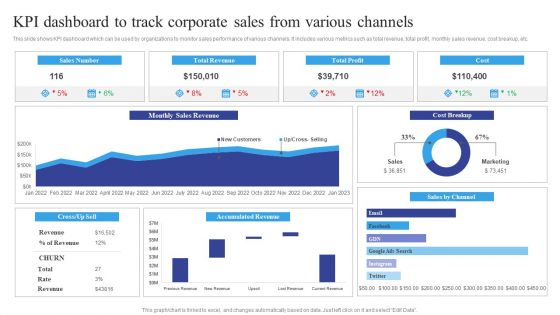
KPI Dashboard To Track Corporate Sales From Various Channels Information PDF
This slide shows KPI dashboard which can be used by organizations to monitor sales performance of various channels. It includes various metrics such as total revenue, total profit, monthly sales revenue, cost breakup, etc. Showcasing this set of slides titled KPI Dashboard To Track Corporate Sales From Various Channels Information PDF. The topics addressed in these templates are Track Corporate Sales, Various Channels. All the content presented in this PPT design is completely editable. Download it and make adjustments in color, background, font etc. as per your unique business setting.

KPI Dashboard Showcasing Website Management Progress And Performance Status Structure PDF
This slide provides dashboard representing website development progress metrics with project performance status. It provides information regarding latency of product, pageviews by browser, pull requests and cost of cloud services. Showcasing this set of slides titled KPI Dashboard Showcasing Website Management Progress And Performance Status Structure PDF. The topics addressed in these templates are Pageview By Browser, Product, Average Latency. All the content presented in this PPT design is completely editable. Download it and make adjustments in color, background, font etc. as per your unique business setting.
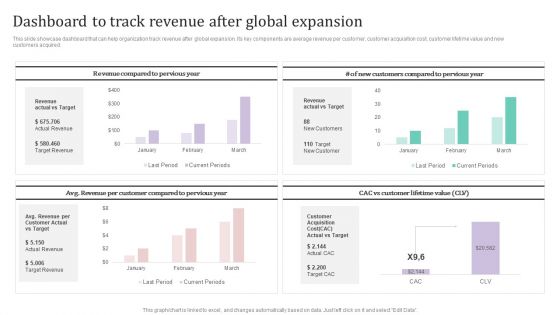
Dashboard To Track Revenue After Global Expansion Ppt PowerPoint Presentation File Example PDF
This slide showcase dashboard that can help organization track revenue after global expansion. Its key components are average revenue per customer, customer acquisition cost, customer lifetime value and new customers acquired.Take your projects to the next level with our ultimate collection of Dashboard To Track Revenue After Global Expansion Ppt PowerPoint Presentation File Example PDF. Slidegeeks has designed a range of layouts that are perfect for representing task or activity duration, keeping track of all your deadlines at a glance. Tailor these designs to your exact needs and give them a truly corporate look with your own brand colors they all make your projects stand out from the rest.
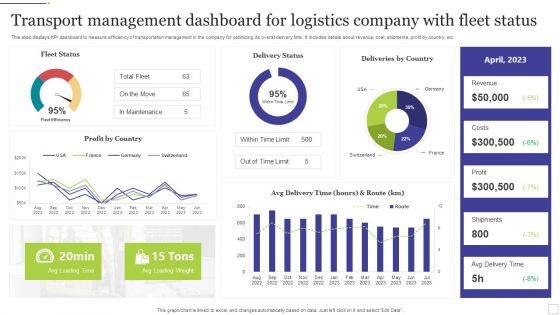
Transport Management Dashboard For Logistics Company With Fleet Status Ideas PDF
This slide displays KPI dashboard to measure efficiency of transportation management in the company for optimizing its overall delivery time. It includes details about revenue, cost, shipments, profit by country, etc. Showcasing this set of slides titled Transport Management Dashboard For Logistics Company With Fleet Status Ideas PDF. The topics addressed in these templates are Logistics Company, Fleet Status. All the content presented in this PPT design is completely editable. Download it and make adjustments in color, background, font etc. as per your unique business setting.

Latest Methodologies Of Construction Essential Construction Activities Management Dashboard Mockup PDF
This slide provides information regarding essential construction activities management dashboard with details about site inspection, rework costs, safety meetings, etc. From laying roadmaps to briefing everything in detail, our templates are perfect for you. You can set the stage with your presentation slides. All you have to do is download these easy-to-edit and customizable templates. Latest Methodologies Of Construction Essential Construction Activities Management Dashboard Mockup PDF will help you deliver an outstanding performance that everyone would remember and praise you for. Do download this presentation today.

KPI Dashboard To Track Neuromarketing Strategy Impact On Website Pageview Ppt Model Templates PDF
Following slide demonstrates KPI dashboard for monitoring neuromarketing impact on business pageview to develop best website marketing campaign. It includes elements such as digital advertisement pageview, pageview to click ratio, click live chart, source based pageview, cost per click and organic pageview. Showcasing this set of slides titled KPI Dashboard To Track Neuromarketing Strategy Impact On Website Pageview Ppt Model Templates PDF. The topics addressed in these templates are Digital Advertisement, Campaigns Pageview, Click Based Pageview. All the content presented in this PPT design is completely editable. Download it and make adjustments in color, background, font etc. as per your unique business setting.
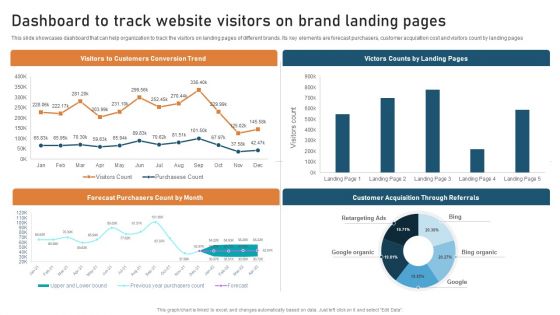
Targeted Market Entry Strategy Dashboard To Track Website Visitors On Brand Landing Guidelines PDF
This slide showcases dashboard that can help organization to track the visitors on landing pages of different brands. Its key elements are forecast purchasers, customer acquisition cost and visitors count by landing pages. From laying roadmaps to briefing everything in detail, our templates are perfect for you. You can set the stage with your presentation slides. All you have to do is download these easy-to-edit and customizable templates. Targeted Market Entry Strategy Dashboard To Track Website Visitors On Brand Landing Guidelines PDF will help you deliver an outstanding performance that everyone would remember and praise you for. Do download this presentation today.

Guide Digital Advertising Optimize Lead Targeting Metric Dashboard Showcasing Brand Performance Post Slides PDF
This slide represents brand promotion dashboard highlighting performance post digital marketing. It includes sales quantity, return quantity, cost of goods, return amount etc. From laying roadmaps to briefing everything in detail, our templates are perfect for you. You can set the stage with your presentation slides. All you have to do is download these easy to edit and customizable templates. Guide Digital Advertising Optimize Lead Targeting Metric Dashboard Showcasing Brand Performance Post Slides PDF will help you deliver an outstanding performance that everyone would remember and praise you for. Do download this presentation today.
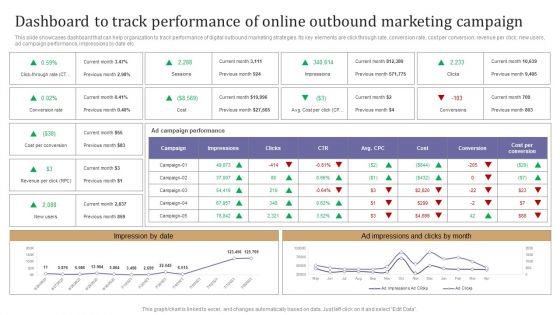
Dashboard To Track Performance Of Online Outbound Marketing Campaign Template PDF
This slide showcases dashboard that can help organization to track performance of digital outbound marketing strategies. Its key elements are click through rate, conversion rate, cost per conversion, revenue per click, new users, ad campaign performance, impressions by date etc. There are so many reasons you need a Dashboard To Track Performance Of Online Outbound Marketing Campaign Template PDF. The first reason is you can not spend time making everything from scratch, Thus, Slidegeeks has made presentation templates for you too. You can easily download these templates from our website easily.
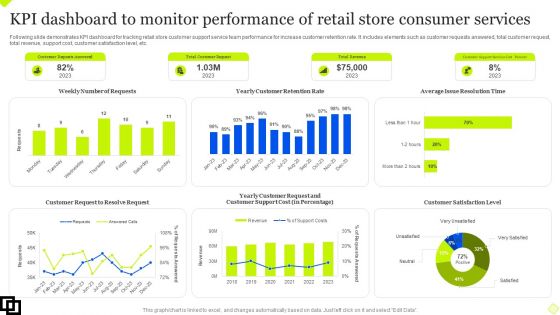
KPI Dashboard To Monitor Performance Of Retail Store Consumer Services Summary PDF
Following slide demonstrates KPI dashboard for tracking retail store customer support service team performance for increase customer retention rate. It includes elements such as customer requests answered, total customer request, total revenue, support cost, customer satisfaction level, etc. Showcasing this set of slides titled KPI Dashboard To Monitor Performance Of Retail Store Consumer Services Summary PDF. The topics addressed in these templates are Customer Request, Customer Retention Rate, Customer Satisfaction Level. All the content presented in this PPT design is completely editable. Download it and make adjustments in color, background, font etc. as per your unique business setting.
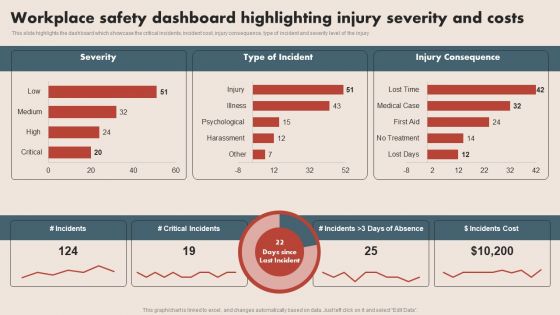
Deploying Safe Operating Procedures In The Organization Workplace Safety Dashboard Highlighting Injury Professional PDF
This slide highlights the dashboard which showcase the critical incidents, incident cost, injury consequence, type of incident and severity level of the injury. Take your projects to the next level with our ultimate collection of Deploying Safe Operating Procedures In The Organization Workplace Safety Dashboard Highlighting Injury Professional PDF. Slidegeeks has designed a range of layouts that are perfect for representing task or activity duration, keeping track of all your deadlines at a glance. Tailor these designs to your exact needs and give them a truly corporate look with your own brand colors they will make your projects stand out from the rest.

Lean Production Techniques To Enhance Operational Effectiveness Metric Dashboard To Monitor Lean Manufacturing Topics PDF
This slide represents metric dashboard to monitor lean manufacturing process. It includes production time, downtime, manufacturing cost, rework quality etc. Present like a pro with Lean Production Techniques To Enhance Operational Effectiveness Metric Dashboard To Monitor Lean Manufacturing Topics PDF Create beautiful presentations together with your team, using our easy to use presentation slides. Share your ideas in real time and make changes on the fly by downloading our templates. So whether you are in the office, on the go, or in a remote location, you can stay in sync with your team and present your ideas with confidence. With Slidegeeks presentation got a whole lot easier. Grab these presentations today.

 Home
Home