Investment Dashboard

Iot Digital Twin Technology Post Covid Expenditure Management Key Performance Indicators Background PDF
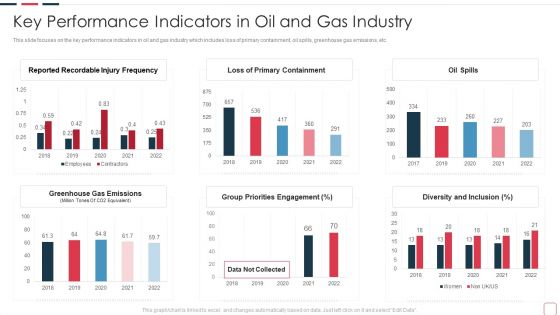
This slide focuses on the key performance indicators in oil and gas industry which includes loss of primary containment, oil spills, greenhouse gas emissions, etc. Deliver an awe inspiring pitch with this creative iot digital twin technology post covid expenditure management key performance indicators background pdf bundle. Topics like key performance indicators in oil and gas industry can be discussed with this completely editable template. It is available for immediate download depending on the needs and requirements of the user.
Price Benefit Internet Things Digital Twins Execution After Covid Key Performance Indicators In Oil Slides PDF
This slide focuses on the key performance indicators in oil and gas industry which includes loss of primary containment, oil spills, greenhouse gas emissions, etc. Deliver an awe inspiring pitch with this creative price benefit internet things digital twins execution after covid key performance indicators in oil slides pdf bundle. Topics like key performance indicators in oil and gas industry can be discussed with this completely editable template. It is available for immediate download depending on the needs and requirements of the user.

Cost Saving Benefits Of Implementing Data Center Prerequisites For Data Center Relocation Summary PDF
This slide shows the requirements that must be fulfilled by the company for successful and timely data center relocation such as confirmation of software and hardware support, proper caballing of the power, ensuring enough space and ventilation for racking servers and acquiring extra hard drives and memory. Present like a pro with Cost Saving Benefits Of Implementing Data Center Prerequisites For Data Center Relocation Summary PDF Create beautiful presentations together with your team, using our easy to use presentation slides. Share your ideas in real time and make changes on the fly by downloading our templates. So whether you are in the office, on the go, or in a remote location, you can stay in sync with your team and present your ideas with confidence. With Slidegeeks presentation got a whole lot easier. Grab these presentations today.
Digitalization Corporate Initiative World Wide Trends In E Commerce Industry Formats PDF
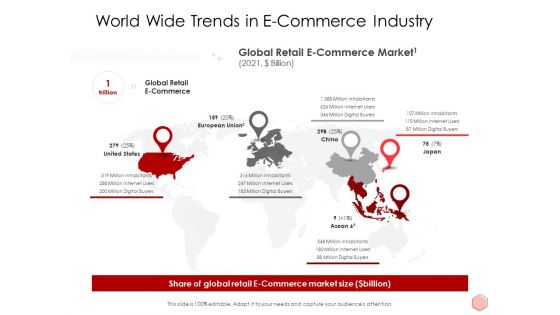
This is adigitalization corporate initiative world wide trends in e commerce industry formats pdf template with various stages. Focus and dispense information on three stages using this creative set, that comes with editable features. It contains large content boxes to add your information on topics like world wide trends in e commerce industry. You can also showcase facts, figures, and other relevant content using this PPT layout. Grab it now.

World Wide Trends In E Commerce Industry Ppt Inspiration Shapes PDF
Presenting world wide trends in e commerce industry ppt inspiration shapes pdf to provide visual cues and insights. Share and navigate important information on five stages that need your due attention. This template can be used to pitch topics like world wide trends in e commerce industry. In addition, this PPT design contains high-resolution images, graphics, etc, that are easily editable and available for immediate download.
Data Analytics Vector Icon Ppt Powerpoint Presentation Icon Designs
This is a data analytics vector icon ppt powerpoint presentation icon designs. This is a four stage process. The stages in this process are data visualization icon, data management icon.
World Wide Trends In E Commerce Industry Ppt Icon Example PDF
This is a world wide trends in e commerce industry ppt icon example pdf template with various stages. Focus and dispense information on five stages using this creative set, that comes with editable features. It contains large content boxes to add your information on topics like market size, retail ecommerce, e commerce market. You can also showcase facts, figures, and other relevant content using this PPT layout. Grab it now.

Vet Potential TikTok Influencers Key TikTok Advertising Strategies To Provide Effective Pictures Pdf
This slide represents the analysis of key performance indicators of the selected potential TikTok influencer by the marketers for their influencer marketing campaign. It includes details related to key metrics such as engagement rate, followers count etc. Find a pre designed and impeccable Vet Potential TikTok Influencers Key TikTok Advertising Strategies To Provide Effective Pictures Pdf. The templates can ace your presentation without additional effort. You can download these easy to edit presentation templates to make your presentation stand out from others. So, what are you waiting for Download the template from Slidegeeks today and give a unique touch to your presentation.

Key Performance Indicators Field Service Management Ppt PowerPoint Presentation Gallery Rules PDF
Presenting this set of slides with name key performance indicators field service management ppt powerpoint presentation gallery rules pdf. The topics discussed in these slide is key performance indicators field service management. This is a completely editable PowerPoint presentation and is available for immediate download. Download now and impress your audience.
Sales Rep Scorecard Sales Rep Scorecard For Representatives Key Performance Indicator Analysis Portrait PDF
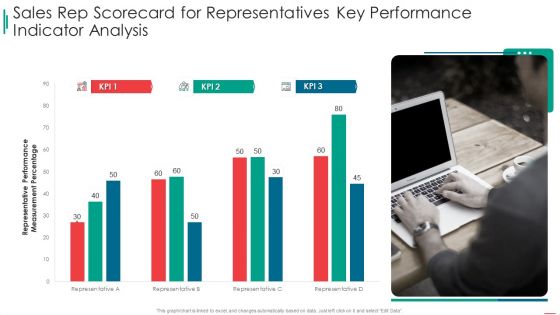
Deliver an awe inspiring pitch with this creative sales rep scorecard sales rep scorecard for representatives key performance indicator analysis portrait pdf bundle. Topics like sales rep scorecard for representatives key performance indicator analysis can be discussed with this completely editable template. It is available for immediate download depending on the needs and requirements of the user.
Market Report To Evaluate Plastic Recycling And Sustainability Management Action Plan Information Pdf
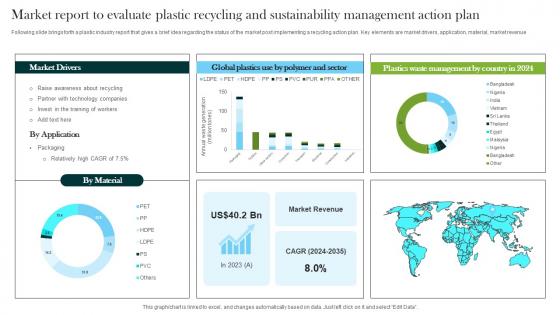
Following slide brings forth a plastic industry report that gives a brief idea regarding the status of the market post implementing a recycling action plan. Key elements are market drivers, application, material, market revenue Pitch your topic with ease and precision using this Market Report To Evaluate Plastic Recycling And Sustainability Management Action Plan Information Pdf. This layout presents information on Action Plan, Market, Material. It is also available for immediate download and adjustment. So, changes can be made in the color, design, graphics or any other component to create a unique layout.
Business Chart Finance PowerPoint Templates And PowerPoint Themes 1012
Visually support your Microsoft office PPT Presentation with our above template illustrating a colored bar graph. This image has been professionally designed to emphasize the concept of statistics. This image has been conceived to enable you to emphatically communicate your ideas in your Business and Financial PPT presentations showing reports, ratings and reviews etc. Deliver amazing presentations to mesmerize your audience.
Quarterly Resource Allocation Plan And Report Icon Ppt Slides Inspiration PDF
Persuade your audience using this Quarterly Resource Allocation Plan And Report Icon Ppt Slides Inspiration PDF. This PPT design covers four stages, thus making it a great tool to use. It also caters to a variety of topics including Quarterly Resource Allocation, Plan And Report, Icon. Download this PPT design now to present a convincing pitch that not only emphasizes the topic but also showcases your presentation skills.
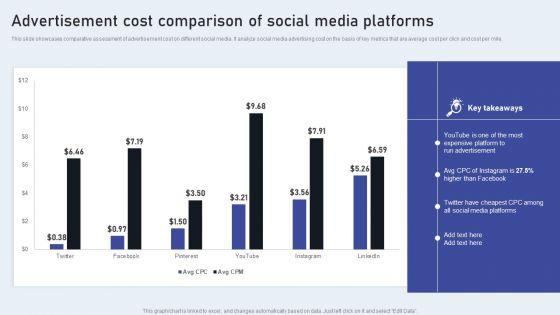
Advertisement Cost Comparison Of Social Media Platforms Graphics PDF
This slide showcases comparative assessment of advertisement cost on different social media. It analyze social media advertising cost on the basis of key metrics that are average cost per click and cost per mile. Make sure to capture your audiences attention in your business displays with our gratis customizable Advertisement Cost Comparison Of Social Media Platforms Graphics PDF. These are great for business strategies, office conferences, capital raising or task suggestions. If you desire to acquire more customers for your tech business and ensure they stay satisfied, create your own sales presentation with these plain slides.
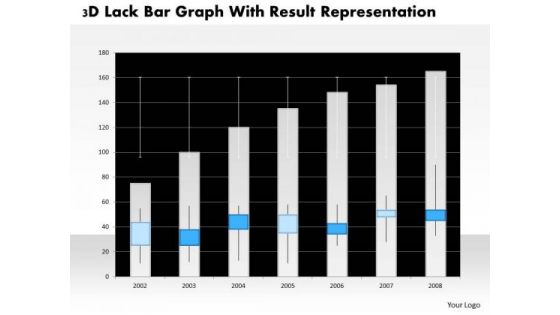
Business Diagram 3d Lack Bar Graph With Result Representation PowerPoint Slide
This business diagram has graphic of 3d lack bar graph. This diagram is a data visualization tool that gives you a simple way to present statistical information. This slide helps your audience examine and interpret the data you present.

Business Diagram Battery Connected With Bulb For Idea Generation PowerPoint Slide
This business slide displays battery icon connected with bulb. This diagram is a data visualization tool that gives you a simple way to present statistical information. This slide helps your audience examine and interpret the data you present.

E Commerce Platform Optimization Planning Timeline Sample PDF
The following slide showcases a roadmap to align key tasks of an organization working on an e-commerce platform. It includes monthly activities associated with strategy, product, data, system, application etc. Pitch your topic with ease and precision using this E Commerce Platform Optimization Planning Timeline Sample PDF. This layout presents information on Accessibility Analysis, Strategy, Systems And Application. It is also available for immediate download and adjustment. So, changes can be made in the color, design, graphics or any other component to create a unique layout.

Market Potential And Opportunity Size For The Company Virtual Currency Financing Pitch Deck Background PDF
The slide provides the comparison graph of market size of online money transfer remittances mobile payment market. It covers the historical 2015 2020 as well as forecasted 2021 2026 data. Deliver an awe inspiring pitch with this creative market potential and opportunity size for the company virtual currency financing pitch deck background pdf bundle. Topics like market potential and opportunity size for the company can be discussed with this completely editable template. It is available for immediate download depending on the needs and requirements of the user.

Data Collection Histograms Ppt PowerPoint Presentation Design Templates
This is a data collection histograms ppt powerpoint presentation design templates. This is a five stage process. The stages in this process are histogram, business, marketing, analysis, chart.
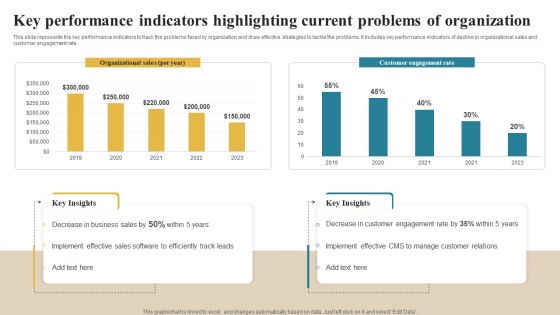
Software Implementation Technique Key Performance Indicators Highlighting Current Problems Elements PDF
This slide represents the key performance indicators to track the problems faced by organization and draw effective strategies to tackle the problems. It includes key performance indicators of decline in organizational sales and customer engagement rate. Make sure to capture your audiences attention in your business displays with our gratis customizable Software Implementation Technique Key Performance Indicators Highlighting Current Problems Elements PDF. These are great for business strategies, office conferences, capital raising or task suggestions. If you desire to acquire more customers for your tech business and ensure they stay satisfied, create your own sales presentation with these plain slides.
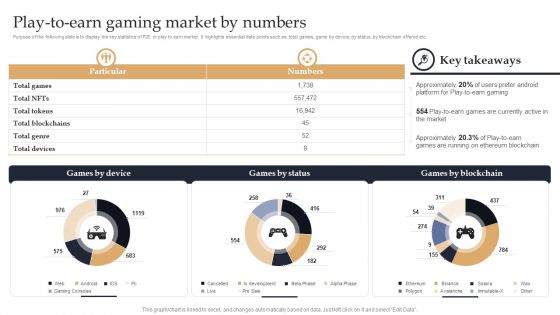
Web 3 0 Blockchain Based P2E Mobile Game Sector Report Promotional Plan Play To Earn Gaming Market By Numbers Summary PDF
Purpose of the following slide is to display the key statistics of P2E or play to earn market. It highlights essential data points such as total games, game by device, by status, by blockchain offered etc. Coming up with a presentation necessitates that the majority of the effort goes into the content and the message you intend to convey. The visuals of a PowerPoint presentation can only be effective if it supplements and supports the story that is being told. Keeping this in mind our experts created Web 3 0 Blockchain Based P2E Mobile Game Sector Report Promotional Plan Play To Earn Gaming Market By Numbers Summary PDF to reduce the time that goes into designing the presentation. This way, you can concentrate on the message while our designers take care of providing you with the right template for the situation.
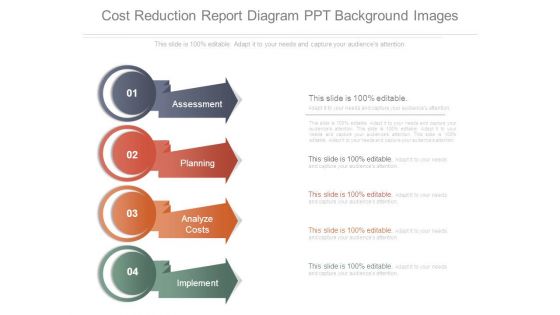
Cost Reduction Report Diagram Ppt Background Images
This is a cost reduction report diagram ppt background images. This is a four stage process. The stages in this process are assessment, planning, analyze costs, implement.

Comparative Analysis Of Data Map Software Ppt PowerPoint Presentation File Objects PDF
This slide shows data inventory software comparative assessment. It provides information such as availability of templates, customization, secured data, instant download, etc. Presenting Comparative Analysis Of Data Map Software Ppt PowerPoint Presentation File Objects PDF to dispense important information. This template comprises four stages. It also presents valuable insights into the topics including Multiple Formats, Secured Data, External Usage. This is a completely customizable PowerPoint theme that can be put to use immediately. So, download it and address the topic impactfully.
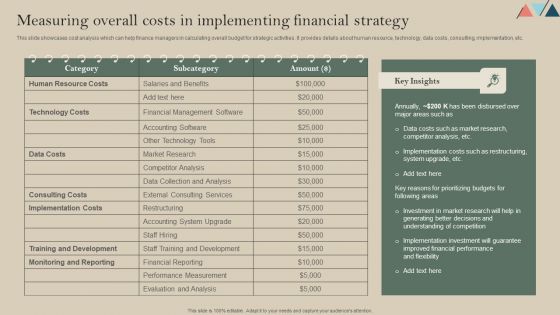
Measuring Overall Costs In Implementing Financial Strategy Themes PDF
This slide showcases cost analysis which can help finance managers in calculating overall budget for strategic activities. It provides details about human resource, technology, data costs, consulting, implementation, etc. Retrieve professionally designed Measuring Overall Costs In Implementing Financial Strategy Themes PDF to effectively convey your message and captivate your listeners. Save time by selecting pre-made slideshows that are appropriate for various topics, from business to educational purposes. These themes come in many different styles, from creative to corporate, and all of them are easily adjustable and can be edited quickly. Access them as PowerPoint templates or as Google Slides themes. You do not have to go on a hunt for the perfect presentation because Slidegeeks got you covered from everywhere.

Scatter Chart Illustrating Data Analysis Ppt PowerPoint Presentation Show Graphic Tips PDF
Presenting scatter chart illustrating data analysis ppt powerpoint presentation show graphic tips pdf to dispense important information. This template comprises three stages. It also presents valuable insights into the topics including scatter chart illustrating data analysis. This is a completely customizable PowerPoint theme that can be put to use immediately. So, download it and address the topic impactfully.
Project Management Integration Icon Depicting Data Analysis Ppt Inspiration Elements PDF
Presenting Project Management Integration Icon Depicting Data Analysis Ppt Inspiration Elements PDF to dispense important information. This template comprises three stages. It also presents valuable insights into the topics including Project Management, Integration Icon, Depicting Data Analysis. This is a completely customizable PowerPoint theme that can be put to use immediately. So, download it and address the topic impactfully.

Five Banners For Nature And Finance Process Flow Powerpoint Template
This PowerPoint template has been designed with five banners nature, finance icons. This diagram is excellent visual tools for business presentations. Download this PPT slide to explain complex data immediately and clearly.

Impact Of Marketing On Patient Conversion Rate Implementation Of Online Ppt Sample
This slide illustrates the positive impact of marketing strategies on the hospitals conversion rate. It includes a conversion report for 5 years 2019 2023 highlighting the increase in the rate The Impact Of Marketing On Patient Conversion Rate Implementation Of Online Ppt Sample is a compilation of the most recent design trends as a series of slides. It is suitable for any subject or industry presentation, containing attractive visuals and photo spots for businesses to clearly express their messages. This template contains a variety of slides for the user to input data, such as structures to contrast two elements, bullet points, and slides for written information. Slidegeeks is prepared to create an impression.
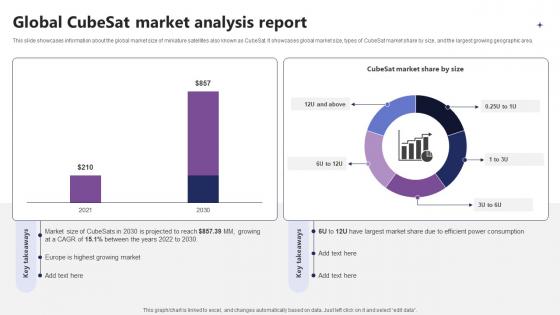
Global Cubesat Market Analysis Report IoT In Orbit Unleashing The Power IoT SS V
This slide showcases information about the global market size of miniature satellites also known as CubeSat. It showcases global market size, types of CubeSat market share by size, and the largest growing geographic area. From laying roadmaps to briefing everything in detail, our templates are perfect for you. You can set the stage with your presentation slides. All you have to do is download these easy-to-edit and customizable templates. Global Cubesat Market Analysis Report IoT In Orbit Unleashing The Power IoT SS V will help you deliver an outstanding performance that everyone would remember and praise you for. Do download this presentation today.

Data And Customer Analysis Company Outline Revenue Growth Trend In Q4 And Fy21 Template PDF
This slide highlights the Nielsen company organic currency and organic constant currency growth trend. It also includes the full year revenue growth for measurement and content. Slidegeeks is one of the best resources for PowerPoint templates. You can download easily and regulate Data And Customer Analysis Company Outline Revenue Growth Trend In Q4 And Fy21 Template PDF for your personal presentations from our wonderful collection. A few clicks is all it takes to discover and get the most relevant and appropriate templates. Use our Templates to add a unique zing and appeal to your presentation and meetings. All the slides are easy to edit and you can use them even for advertisement purposes.

Supplier Performance Evaluation Program Kpis Ppt Infographics Slide PDF
The following slide highlights the supplier performance evaluation program metrics illustrating key headings which includes evaluation components, weightage and supplier. Where evaluation components consists of cost, quality , delivery and total score. Showcasing this set of slides titled Supplier Performance Evaluation Program Kpis Ppt Infographics Slide PDF. The topics addressed in these templates are Evaluation Components, Cost, Price Competitiveness. All the content presented in this PPT design is completely editable. Download it and make adjustments in color, background, font etc. as per your unique business setting.
Cubeit Venture Capitalist Financing Elevator Pitch Deck Showing Platform Accessibility Icons PDF
This slide covers the platform accessibility across multiple devices which includes application programming interface software that allows the database, file and application to integrate with other devices.Deliver an awe inspiring pitch with this creative Cubeit Venture Capitalist Financing Elevator Pitch Deck Showing Platform Accessibility Icons PDF bundle. Topics like Provide Accessibility, Among Different , Data Application can be discussed with this completely editable template. It is available for immediate download depending on the needs and requirements of the user.
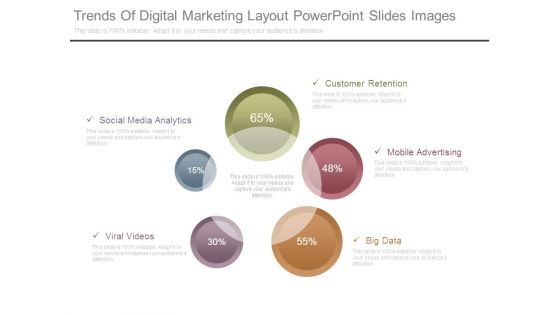
Trends Of Digital Marketing Layout Powerpoint Slides Images
This is a trends of digital marketing layout powerpoint slides images. This is a five stage process. The stages in this process are social media analytics, viral videos, customer retention, mobile advertising, big data.
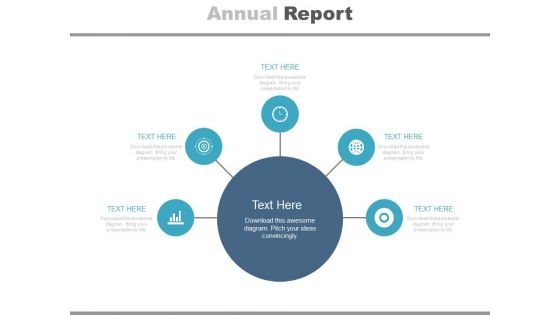
Diagram For Market Research Analysis Powerpoint Slides
This PowerPoint template has been designed with circular infographic diagram. It can be used to display steps for market research and also for financial data analysis. You can download finance PowerPoint template to prepare awesome presentations.

Data Collection And Analysis Control Chart Ppt PowerPoint Presentation Summary Templates
This is a data collection and analysis control chart ppt powerpoint presentation summary templates. This is a one stage process. The stages in this process are business, marketing, point label, upper limit, lower limit.
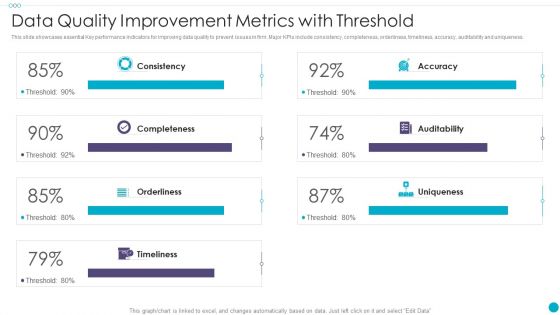
Data Quality Improvement Metrics With Threshold Formats PDF
This slide showcases essential Key performance indicators for improving data quality to prevent issues in firm. Major KPIs include consistency, completeness, orderliness, timeliness, accuracy, auditability and uniqueness. Pitch your topic with ease and precision using this Data Quality Improvement Metrics With Threshold Formats PDF This layout presents information on Auditability, Completeness, Consistency It is also available for immediate download and adjustment. So, changes can be made in the color, design, graphics or any other component to create a unique layout.

Key Production Challenges Faced Business Performance Optimization New Operations Strategy Pictures Pdf
This slide provides glimpse about problems faced by the organization that can provide metrics to target and develop strategies. It includes issues such as production wastage, production downtime with losses in hours and tons, etc. This Key Production Challenges Faced Business Performance Optimization New Operations Strategy Pictures Pdf is perfect for any presentation, be it in front of clients or colleagues. It is a versatile and stylish solution for organizing your meetings. The Key Production Challenges Faced Business Performance Optimization New Operations Strategy Pictures Pdf features a modern design for your presentation meetings. The adjustable and customizable slides provide unlimited possibilities for acing up your presentation. Slidegeeks has done all the homework before launching the product for you. So, do not wait, grab the presentation templates today

Finance Transformation Program Achievement Kpis Ppt PowerPoint Presentation Complete Deck With Slides
This complete presentation has PPT slides on wide range of topics highlighting the core areas of your business needs. It has professionally designed templates with relevant visuals and subject driven content. This presentation deck has total of fourteen slides. Get access to the customizable templates. Our designers have created editable templates for your convenience. You can edit the colour, text and font size as per your need. You can add or delete the content if required. You are just a click to away to have this ready made presentation. Click the download button now.

Business Diagram Human Mind Diagram With Pie Graph For Representation PowerPoint Slide
This diagram displays human face graphic divided into sections. This section can be used for data display. Use this diagram to build professional presentations for your viewers.
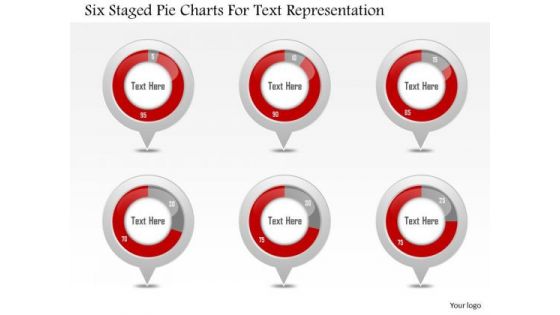
Business Diagram Six Staged Pie Charts For Text Representation PowerPoint Slide
This slide displays graphic six staged pie charts. Download this diagram to present and compare business data. Use this diagram to display business process workflows in any presentation.

Business Diagram Three Text Boxes For Timer For Time Management PowerPoint Slide
This business diagram displays three text boxes. This diagram contains text boxes for data representation. Use this diagram to display business process workflows in any presentations.
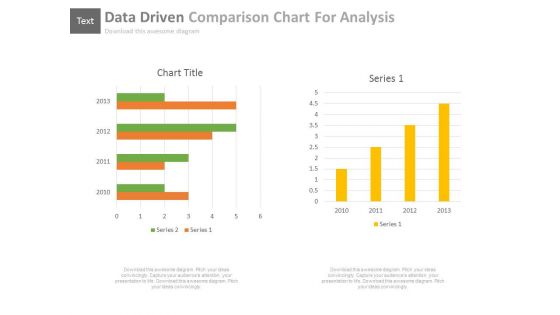
Data Driven Comparison Charts For Analysis Powerpoint Slides
You can download this PowerPoint template to display statistical data and analysis. This PPT slide contains data driven comparison charts. Draw an innovative business idea using this professional diagram.

E Commerce Introduction Ppt PowerPoint Presentation Inspiration Background Designs PDF
Presenting this set of slides with name e commerce introduction ppt powerpoint presentation inspiration background designs pdf. This is a five stage process. The stages in this process are e business and e commerce, organizational structure, e business infrastructure, trends and key drivers, e environment. This is a completely editable PowerPoint presentation and is available for immediate download. Download now and impress your audience.

Data Wiper Spyware Attack Banks On Alert For Russian Reprisal Cyber Attacks On Swift Sample PDF
This slide represents that banks are on alert for Russian reprisal cyber attacks on Society for Worldwide Interbank Financial Telecommunication Swift. This is a data wiper spyware attack banks on alert for russian reprisal cyber attacks on swift sample pdf template with various stages. Focus and dispense information on five stages using this creative set, that comes with editable features. It contains large content boxes to add your information on topics like payments messaging system, military industrial complex, institutions suspended You can also showcase facts, figures, and other relevant content using this PPT layout. Grab it now.
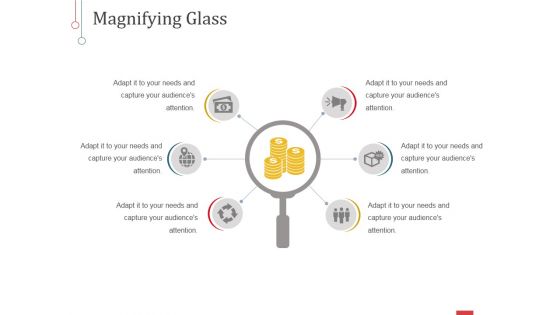
Magnifying Glass Ppt PowerPoint Presentation Show Master Slide
This is a magnifying glass ppt powerpoint presentation show master slide. This is a six stage process. The stages in this process are magnifier, search, marketing, strategy, finance, business.

Quarter Wise Cash Position Report Sample Of Ppt
This is a quarter wise cash position report sample of ppt. This is a four stage process. The stages in this process are initial funding, sales, total cash in, cash out, start up costs, product costs, marketing, fixed costs, total cash out, inflows outflows, cumulative.

Key Performance Indicators For SCM Ppt PowerPoint Presentation File Graphic Tips PDF
Presenting this set of slides with name key performance indicators for scm ppt powerpoint presentation file graphic tips pdf. The topics discussed in these slides are global, financial, perform. This is a completely editable PowerPoint presentation and is available for immediate download. Download now and impress your audience.

Rapid Innovation In HR Technology Space HR Key Performance Indicators Slides PDF
Deliver an awe inspiring pitch with this creative rapid innovation in hr technology space hr key performance indicators slides pdf bundle. Topics like criteria, workforce, performance, revenue, internal can be discussed with this completely editable template. It is available for immediate download depending on the needs and requirements of the user.

Logistics And Supply Chain Platform Funding Pitch Deck Competitive Analysis Topics PDF
Mentioned slide showcases comparative analytics between multiple supply chain data management companies. It includes key features such as founded year, description, company type, tags, location, and employee base. Here you can discover an assortment of the finest PowerPoint and Google Slides templates. With these templates, you can create presentations for a variety of purposes while simultaneously providing your audience with an eye catching visual experience. Download Logistics And Supply Chain Platform Funding Pitch Deck Competitive Analysis Topics PDF to deliver an impeccable presentation. These templates will make your job of preparing presentations much quicker, yet still, maintain a high level of quality. Slidegeeks has experienced researchers who prepare these templates and write high quality content for you. Later on, you can personalize the content by editing the Logistics And Supply Chain Platform Funding Pitch Deck Competitive Analysis Topics PDF.

Finance Offering Development Template Powerpoint Slide Background Picture
This is a finance offering development template powerpoint slide background picture. This is a six stage process. The stages in this process are build report and relationships, audit operations and organization, seek and confirm, proposal and capture mgmt, delivery support, close sale.
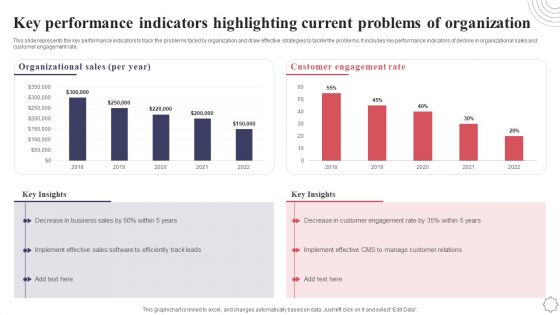
Key Performance Indicators Highlighting Current Problems Of Organization Application Deployment Project Plan Rules PDF
This slide represents the key performance indicators to track the problems faced by organization and draw effective strategies to tackle the problems. It includes key performance indicators of decline in organizational sales and customer engagement rate. Coming up with a presentation necessitates that the majority of the effort goes into the content and the message you intend to convey. The visuals of a PowerPoint presentation can only be effective if it supplements and supports the story that is being told. Keeping this in mind our experts created Key Performance Indicators Highlighting Current Problems Of Organization Application Deployment Project Plan Rules PDF to reduce the time that goes into designing the presentation. This way, you can concentrate on the message while our designers take care of providing you with the right template for the situation.
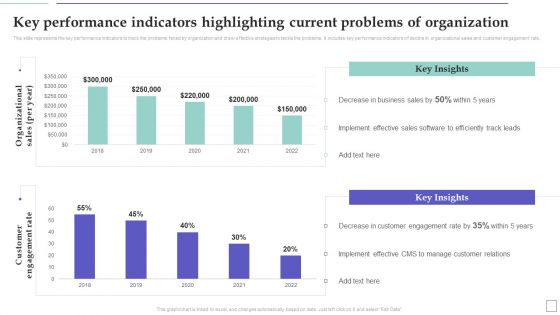
System Deployment Project Key Performance Indicators Highlighting Current Problems Information PDF
This slide represents the key performance indicators to track the problems faced by organization and draw effective strategies to tackle the problems. It includes key performance indicators of decline in organizational sales and customer engagement rate. Coming up with a presentation necessitates that the majority of the effort goes into the content and the message you intend to convey. The visuals of a PowerPoint presentation can only be effective if it supplements and supports the story that is being told. Keeping this in mind our experts created System Deployment Project Key Performance Indicators Highlighting Current Problems Information PDF to reduce the time that goes into designing the presentation. This way, you can concentrate on the message while our designers take care of providing you with the right template for the situation.

Strategic Plan For Enterprise Key Performance Indicators Highlighting Current Problems Diagrams PDF
This slide represents the key performance indicators to track the problems faced by organization and draw effective strategies to tackle the problems. It includes key performance indicators of decline in organizational sales and customer engagement rate. Coming up with a presentation necessitates that the majority of the effort goes into the content and the message you intend to convey. The visuals of a PowerPoint presentation can only be effective if it supplements and supports the story that is being told. Keeping this in mind our experts created Strategic Plan For Enterprise Key Performance Indicators Highlighting Current Problems Diagrams PDF to reduce the time that goes into designing the presentation. This way, you can concentrate on the message while our designers take care of providing you with the right template for the situation.
Charts Representing Business Data Analysis Icon Introduction PDF
Presenting charts representing business data analysis icon introduction pdf. to dispense important information. This template comprises three stages. It also presents valuable insights into the topics including charts representing business data analysis icon. This is a completely customizable PowerPoint theme that can be put to use immediately. So, download it and address the topic impactfully.
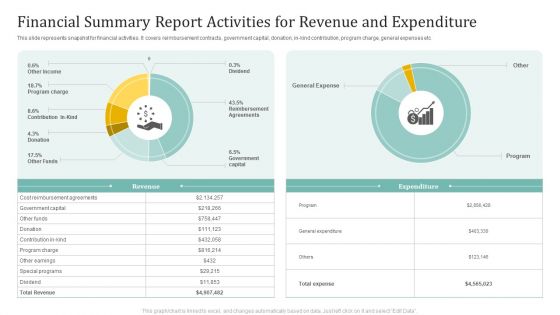
Financial Summary Report Activities For Revenue And Expenditure Ppt Inspiration Display PDF
This slide represents snapshot for financial activities. It covers reimbursement contracts, government capital, donation, in-kind contribution, program charge, general expenses etc. Pitch your topic with ease and precision using this Financial Summary Report Activities For Revenue And Expenditure Ppt Inspiration Display PDF. This layout presents information on Government Capital, Other Funds, Program Charge. It is also available for immediate download and adjustment. So, changes can be made in the color, design, graphics or any other component to create a unique layout.

Business Diagram 3d Lock With Pie Chart And Text Boxes For Business PowerPoint Slide
This Power Point diagram has been crafted with pie chart in shape of lock. It contains diagram of lock pie chart to compare and present data in an effective manner. Use this diagram to build professional presentations for your viewers.

Business Diagram 3d Lock With Pie Graph For Result Representation PowerPoint Slide
This Power Point diagram has been crafted with pie chart in shape of lock. It contains diagram of lock pie chart to compare and present data in an effective manner. Use this diagram to build professional presentations for your viewers.

Business Diagram 3d Pencil With Text Boxes For Representation PowerPoint Slide
This Power Point diagram displays graphic of pencil with icons and text spaces. It contains diagram of colorful pencil for data display. Use this diagram to build professional presentations for your viewers.
Business Diagram Human Icons With Bubbles And Different Icons Inside PowerPoint Slide
This diagram displays graph with percentage value growth. This business slide is suitable to present and compare business data. Use this diagram to build professional presentations for your viewers.
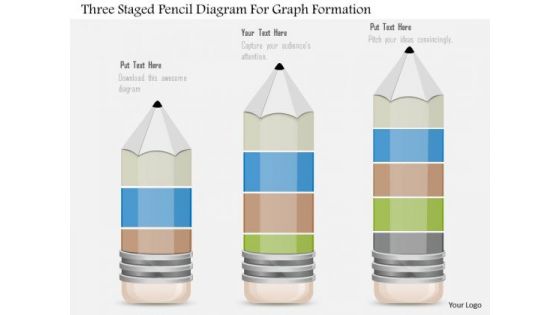
Business Diagram Three Staged Pencil Diagram For Graph Formation PowerPoint Slide
This business diagram displays set of pencils. This Power Point template has been designed to compare and present business data. Download this diagram to represent stages of business growth.

 Home
Home