Heatmap
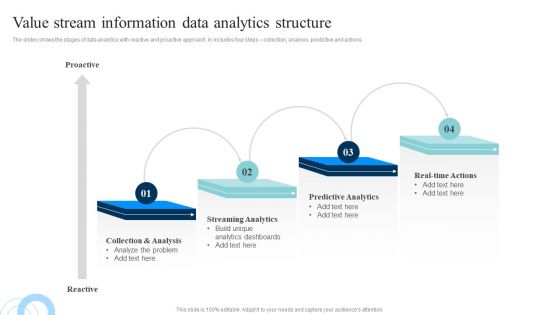
Data Evaluation And Processing Toolkit Value Stream Information Data Analytics Structure Themes PDF
The slides shows the stages of data analytics with reactive and proactive approach. In includes four steps collection, analysis, predictive and actions. This modern and well-arranged Data Evaluation And Processing Toolkit Value Stream Information Data Analytics Structure Themes PDF provides lots of creative possibilities. It is very simple to customize and edit with the Powerpoint Software. Just drag and drop your pictures into the shapes. All facets of this template can be edited with Powerpoint, no extra software is necessary. Add your own material, put your images in the places assigned for them, adjust the colors, and then you can show your slides to the world, with an animated slide included.
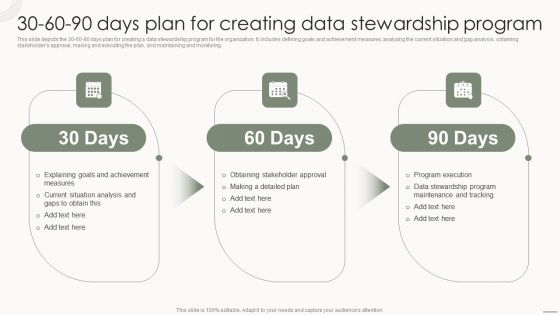
Data Governance IT 30 60 90 Days Plan For Creating Data Stewardship Program Rules PDF
This slide depicts the 30 60 90 days plan for creating a data stewardship program for the organization. It includes defining goals and achievement measures, analyzing the current situation and gap analysis, obtaining stakeholders approval, making and executing the plan, and maintaining and monitoring. Find a pre designed and impeccable Data Governance IT 30 60 90 Days Plan For Creating Data Stewardship Program Rules PDF. The templates can ace your presentation without additional effort. You can download these easy to edit presentation templates to make your presentation stand out from others. So, what are you waiting for Download the template from Slidegeeks today and give a unique touch to your presentation.

Advanced Email Metrics And Analysis Services Diagram Slide
This is a advanced email metrics and analysis services diagram slide. This is a four stage process. The stages in this process are analytics data warehouse, data mining, financial modeling.

Sample Of Mdm Analysis Ppt Template Powerpoint Templates
This is a sample of mdm analysis ppt template powerpoint templates. This is a six stage process. The stages in this process are audit, policy, data flows, business rules, data quality, customer service.
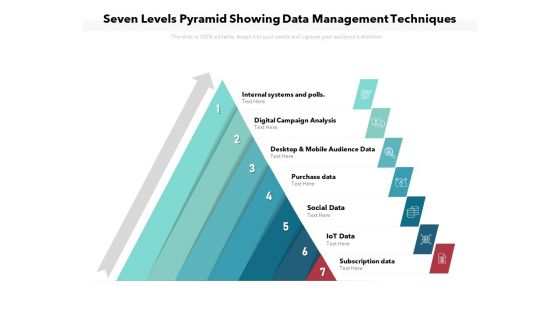
Seven Levels Pyramid Showing Data Management Techniques Ppt PowerPoint Presentation File Guide PDF
Presenting seven levels pyramid showing data management techniques ppt powerpoint presentation file guide pdf to dispense important information. This template comprises seven stages. It also presents valuable insights into the topics including analysis, social data, digital campaign. This is a completely customizable PowerPoint theme that can be put to use immediately. So, download it and address the topic impactfully.

Data Quality Management System With Cleaning Strategy Ppt PowerPoint Presentation File Files PDF
Presenting data quality management system with cleaning strategy ppt powerpoint presentation file files pdf to dispense important information. This template comprises four stages. It also presents valuable insights into the topics including assessment, cleaning strategy, develop data analysis metrics. This is a completely customizable PowerPoint theme that can be put to use immediately. So, download it and address the topic impactfully.
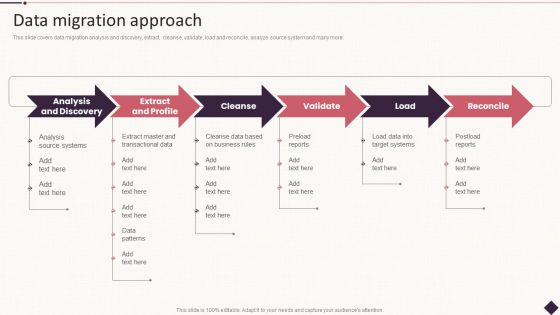
IT Project Development Planning Data Migration Approach Structure PDF
This slide covers data migration analysis and discovery, extract, cleanse, validate, load and reconcile, analyze source system and many more.Presenting IT Project Development Planning Data Migration Approach Structure PDF to provide visual cues and insights. Share and navigate important information on six stages that need your due attention. This template can be used to pitch topics like Analysis Discovery, Extract Profile, Transactional Data. In addtion, this PPT design contains high resolution images, graphics, etc, that are easily editable and available for immediate download.

Four Staged Competitive Analysis Model Powerpoint Template
This PowerPoint slide contains matrix diagram of four steps. This professional slide may be used for competitive analysis. Adjust the above diagram in your business presentations to give professional impact.
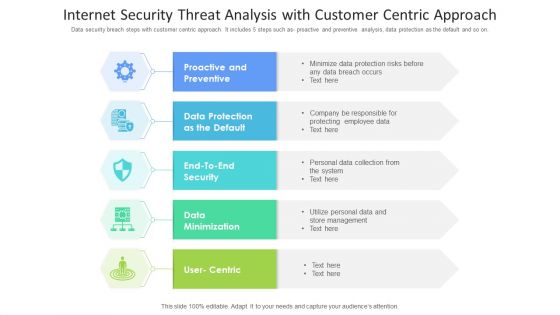
Internet Security Threat Analysis With Customer Centric Approach Mockup PDF
Data security breach steps with customer centric approach. It includes 5 steps such as- proactive and preventive analysis, data protection as the default and so on. Showcasing this set of slides titled internet security threat analysis with customer centric approach mockup pdf. The topics addressed in these templates are data minimization, data protection, proactive and preventive. All the content presented in this PPT design is completely editable. Download it and make adjustments in color, background, font etc. as per your unique business setting.

Business Analysis Vs Business Analytics Diagram Ppt Slides
This is a business analysis vs business analytics diagram ppt slides. This is a one stage process. The stages in this process are area, main focus, architectural domains, requirements, project management, business analysis, functions and process, enterprise? process technology organisation, functionality software configuration and development, sdlc, business analytics, data and reporting, data information technology, reports, dashboards and kpis data consolidation and presention, sdlc agile.
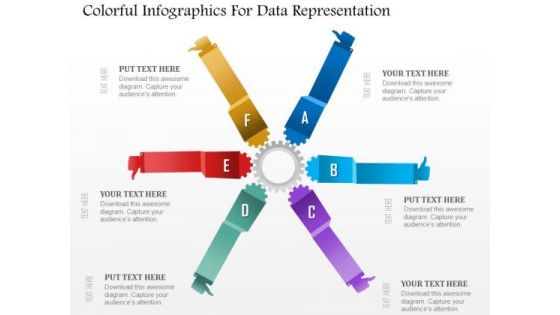
Business Diagram Colorful Infographics For Data Representation Presentation Template
This power point template diagram has been crafted with graphic of colorful info graphics. This PPT diagram contains the concept of analysis and data representations. Use this PPT for marketing and business related presentations.
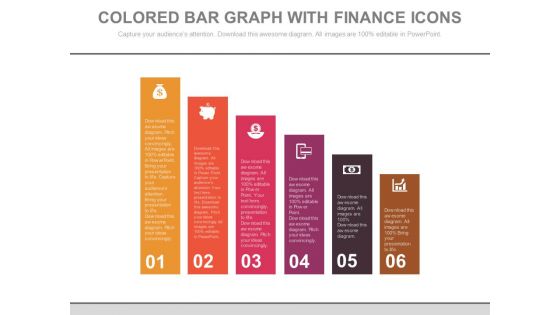
Bar Graph For Marketing Research Data Powerpoint Slides
This PowerPoint template has been designed with diagram of bar graph. This PPT slide can be used to prepare presentations for profit growth report and also for financial data analysis. You can download finance PowerPoint template to prepare awesome presentations.

Lego Blocks Design For Data Representation Powerpoint Slides
This PowerPoint template has been designed with Lego blocks diagram. You can use this ppt slide for statistical analysis or for data representation. Download this PPT slide to build impressive presentations.
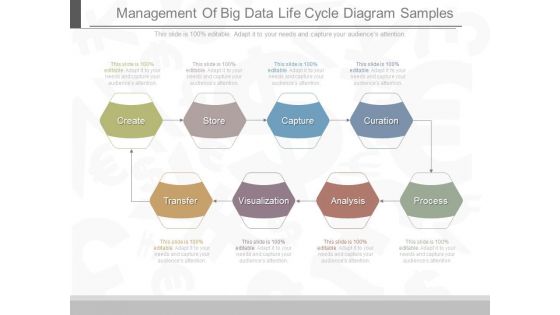
Management Of Big Data Life Cycle Diagram Samples
This is a management of big data life cycle diagram samples. This is a eight stage process. The stages in this process are create, store, capture, curation, transfer, visualization, analysis, process.
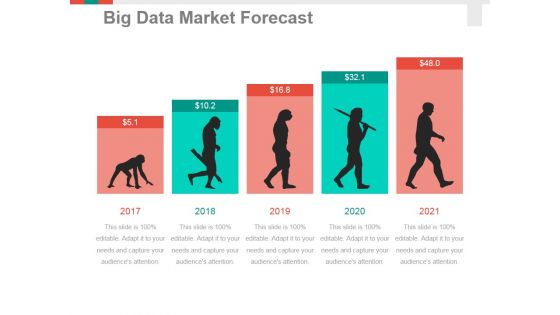
Big Data Market Forecast Ppt PowerPoint Presentation Portfolio Inspiration
This is a big data market forecast ppt powerpoint presentation portfolio inspiration. This is a five stage process. The stages in this process are business, growth, analysis, strategy, success.
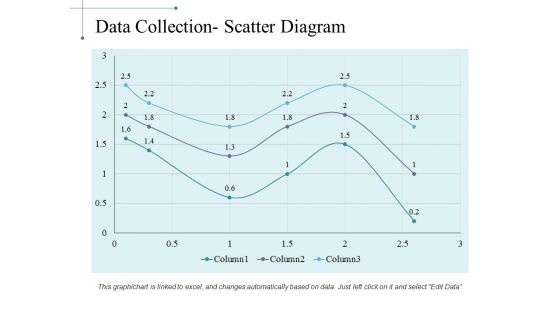
Data Collection Scatter Diagram Ppt PowerPoint Presentation Summary Deck
This is a data collection scatter diagram ppt powerpoint presentation summary deck. This is a three stage process. The stages in this process are business, marketing, strategy, finance, analysis.
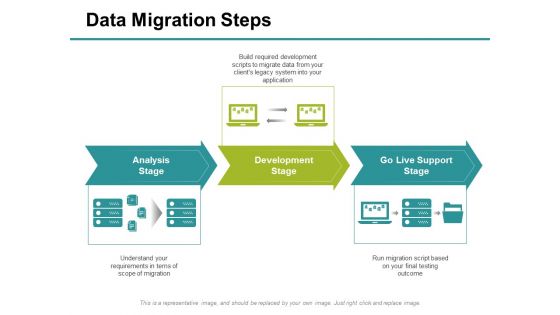
Data Migration Steps Ppt PowerPoint Presentation Slides Inspiration
This is a data migration steps ppt powerpoint presentation slides inspiration. This is a three stage process. The stages in this process are analysis stage, development stage, go live support stage, marketing, technology.

Data Mining And Clustering Infographics Ppt PowerPoint Presentation Portfolio Elements
This is a data mining and clustering infographics ppt powerpoint presentation portfolio elements. This is a seven stage process. The stages in this process are cluster analysis, cluster examination, cluster investigation.
Data Collection Histograms Ppt PowerPoint Presentation Icon Slides
This is a data collection histograms ppt powerpoint presentation icon slides. This is a two stage process. The stages in this process are bar chart, finance, marketing, business, analysis.
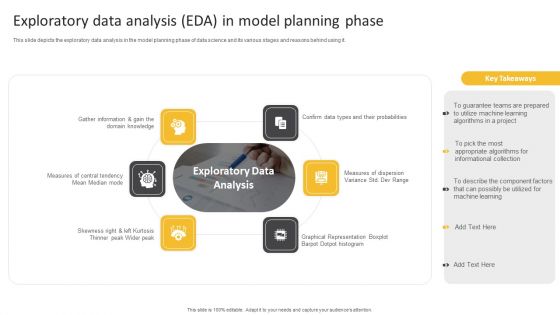
Information Science Exploratory Data Analysis EDA In Model Planning Phase Ppt PowerPoint Presentation Infographics Graphics Pictures PDF
This slide depicts the exploratory data analysis in the model planning phase of data science and its various stages and reasons behind using it.This is a Information Science Exploratory Data Analysis EDA In Model Planning Phase Ppt PowerPoint Presentation Infographics Graphics Pictures PDF template with various stages. Focus and dispense information on six stages using this creative set, that comes with editable features. It contains large content boxes to add your information on topics like Measures Dispersion, Graphical Representation, Skewness Right. You can also showcase facts, figures, and other relevant content using this PPT layout. Grab it now.
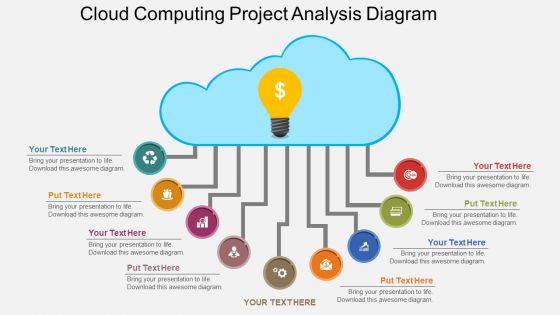
Cloud Computing Project Analysis Diagram Powerpoint Template
Our above PPT slide contains graphics of cloud with technology icons. This PowerPoint template may be used for project related to cloud computing. Use this diagram to impart more clarity to data and to create more sound impact on viewers.

Business Framework Cost Benefit Analysis PowerPoint Presentation
Multistage concentric circle diagram has been used to decorate this power point template slide. This PPT slide contains the core and layer style which can be used for displaying various data. This PPT slide is useful for any business and marketing process representation.
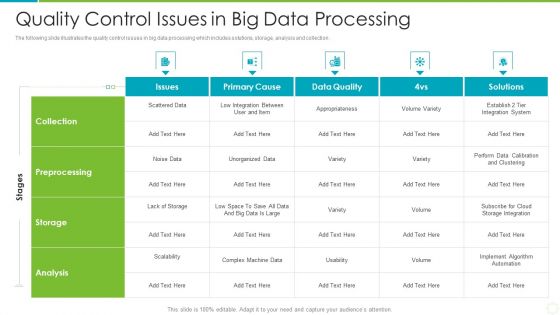
Quality Control Issues In Big Data Processing Themes PDF
The following slide illustrates the quality control issues in big data processing which includes solutions, storage, analysis and collection. Pitch your topic with ease and precision using this quality control issues in big data processing themes pdf. This layout presents information on preprocessing, storage, analysis. It is also available for immediate download and adjustment. So, changes can be made in the color, design, graphics or any other component to create a unique layout
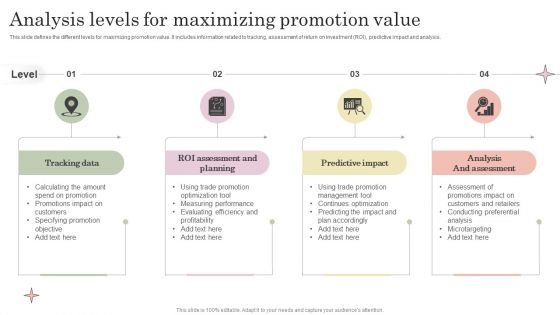
Analysis Levels For Maximizing Promotion Value Template PDF
This slide defines the different levels for maximizing promotion value. It includes information related to tracking, assessment of return on investment ROI, predictive impact and analysis. Persuade your audience using this Analysis Levels For Maximizing Promotion Value Template PDF. This PPT design covers four stages, thus making it a great tool to use. It also caters to a variety of topics including Tracking Data, Roi Assessment Planning, Predictive Impact. Download this PPT design now to present a convincing pitch that not only emphasizes the topic but also showcases your presentation skills.

E Commerce Corporate Accomplishments And Key Challenges Clipart PDF
The slide shows business highlights, industry challenges and solutions of a B2B business organization engaged in e commerce. It includes challenges like data security and competition. Persuade your audience using this E Commerce Corporate Accomplishments And Key Challenges Clipart PDF. This PPT design covers two stages, thus making it a great tool to use. It also caters to a variety of topics including Data Security, Website Design, Competitor Analysis. Download this PPT design now to present a convincing pitch that not only emphasizes the topic but also showcases your presentation skills.
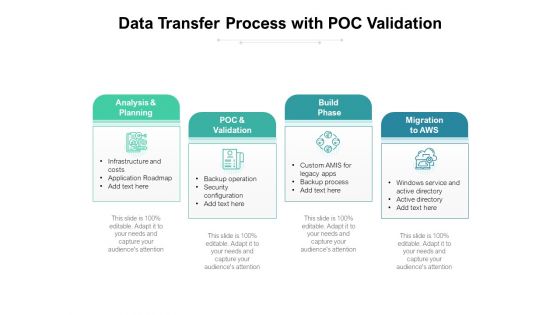
Data Transfer Process With POC Validation Ppt PowerPoint Presentation Gallery Influencers PDF
Presenting data transfer process with poc validation ppt powerpoint presentation gallery influencers pdf to dispense important information. This template comprises four stages. It also presents valuable insights into the topics including analysis, planning, validation. This is a completely customizable PowerPoint theme that can be put to use immediately. So, download it and address the topic impactfully.
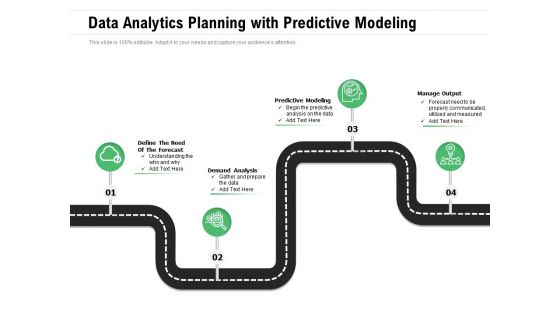
Data Analytics Planning With Predictive Modeling Ppt PowerPoint Presentation File Example Topics PDF
Presenting data analytics planning with predictive modeling ppt powerpoint presentation file example topics pdf to dispense important information. This template comprises four stages. It also presents valuable insights into the topics including analysis, communicated, predictive. This is a completely customizable PowerPoint theme that can be put to use immediately. So, download it and address the topic impactfully.
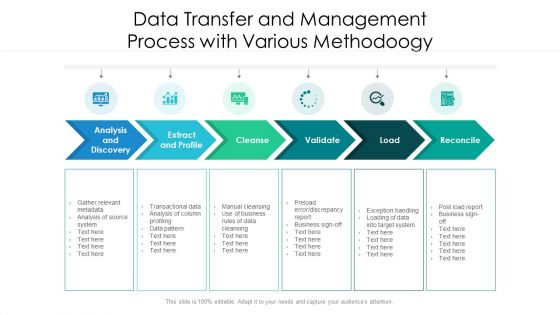
Data Transfer And Management Process With Various Methodoogy Ppt PowerPoint Presentation Layouts Layout Ideas PDF
Presenting data transfer and management process with various methodoogy ppt powerpoint presentation layouts layout ideas pdf to dispense important information. This template comprises six stages. It also presents valuable insights into the topics including analysis and discovery, extract and profile, cleanse. This is a completely customizable PowerPoint theme that can be put to use immediately. So, download it and address the topic impactfully.
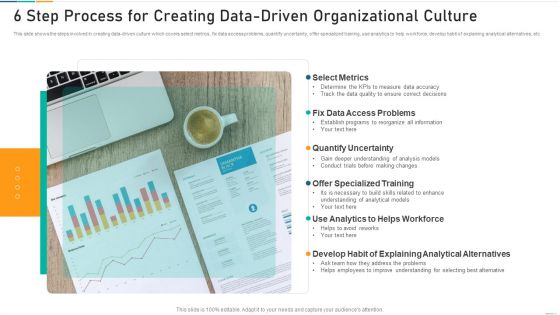
6 Step Process For Creating Data Driven Organizational Culture Background PDF
Presenting 6 step process for creating data driven organizational culture background pdf to dispense important information. This template comprises six stages. It also presents valuable insights into the topics including metrics, analysis, information. This is a completely customizable PowerPoint theme that can be put to use immediately. So, download it and address the topic impactfully.
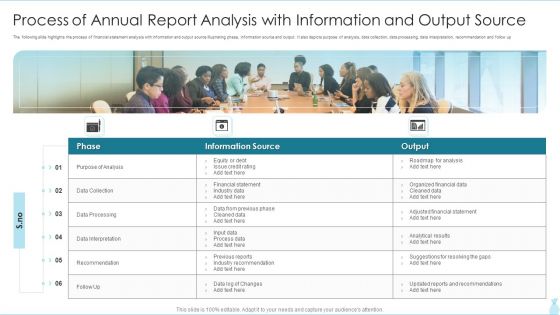
Process Of Annual Report Analysis With Information And Output Source Brochure PDF
The following slide highlights the process of financial statement analysis with information and output source illustrating phase, information source and output. It also depicts purpose of analysis, data collection, data processing, data interpretation, recommendation and follow up.Presenting Process Of Annual Report Analysis With Information And Output Source Brochure PDF to dispense important information. This template comprises six stages. It also presents valuable insights into the topics including Information Source, Financial Statement, Industry Data This is a completely customizable PowerPoint theme that can be put to use immediately. So, download it and address the topic impactfully.
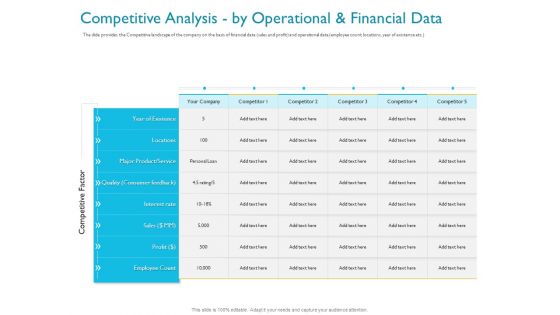
Investor Funding Deck For Hybrid Financing Competitive Analysis By Operational And Financial Data Ppt Pictures Rules PDF
The slide provides the Competitive landscape of the company on the basis of financial data sales and profit and operational data employee count, locations, year of existence etc. Deliver and pitch your topic in the best possible manner with this investor funding deck for hybrid financing competitive analysis by operational and financial data ppt pictures rules pdf. Use them to share invaluable insights on locations, sales, interest rate, major product, service, employee count, quality, consumer feedback and impress your audience. This template can be altered and modified as per your expectations. So, grab it now.

Investment Pitch To Generating Capital From Mezzanine Credit Competitive Analysis By Operational And Financial Data Inspiration PDF
The slide provides the Competitive landscape of the company on the basis of financial data sales and profit and operational data employee count, locations, year of existence etc. Deliver and pitch your topic in the best possible manner with this investment pitch to generating capital from mezzanine credit competitive analysis by operational and financial data inspiration pdf. Use them to share invaluable insights on competitive factor, year existence, locations, major product, service, quality consumer, interest rate and impress your audience. This template can be altered and modified as per your expectations. So, grab it now.

Investor Pitch Deck To Collect Capital From Subordinated Loan Competitive Analysis By Operational And Financial Data Diagrams PDF
The slide provides the Competitive landscape of the company on the basis of financial data sales and profit and operational data employee count, locations, year of existence etc. Deliver an awe-inspiring pitch with this creative investor pitch deck to collect capital from subordinated loan competitive analysis by operational and financial data diagrams pdf bundle. Topics like year existence, locations, major product service, interest rate, sales, employee count, profit can be discussed with this completely editable template. It is available for immediate download depending on the needs and requirements of the user.
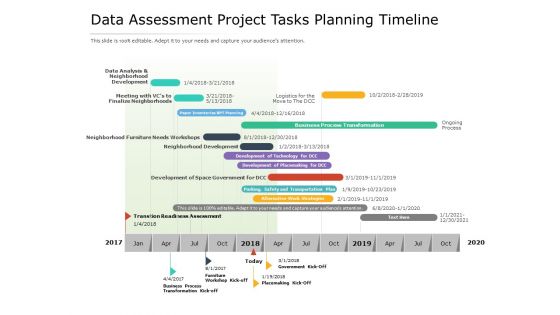
Data Assessment Project Tasks Planning Timeline Ppt PowerPoint Presentation Ideas Images PDF
Presenting data assessment project tasks planning timeline ppt powerpoint presentation ideas images pdf to dispense important information. This template comprises one stages. It also presents valuable insights into the topics including data analysis and neighborhood development, meeting with vcs to finalize neighborhoods, business process transformation, development of placemaking for dcc, business process transformation kick off, 2017 to 2020. This is a completely customizable PowerPoint theme that can be put to use immediately. So, download it and address the topic impactfully.

Industry Analysis Of Real Estate And Construction Sector Real Estate Price And Sales Historical Data Diagrams PDF
Deliver and pitch your topic in the best possible manner with this industry analysis of real estate and construction sector real estate price and sales historical data diagrams pdf. Use them to share invaluable insights on prices, sales and impress your audience. This template can be altered and modified as per your expectations. So, grab it now.

Key Industry Highlights For A Insurance Agency Business Building An Insurance Company Template Pdf
This slide provides a glimpse of industry highlights of the insurance agency market, which includes impact of new models and customized goods, automation and artificial intelligence, innovative analytics and initiative, InsureTech collaborations and the adoption of blockchain etc. Do you have to make sure that everyone on your team knows about any specific topic I yes, then you should give Key Industry Highlights For A Insurance Agency Business Building An Insurance Company Template Pdf a try. Our experts have put a lot of knowledge and effort into creating this impeccable Key Industry Highlights For A Insurance Agency Business Building An Insurance Company Template Pdf You can use this template for your upcoming presentations, as the slides are perfect to represent even the tiniest detail. You can download these templates from the Slidegeeks website and these are easy to edit. So grab these today.

Comparative Analysis Of Types Of Project Assessing Infographics PDF
This slide depicts the comparison of various types of project monitoring. It includes monitoring management, financial and program those compared based on areas, data collected, source, and usage. Presenting Comparative Analysis Of Types Of Project Assessing Infographics PDF to dispense important information. This template comprises three stages. It also presents valuable insights into the topics including Management, Finance, Program. This is a completely customizable PowerPoint theme that can be put to use immediately. So, download it and address the topic impactfully.

Eight Step Business Research Planning Tasks Diagrams PDF
Presenting eight step business research planning tasks diagrams pdf to dispense important information. This template comprises eight stages. It also presents valuable insights into the topics including analyze the data, develop instrumentation planning, collect data. This is a completely customizable PowerPoint theme that can be put to use immediately. So, download it and address the topic impactfully.
Recent BI Analysis Trends For Performance Enhancements Icons Pdf
This slide showcases the recent trends in BI analytics for business performance enhancement. This includes trends like augmented analytics, data discovery, data storytelling, Data quality management, etc. Pitch your topic with ease and precision using this Recent BI Analysis Trends For Performance Enhancements Icons Pdf. This layout presents information on Collaborative Business Intelligence, Embedded Analytics, Data Governance. It is also available for immediate download and adjustment. So, changes can be made in the color, design, graphics or any other component to create a unique layout.

Comprehensive Swot Analysis Of Laundry And Dry Laundromat Business Plan Go To Market Demonstration Pdf
Do you have to make sure that everyone on your team knows about any specific topic I yes, then you should give Comprehensive Swot Analysis Of Laundry And Dry Laundromat Business Plan Go To Market Demonstration Pdf a try. Our experts have put a lot of knowledge and effort into creating this impeccable Comprehensive Swot Analysis Of Laundry And Dry Laundromat Business Plan Go To Market Demonstration Pdf You can use this template for your upcoming presentations, as the slides are perfect to represent even the tiniest detail. You can download these templates from the Slidegeeks website and these are easy to edit. So grab these today.
Comprehensive Swot Analysis Of Laundry On Demand Laundry Business Plan Icons Pdf
Do you have to make sure that everyone on your team knows about any specific topic I yes, then you should give Comprehensive Swot Analysis Of Laundry On Demand Laundry Business Plan Icons Pdf a try. Our experts have put a lot of knowledge and effort into creating this impeccable Comprehensive Swot Analysis Of Laundry On Demand Laundry Business Plan Icons Pdf You can use this template for your upcoming presentations, as the slides are perfect to represent even the tiniest detail. You can download these templates from the Slidegeeks website and these are easy to edit. So grab these today.
Business Diagram Big Data Analysis From Feed Of Zeros And Ones 0s And 1s Magnifying Glass Ppt Slide
This PowerPoint template has been designed with graphic of magnifier on big data text. This magnifier is magnifying the binary data. This slide can be used to represent topics like binary, programming, coding etc.
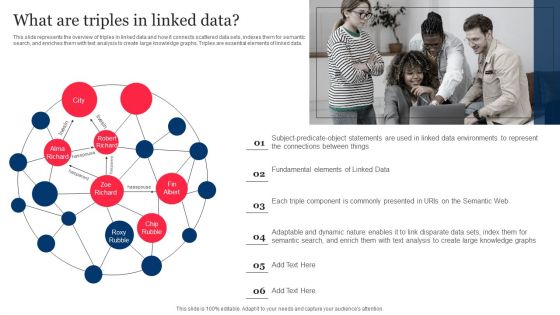
What Are Triples In Linked Data Integrating Linked Data To Enhance Operational Effectiveness Ideas PDF
This slide represents the overview of triples in linked data and how it connects scattered data sets, indexes them for semantic search, and enriches them with text analysis to create large knowledge graphs. Triples are essential elements of linked data.Explore a selection of the finest What Are Triples In Linked Data Integrating Linked Data To Enhance Operational Effectiveness Ideas PDF here. With a plethora of professionally designed and pre-made slide templates, you can quickly and easily find the right one for your upcoming presentation. You can use our What Are Triples In Linked Data Integrating Linked Data To Enhance Operational Effectiveness Ideas PDF to effectively convey your message to a wider audience. Slidegeeks has done a lot of research before preparing these presentation templates. The content can be personalized and the slides are highly editable. Grab templates today from Slidegeeks.

Toolkit For Data Science And Analytics Transition Value Stream Data Analytics Process Background PDF
This slide shows the step by step approach of data analytics project focusing on data gathering, consolidation and data analysis to build business insights for effective decision making. Find highly impressive Toolkit For Data Science And Analytics Transition Value Stream Data Analytics Process Background PDF on Slidegeeks to deliver a meaningful presentation. You can save an ample amount of time using these presentation templates. No need to worry to prepare everything from scratch because Slidegeeks experts have already done a huge research and work for you. You need to download Toolkit For Data Science And Analytics Transition Value Stream Data Analytics Process Background PDF for your upcoming presentation. All the presentation templates are 100 percent editable and you can change the color and personalize the content accordingly. Download now.

Competitive Analysis Using SWOT Model Designs PDF
and threats SWOT model of the most successful competitor. This model will assist businesses in developing effective business strategies to gain competitive edge. Boost your pitch with our creative Competitive Analysis Using SWOT Model Designs PDF. Deliver an awe inspiring pitch that will mesmerize everyone. Using these presentation templates you will surely catch everyones attention. You can browse the ppts collection on our website. We have researchers who are experts at creating the right content for the templates. So you do not have to invest time in any additional work. Just grab the template now and use them.

Data Advisory And Research Advisory Project Ppt PowerPoint Presentation File Slides PDF
This slide exhibits data collection consulting project which includes process, project scope, services and time taken to complete the project. It includes 4 major tasks like- defining project, data collection, data analysis and modelling. Presenting Data Advisory And Research Advisory Project Ppt PowerPoint Presentation File Slides PDF to dispense important information. This template comprises data advisory and research advisory project ppt powerpoint presentation file slides pdf stages. It also presents valuable insights into the topics including define project, data collection, data analysis, modelling. This is a completely customizable PowerPoint theme that can be put to use immediately. So, download it and address the topic impactfully.
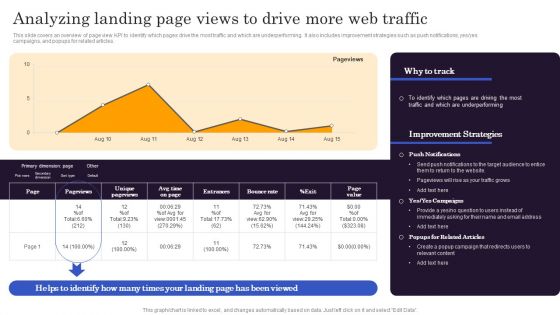
Marketers Guide To Data Analysis Optimization Analyzing Landing Page Views To Drive More Web Traffic Rules PDF
This slide covers an overview of page view KPI to identify which pages drive the most traffic and which are underperforming. It also includes improvement strategies such as push notifications, yes yes campaigns, and popups for related articles. Do you have an important presentation coming up Are you looking for something that will make your presentation stand out from the rest Look no further than Marketers Guide To Data Analysis Optimization Analyzing Landing Page Views To Drive More Web Traffic Rules PDF. With our professional designs, you can trust that your presentation will pop and make delivering it a smooth process. And with Slidegeeks, you can trust that your presentation will be unique and memorable. So why wait Grab Marketers Guide To Data Analysis Optimization Analyzing Landing Page Views To Drive More Web Traffic Rules PDF today and make your presentation stand out from the rest.
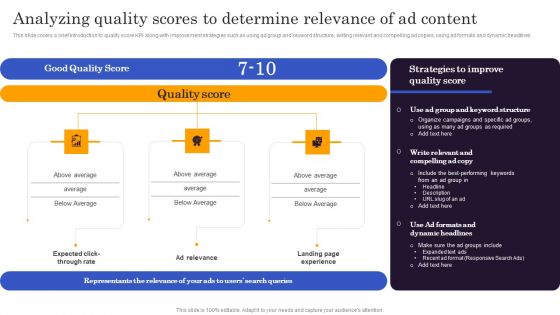
Marketers Guide To Data Analysis Optimization Analyzing Quality Scores To Determine Relevance Of Ad Content Diagrams PDF
This slide covers a brief introduction to quality score KPI along with improvement strategies such as using ad group and keyword structure, writing relevant and compelling ad copies, using ad formats and dynamic headlines. If you are looking for a format to display your unique thoughts, then the professionally designed Marketers Guide To Data Analysis Optimization Analyzing Quality Scores To Determine Relevance Of Ad Content Diagrams PDF is the one for you. You can use it as a Google Slides template or a PowerPoint template. Incorporate impressive visuals, symbols, images, and other charts. Modify or reorganize the text boxes as you desire. Experiment with shade schemes and font pairings. Alter, share or cooperate with other people on your work. Download Marketers Guide To Data Analysis Optimization Analyzing Quality Scores To Determine Relevance Of Ad Content Diagrams PDF and find out how to give a successful presentation. Present a perfect display to your team and make your presentation unforgettable.
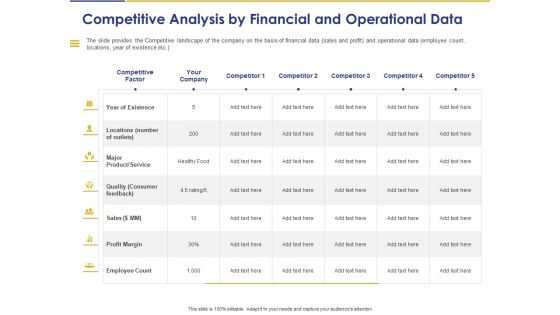
Convertible Note Pitch Deck Funding Strategy Competitive Analysis By Financial And Operational Data Ppt PowerPoint Presentation Styles Structure PDF
Presenting this set of slides with name convertible note pitch deck funding strategy competitive analysis by financial and operational data ppt powerpoint presentation styles structure pdf. The topics discussed in these slides are competitive factor, existence, locations, product service, quality consumer feedback, sales, profit marg, employee count. This is a completely editable PowerPoint presentation and is available for immediate download. Download now and impress your audience.

Data Analysis And Business Intelligence Framework With Tactical And Demand Focus Ppt PowerPoint Presentation Model Portfolio PDF
Persuade your audience using this data analysis and business intelligence framework with tactical and demand focus ppt powerpoint presentation model portfolio pdf. This PPT design covers five stages, thus making it a great tool to use. It also caters to a variety of topics including prescriptive analytics, diagnostic analytics, operational reporting. Download this PPT design now to present a convincing pitch that not only emphasizes the topic but also showcases your presentation skills.
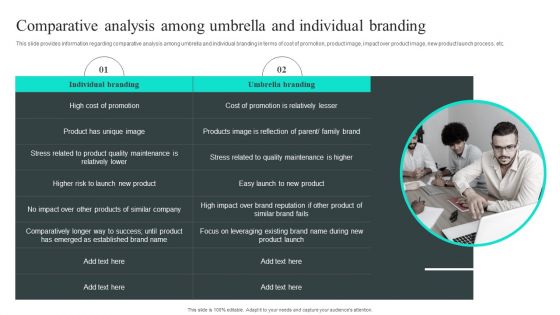
Comparative Analysis Among Umbrella And Individual Branding Rules PDF
This slide provides information regarding comparative analysis among umbrella and individual branding in terms of cost of promotion, product image, impact over product image, new product launch process, etc. Boost your pitch with our creative Comparative Analysis Among Umbrella And Individual Branding Rules PDF. Deliver an awe inspiring pitch that will mesmerize everyone. Using these presentation templates you will surely catch everyones attention. You can browse the ppts collection on our website. We have researchers who are experts at creating the right content for the templates. So you do not have to invest time in any additional work. Just grab the template now and use them.

Data Evaluation And Processing Toolkit Data Analytics Project Plan Lifecycle Background PDF
This slide shows the data analytics lifecycle covering multiple stages starting from presenting the business case to data identification, data validation, analysis and ending at data visualization and utilization of results. Are you in need of a template that can accommodate all of your creative concepts This one is crafted professionally and can be altered to fit any style. Use it with Google Slides or PowerPoint. Include striking photographs, symbols, depictions, and other visuals. Fill, move around, or remove text boxes as desired. Test out color palettes and font mixtures. Edit and save your work, or work with colleagues. Download Data Evaluation And Processing Toolkit Data Analytics Project Plan Lifecycle Background PDF and observe how to make your presentation outstanding. Give an impeccable presentation to your group and make your presentation unforgettable.

Data Evaluation And Processing Toolkit Data Analytics Value Stream Chain Microsoft PDF
This slide illustrates the series of activities required for analyzing the data. It contains information such as data preparation, exploratory analysis, and predictive analytics etc. Formulating a presentation can take up a lot of effort and time, so the content and message should always be the primary focus. The visuals of the PowerPoint can enhance the presenters message, so our Data Evaluation And Processing Toolkit Data Analytics Value Stream Chain Microsoft PDF was created to help save time. Instead of worrying about the design, the presenter can concentrate on the message while our designers work on creating the ideal templates for whatever situation is needed. Slidegeeks has experts for everything from amazing designs to valuable content, we have put everything into Data Evaluation And Processing Toolkit Data Analytics Value Stream Chain Microsoft PDF.
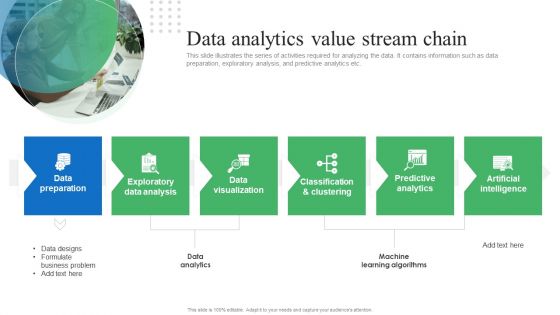
Toolkit For Data Science And Analytics Transition Data Analytics Value Stream Chain Pictures PDF
This slide illustrates the series of activities required for analyzing the data. It contains information such as data preparation, exploratory analysis, and predictive analytics etc. If you are looking for a format to display your unique thoughts, then the professionally designed Toolkit For Data Science And Analytics Transition Data Analytics Value Stream Chain Pictures PDF is the one for you. You can use it as a Google Slides template or a PowerPoint template. Incorporate impressive visuals, symbols, images, and other charts. Modify or reorganize the text boxes as you desire. Experiment with shade schemes and font pairings. Alter, share or cooperate with other people on your work. Download Toolkit For Data Science And Analytics Transition Data Analytics Value Stream Chain Pictures PDF and find out how to give a successful presentation. Present a perfect display to your team and make your presentation unforgettable.
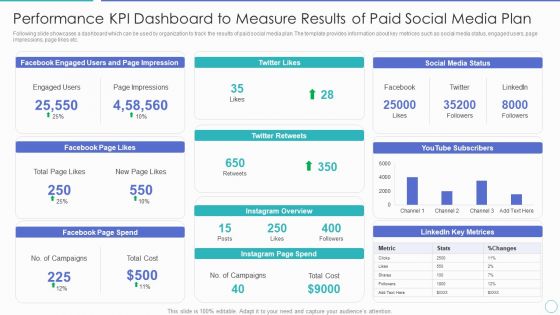
Performance KPI Dashboard To Measure Results Of Paid Social Media Plan Ppt PowerPoint Presentation Gallery Format Ideas PDF
Following slide showcases a dashboard which can be used by organization to track the results of paid social media plan. The template provides information about key metrices such as social media status, engaged users, page impressions, page likes etc. Pitch your topic with ease and precision using this performance kpi dashboard to measure results of paid social media plan ppt powerpoint presentation gallery format ideas pdf. This layout presents information on social media status, instagram page spend, facebook page spend, facebook page likes. It is also available for immediate download and adjustment. So, changes can be made in the color, design, graphics or any other component to create a unique layout.
Multistep Process To Gather Consumer Intelligence Data Ppt PowerPoint Presentation Icon Layouts PDF
Following slide highlights 3 step process which can be used to gather and analyze consumer intelligence data. The key steps are data collection, customer data analysis and actionable insights. Presenting Multistep Process To Gather Consumer Intelligence Data Ppt PowerPoint Presentation Icon Layouts PDF to dispense important information. This template comprises four stages. It also presents valuable insights into the topics including Data Collection, Customer Data Analysis, Actionable Insights. This is a completely customizable PowerPoint theme that can be put to use immediately. So, download it and address the topic impactfully.
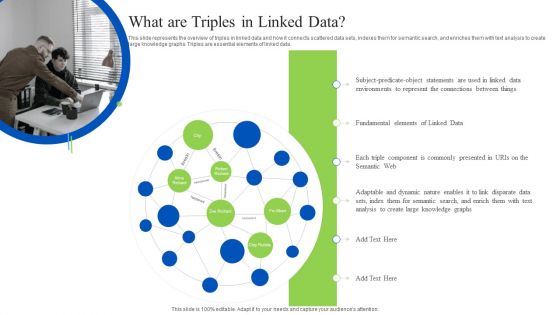
Linked Data Visualization What Are Triples In Linked Data Ppt Model Topics PDF
This slide represents the overview of triples in linked data and how it connects scattered data sets, indexes them for semantic search, and enriches them with text analysis to create large knowledge graphs. Triples are essential elements of linked data. Retrieve professionally designed Linked Data Visualization What Are Triples In Linked Data Ppt Model Topics PDF to effectively convey your message and captivate your listeners. Save time by selecting pre-made slideshows that are appropriate for various topics, from business to educational purposes. These themes come in many different styles, from creative to corporate, and all of them are easily adjustable and can be edited quickly. Access them as PowerPoint templates or as Google Slides themes. You dont have to go on a hunt for the perfect presentation because Slidegeeks got you covered from everywhere.
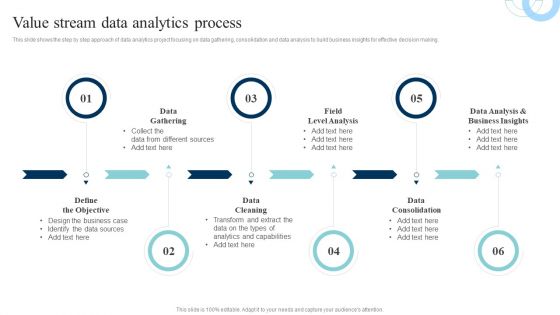
Data Evaluation And Processing Toolkit Value Stream Data Analytics Process Demonstration PDF
This slide shows the step by step approach of data analytics project focusing on data gathering, consolidation and data analysis to build business insights for effective decision making. Coming up with a presentation necessitates that the majority of the effort goes into the content and the message you intend to convey. The visuals of a PowerPoint presentation can only be effective if it supplements and supports the story that is being told. Keeping this in mind our experts created Data Evaluation And Processing Toolkit Value Stream Data Analytics Process Demonstration PDF to reduce the time that goes into designing the presentation. This way, you can concentrate on the message while our designers take care of providing you with the right template for the situation.
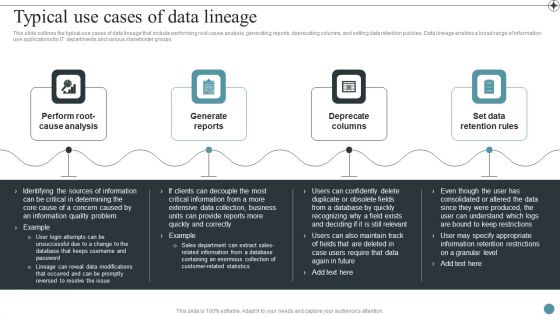
Typical Use Cases Of Data Lineage Deploying Data Lineage IT Mockup PDF
This slide outlines the typical use cases of data lineage that include performing root-cause analysis, generating reports, deprecating columns, and setting data retention policies. Data lineage enables a broad range of information use applications for IT departments and various stakeholder groups.Are you in need of a template that can accommodate all of your creative concepts This one is crafted professionally and can be altered to fit any style. Use it with Google Slides or PowerPoint. Include striking photographs, symbols, depictions, and other visuals. Fill, move around, or remove text boxes as desired. Test out color palettes and font mixtures. Edit and save your work, or work with colleagues. Download Typical Use Cases Of Data Lineage Deploying Data Lineage IT Mockup PDF and observe how to make your presentation outstanding. Give an impeccable presentation to your group and make your presentation unforgettable.

Data Governance IT Roadmap For Creating Data Stewardship Program Demonstration PDF
This slide describes the roadmap for creating a data stewardship program for the organization. It includes defining goals and achievement measures, analyzing the current situation and gap analysis, obtaining stakeholders approval, making and executing the plan, and maintaining and monitoring. This Data Governance IT Roadmap For Creating Data Stewardship Program Demonstration PDF is perfect for any presentation, be it in front of clients or colleagues. It is a versatile and stylish solution for organizing your meetings. The Data Governance IT Roadmap For Creating Data Stewardship Program Demonstration PDF features a modern design for your presentation meetings. The adjustable and customizable slides provide unlimited possibilities for acing up your presentation. Slidegeeks has done all the homework before launching the product for you. So, do not wait, grab the presentation templates today.

 Home
Home