Graph Icon

Data Analysis Excel Bar Graph To Compare PowerPoint Templates
Get The Domestics Right With Our data analysis excel bar graph to compare Powerpoint Templates. Create The Base For Thoughts To Grow.
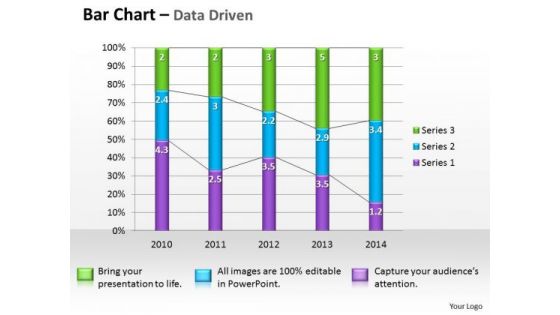
Microsoft Excel Data Analysis Bar Graph PowerPoint Templates
Double The Impact With Our microsoft excel data analysis bar graph Powerpoint Templates . Your Thoughts Will Have An Imposing Effect.
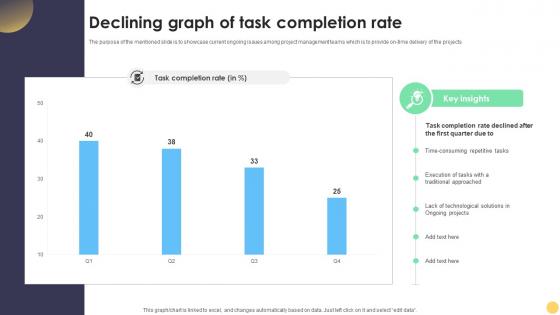
Digital Project Management Strategies Declining Graph Of Task Completion Rate
The purpose of the mentioned slide is to showcase current ongoing issues among project management teams which is to provide on-time delivery of the projects. From laying roadmaps to briefing everything in detail, our templates are perfect for you. You can set the stage with your presentation slides. All you have to do is download these easy-to-edit and customizable templates. Digital Project Management Strategies Declining Graph Of Task Completion Rate will help you deliver an outstanding performance that everyone would remember and praise you for. Do download this presentation today.
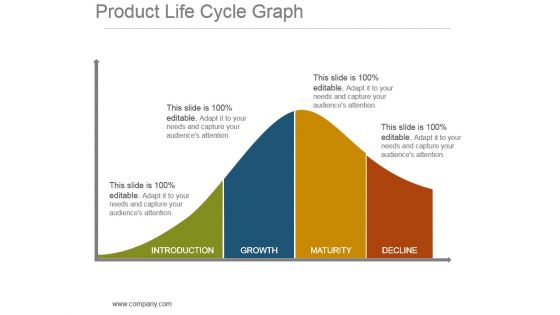
Product Life Cycle Graph Powerpoint Slide Background Image
This is a product life cycle graph powerpoint slide background image. This is a four stage process. The stages in this process are introduction, growth, maturity, decline.

Bar Graph Growth Success PowerPoint Templates And PowerPoint Themes 0712
Bar Graph Gowth Success PowerPoint Templates And PowerPoint Themes 0712-Microsoft Powerpoint Templates and Background with bar chart growth

Profits Bar Graph Finance PowerPoint Templates And PowerPoint Themes 0712
Profits Bar Graph Finance PowerPoint Templates And PowerPoint Themes 0712-Microsoft Powerpoint Templates and Background with profits bar chart
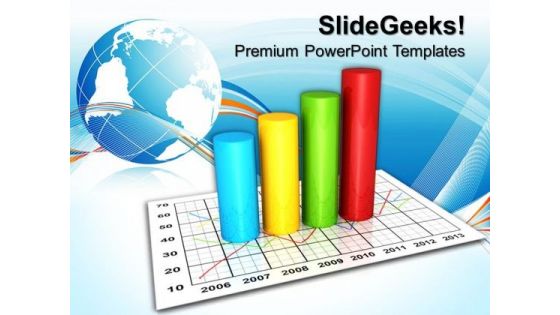
Products Sale Graph Business PowerPoint Templates And PowerPoint Themes 0812
Products Sale Graph Business PowerPoint Templates And PowerPoint Themes 0812-Microsoft Powerpoint Templates and Background with sales growth business chart

Graph Showing Total Operation Expenses By Quarter Themes PDF
This slide contains a graph showing the quarter wise operating expenses of an organization that will help the managers or directors of the company to make decisions for the betterment of an organization.Pitch your topic with ease and precision using this Graph Showing Total Operation Expenses By Quarter Themes PDF. This layout presents information on Operating Expenses, Equipment Purchase, Office Expansion. It is also available for immediate download and adjustment. So, changes can be made in the color, design, graphics or any other component to create a unique layout.

Cylinder Bar Graph Business PowerPoint Templates And PowerPoint Themes 0512
Microsoft Powerpoint Templates and Background with bar graph-Cylinder Bar Graph Business PowerPoint Templates And PowerPoint Themes 0512-These PowerPoint designs and slide layouts can be used for themes relating to -Bar graph,success, marketing, sales, business, finance

Cylinder Graph Business PowerPoint Templates And PowerPoint Themes 0512
Microsoft Powerpoint Templates and Background with bar graph-Cylinder Graph Business PowerPoint Templates And PowerPoint Themes 0512-These PowerPoint designs and slide layouts can be used for themes relating to -Bar graph,success, marketing, sales, business, finance
Cylinder Graph Success PowerPoint Templates And PowerPoint Themes 0512
Microsoft Powerpoint Templates and Background with bar graph-Cylinder Graph Success PowerPoint Templates And PowerPoint Themes 0512-These PowerPoint designs and slide layouts can be used for themes relating to -Bar graph,success, marketing, sales, business, finance

Business Framework Model Circular Procedure Graph Diagrams Marketing Diagram
Get The Doers Into Action. Activate Them With Our Business Framework Model Circular Procedure Graph Diagrams Marketing Diagram Powerpoint Templates.

Cost For Quality Graph Ppt PowerPoint Presentation Professional Diagrams
This is a cost for quality graph ppt powerpoint presentation professional diagrams. This is a four stage process. The stages in this process are quality graph, growth, business, management, strategy.
Recovery In Graph Success PowerPoint Themes And PowerPoint Slides 0511
Microsoft PowerPoint Theme and Slide with an orange arrow moving upwards over the year 2011 business graph
Percent Graph Marketing PowerPoint Templates And PowerPoint Themes 0512
Percent Graph Marketing PowerPoint Templates And PowerPoint Themes PPT designs-Microsoft Powerpoint Templates and Background with growing percents

Growing Percent Graph Success PowerPoint Templates And PowerPoint Themes 0612
Growing Percent Graph Success PowerPoint Templates And PowerPoint Themes Business-Microsoft Powerpoint Templates and Background with growing percents

Profit Graph Finance PowerPoint Templates And PowerPoint Themes 0612
Profit Graph Finance PowerPoint Templates And PowerPoint Themes Business-Microsoft Powerpoint Templates and Background with business success with arrow
Upward Arrow Graph Business PowerPoint Templates And PowerPoint Themes 0612
Upward Arrow Graph Business PowerPoint Templates And PowerPoint Themes Business-Microsoft Powerpoint Templates and Background with bars and red arrow
Arrow Graph Finance PowerPoint Templates And PowerPoint Themes 0612
Arrow Graph Finance PowerPoint Templates And PowerPoint Themes PPT Slides-Microsoft Powerpoint Templates and Background with bars and blue arrow

Bar Graph Finance PowerPoint Templates And PowerPoint Themes 0612
Bar Graph Finance PowerPoint Templates And PowerPoint Themes PPT Slides-Microsoft Powerpoint Templates and Background with business success with arrow
Business Graph Marketing PowerPoint Templates And PowerPoint Themes 0612
Business Graph Marketing PowerPoint Templates And PowerPoint Themes PPT Slides-Microsoft Powerpoint Templates and Background with business success with arrow
Arrow Bar Graph Business PowerPoint Templates And PowerPoint Themes 0612
Arrow Bar Graph Business PowerPoint Templates And PowerPoint Themes Business PPT Templates-Business success, finance, sales, success, business, arrows

Arrow Graph Business Globe PowerPoint Templates And PowerPoint Themes 0612
Arrow Graph Business Globe PowerPoint Templates And PowerPoint Themes Business PPT Templates-Bars and blue arrow, business, sale, shape, sign, success

Growth Bar Graph Finance PowerPoint Templates And PowerPoint Themes 0612
Growth Bar Graph Finance PowerPoint Templates And PowerPoint Themes Business PPT Templates-Growth ladder success, abstract, ladder, business, marketing, finance

Growth Bar Graph Success PowerPoint Templates And PowerPoint Themes 0612
Growth Bar Graph Success PowerPoint Templates And PowerPoint Themes Business PPT Templates-Growth ladder success, abstract, ladder, business, marketing, finance

Bar Graph Business PowerPoint Templates And PowerPoint Themes 0712
Bar Graph Business PowerPoint Templates And PowerPoint Themes 0712-Microsoft Powerpoint Templates and Background with business success with arrow

Arrow Graph Business Success PowerPoint Templates And PowerPoint Themes 0712
Arrow Graph Business Success PowerPoint Templates And PowerPoint Themes 0712-Microsoft Powerpoint Templates and Background with bars and arrow
Dollar Growth Graph Success PowerPoint Templates And PowerPoint Themes 0712
Dollar Growth Graph Success PowerPoint Templates And PowerPoint Themes 0712-Microsoft Powerpoint Templates and Background with dollar growth

Increasing Oil Prices Graph PowerPoint Templates And PowerPoint Themes 0912
Increasing Oil Prices Graph PowerPoint Templates And PowerPoint Themes 0912-Microsoft Powerpoint Templates and Background with oil barrels with increasing arrow

Career Graph Success PowerPoint Templates And PowerPoint Themes 0912
Career Graph Success PowerPoint Templates And PowerPoint Themes 0912-Microsoft Powerpoint Templates and Background with ladder of career
Business Graph Up PowerPoint Templates And PowerPoint Themes 1012
Business Graph Up PowerPoint Templates And PowerPoint Themes 1012-This PowerPoint Template shows the Bar Graph with increasing percentage which signifies the Financial Growth. The Template signifies the concept of Team Work, Team Leader etc. The structure of our templates allows you to effectively highlight the key issues concerning the growth of your business.-Business Graph Up PowerPoint Templates And PowerPoint Themes 1012-This PowerPoint template can be used for presentations relating to-Business graph, success, arrows, business, signs, shapes
Business Success Graph PowerPoint Templates And PowerPoint Themes 1012
Business Success Graph PowerPoint Templates And PowerPoint Themes 1012-The PowerPoint Template shows the Growing Percentage Graph with each letter of Success on each step. This template portrays the concepts of winning, leadership, Finance, Success, competition, sports, business, shapes, people and abstract.-Business Success Graph PowerPoint Templates And PowerPoint Themes 1012-This PowerPoint template can be used for presentations relating to-Business graph showing growth, success, business, finance, marketing, stairs
Growth Graph Moving Up PowerPoint Templates And PowerPoint Themes 1012
Growth Graph Moving Up PowerPoint Templates And PowerPoint Themes 1012-This PowerPoint Template shows the Bar Graph with increasing percentage which signifies the Financial Growth. The Template signifies the concept of Team Work, Team Leader etc. The structure of our templates allows you to effectively highlight the key issues concerning the growth of your business.-Growth Graph Moving Up PowerPoint Templates And PowerPoint Themes 1012-This PowerPoint template can be used for presentations relating to-Business graph with rising arrow, success, business, arrows, marketing, finance

Golden Bar Graph Success PowerPoint Templates And PowerPoint Themes 1012
Golden Bar Graph Success PowerPoint Templates And PowerPoint Themes 1012-Use this Above PowerPoint Template Displaying the Bar Graph in Horizontal Manner. It indicates beefing up, boost, buildup, crop, cultivation, enlargement, evolution, gain, heightening, hike, improvement, increase. Original thinking is the need of the hour. We provide the means to project your views.-Golden Bar Graph Success PowerPoint Templates And PowerPoint Themes 1012-This PowerPoint template can be used for presentations relating to-Business Graph, Business, Competition, Finance, Future, Technology
Graph Growth Business PowerPoint Templates And PowerPoint Themes 1012
Graph Growth Business PowerPoint Templates And PowerPoint Themes 1012-The PowerPoint Template shows the annual growth of business through bar graph. This template portrays the Business Concept. You can use this template to illustrate Global Issues. An excellent graphic to attract the attention of your audience to improve earnings. -Graph Growth Business PowerPoint Templates And PowerPoint Themes 1012-This PowerPoint template can be used for presentations relating to-Growth graph background, Marketing, Symbol, Business, Process and flows, Abstract
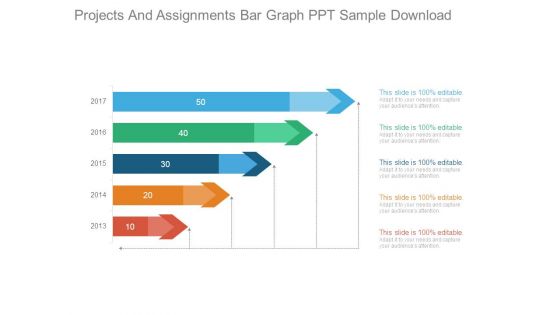
Projects And Assignments Bar Graph Ppt Sample Download
This is a projects and assignments bar graph ppt sample download. This is a five stage process. The stages in this process are business, process, marketing, strategy, graph chart, management.
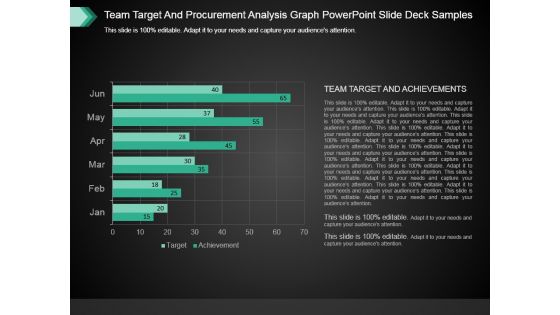
Team Target And Procurement Analysis Graph Powerpoint Slide Deck Samples
This is a team target and procurement analysis graph powerpoint slide deck samples. This is a six stage process. The stages in this process are graph chart, business, success, strategy, management.

Pie Graph Layer Of Marketing Expenditure Themes PDF
Pitch your topic with ease and precision using this pie graph layer of marketing expenditure themes pdf. This layout presents information on online advertising, trade shows, sales training, catalogs and brochures. It is also available for immediate download and adjustment. So, changes can be made in the color, design, graphics or any other component to create a unique layout.

Pie Graph Layer Of Organizational Report Themes PDF
Pitch your topic with ease and precision using this pie graph layer of organizational report themes pdf. This layout presents information on revenues increased by, business growth and expansion, customer traffic increased by. It is also available for immediate download and adjustment. So, changes can be made in the color, design, graphics or any other component to create a unique layout.
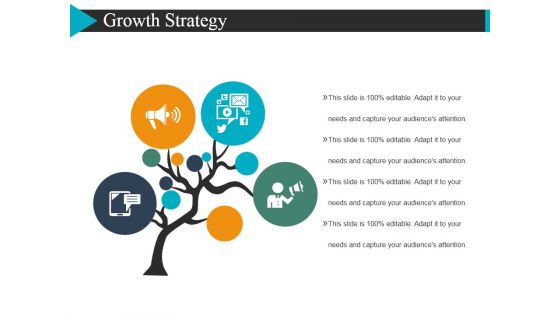
Growth Strategy Template 2 Ppt Powerpoint Presentation Diagram Graph Charts
This is a growth strategy template 2 ppt powerpoint presentation diagram graph charts. This is a four stage process. The stages in this process are tree, marketing, business, icons.
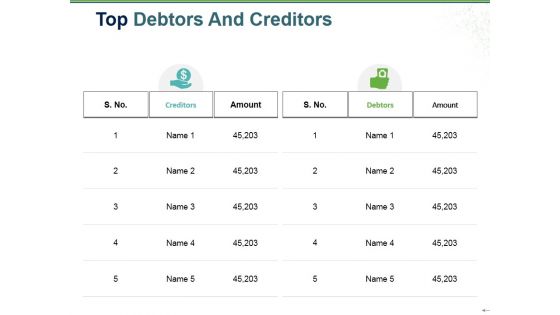
Top Debtors And Creditors Ppt PowerPoint Presentation Diagram Graph Charts
This is a top debtors and creditors ppt powerpoint presentation diagram graph charts. This is a five stage process. The stages in this process are amount, creditors, debtors, icons, strategy.

Our Services Template 2 Ppt PowerPoint Presentation Diagram Graph Charts
This is a our services template 2 ppt powerpoint presentation diagram graph charts. This is a four stage process. The stages in this process are business, digital advertising, digital care package, security maintenance, marketing and analytics, marketing, icons.

Non Performing Assets Loans Graph Ppt Model Slide Portrait
This slide Provides the graph of historical and Forecasted Non-Performing Assets Loans in persent for the period 2015 to 2023 and the Strategies used by the company to reduce NPA over that period.Deliver and pitch your topic in the best possible manner with this non performing assets loans graph ppt model slide portrait. Use them to share invaluable insights on non performing assets, 2015 to 2023 and impress your audience. This template can be altered and modified as per your expectations. So, grab it now.
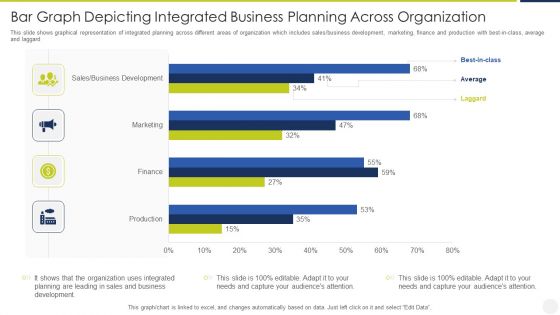
Bar Graph Depicting Integrated Business Planning Across Organization Designs PDF
This slide shows graphical representation of integrated planning across different areas of organization which includes sales or business development, marketing, finance and production with best in class, average and laggard Showcasing this set of slides titled bar graph depicting integrated business planning across organization designs pdf. The topics addressed in these templates are bar graph depicting integrated business planning across organization. All the content presented in this PPT design is completely editable. Download it and make adjustments in color, background, font etc. as per your unique business setting.

Workforce Department Performance Graph Ppt Model Graphics Pictures PDF
This slide shows performance graph of HR department. Information covered in this slide is related to total hirings and turnover in the last four years. Pitch your topic with ease and precision using this Workforce Department Performance Graph Ppt Model Graphics Pictures PDF. This layout presents information on New Hiring, Continuous Increase, Employee Turnover, 2019 To 2022. It is also available for immediate download and adjustment. So, changes can be made in the color, design, graphics or any other component to create a unique layout.

Graph For Global Human Resource Employees Salary Trends Demonstration PDF
This slide showcases graph that can help to study the salary trends of HR employees and formulate compensation strategies according to industry standards. Its key components are minimum, average and maximum salary. Showcasing this set of slides titled Graph For Global Human Resource Employees Salary Trends Demonstration PDF. The topics addressed in these templates are Global Human Resource, Employees Salary Trends. All the content presented in this PPT design is completely editable. Download it and make adjustments in color, background, font etc. as per your unique business setting.
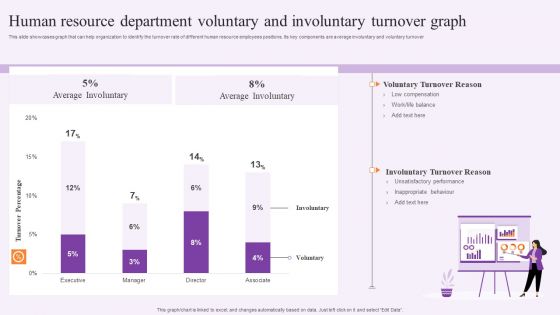
Human Resource Department Voluntary And Involuntary Turnover Graph Summary PDF
This slide showcases graph that can help organization to identify the turnover rate of different human resource employees positions. Its key components are average involuntary and voluntary turnover. Pitch your topic with ease and precision using this Human Resource Department Voluntary And Involuntary Turnover Graph Summary PDF. This layout presents information on Executive, Voluntary Turnover Reason, Average Involuntary. It is also available for immediate download and adjustment. So, changes can be made in the color, design, graphics or any other component to create a unique layout.

Business Operational Expenditure Bar Graph With Annual Variances Brochure PDF
This slide showcases operating expenditure OPEX bar graph with annual variances assisting companies in controlling the difference of allocated budgets. It also includes information about planned expenses, actual expenses, marketing costs, office costs, employee costs, training, etc. Showcasing this set of slides titled Business Operational Expenditure Bar Graph With Annual Variances Brochure PDF. The topics addressed in these templates are Employee Costs, Planned Expenses, Training Costs. All the content presented in this PPT design is completely editable. Download it and make adjustments in color, background, font etc. as per your unique business setting.

Retail B2C Ecommerce Selling Forecasts Graph Portrait PDF
This slide depicts sales projections for both retail and ecommerce stores. It includes sales projections for brick and mortar and retail ecommerce stores for period of six years. Pitch your topic with ease and precision using this Retail B2C Ecommerce Selling Forecasts Graph Portrait PDF. This layout presents information on Retail B2C Ecommerce, Selling Forecasts Graph. It is also available for immediate download and adjustment. So, changes can be made in the color, design, graphics or any other component to create a unique layout.
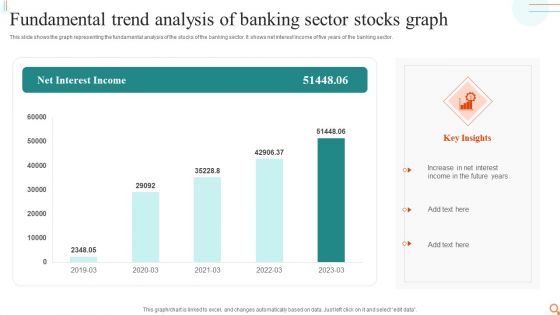
Fundamental Trend Analysis Of Banking Sector Stocks Graph Mockup PDF
This slide shows the graph representing the fundamental analysis of the stocks of the banking sector. It shows net interest income of five years of the banking sector.Pitch your topic with ease and precision using this Fundamental Trend Analysis Of Banking Sector Stocks Graph Mockup PDF. This layout presents information on Increase Interest, Income Future, Interest Income. It is also available for immediate download and adjustment. So, changes can be made in the color, design, graphics or any other component to create a unique layout.
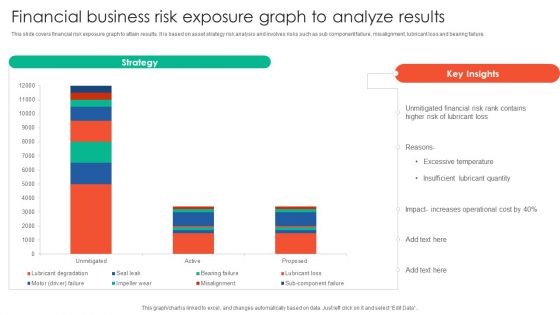
Financial Business Risk Exposure Graph To Analyze Results Elements PDF
This slide covers financial risk exposure graph to attain results. It is based on asset strategy risk analysis and involves risks such as sub component failure, misalignment, lubricant loss and bearing failure. Pitch your topic with ease and precision using this Financial Business Risk Exposure Graph To Analyze Results Elements PDF. This layout presents information on Strategy, Unmitigated Financial, Risk Rank Contains. It is also available for immediate download and adjustment. So, changes can be made in the color, design, graphics or any other component to create a unique layout.

Edtech Service Launch And Promotion Plan Custom Graph Portrait PDF
Here you can discover an assortment of the finest PowerPoint and Google Slides templates. With these templates, you can create presentations for a variety of purposes while simultaneously providing your audience with an eye catching visual experience. Download Edtech Service Launch And Promotion Plan Custom Graph Portrait PDF to deliver an impeccable presentation. These templates will make your job of preparing presentations much quicker, yet still, maintain a high level of quality. Slidegeeks has experienced researchers who prepare these templates and write high quality content for you. Later on, you can personalize the content by editing the Edtech Service Launch And Promotion Plan Custom Graph Portrait PDF.

Monthly Sites Sales Performance Assessment Graph Designs PDF
Mentioned slide shows comparative assessment of various business sites to determine best performance location. It includes elements such as targeted sales, actual sales and monthly wise sales on sites. Pitch your topic with ease and precision using this Monthly Sites Sales Performance Assessment Graph Designs PDF. This layout presents information on Sales Performance, Sales Targets, Performance Assessment Graph . It is also available for immediate download and adjustment. So, changes can be made in the color, design, graphics or any other component to create a unique layout.
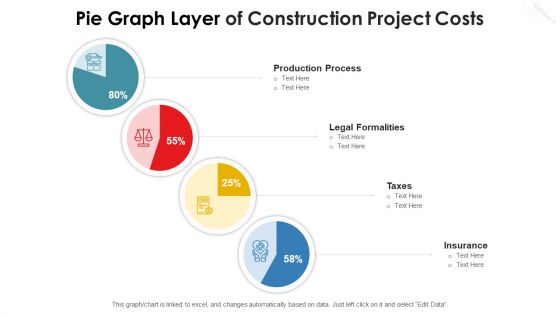
Pie Graph Layer Of Construction Project Costs Diagrams PDF
Showcasing this set of slides titled pie graph layer of construction project costs diagrams pdf. The topics addressed in these templates are production process, taxes, legal formalities, insurance. All the content presented in this PPT design is completely editable. Download it and make adjustments in color, background, font etc. as per your unique business setting.
Magnifier With Tools Bar Graph Ppt PowerPoint Presentation Professional
This is a magnifier with tools bar graph ppt powerpoint presentation professional. This is a four stage process. The stages in this process are magnifier, business, marketing, strategy, icons.
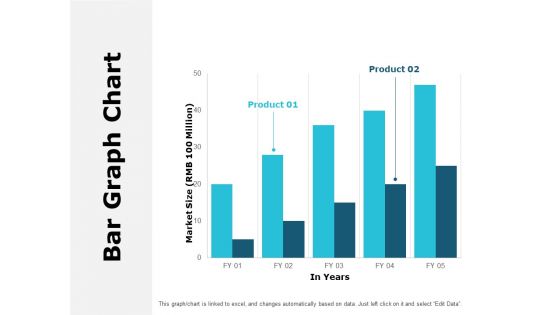
Bar Graph Chart Analysis Ppt PowerPoint Presentation Outline Good
Presenting this set of slides with name bar graph chart analysis ppt powerpoint presentation outline good. The topics discussed in these slides are finance, marketing, management, investment, analysis. This is a completely editable PowerPoint presentation and is available for immediate download. Download now and impress your audience.
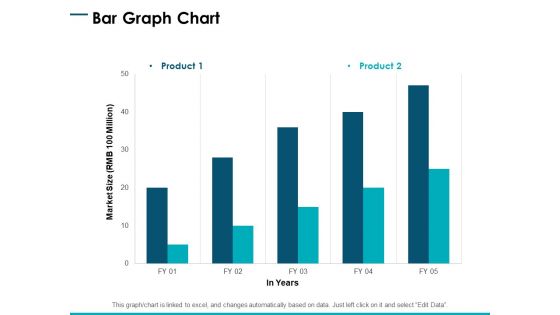
Bar Graph Chart Analysis Ppt PowerPoint Presentation Gallery Objects
Presenting this set of slides with name bar graph chart analysis ppt powerpoint presentation gallery objects. The topics discussed in these slides are finance, marketing, management, investment, analysis. This is a completely editable PowerPoint presentation and is available for immediate download. Download now and impress your audience.

Stock Photo Bar Graph With Percentage For Finance PowerPoint Slide
This Power Point template has been designed with graphic of bar graph and percentage value. This image slide contains the concept of finance and accounting. Use this editable diagram for your business and finance related presentations.
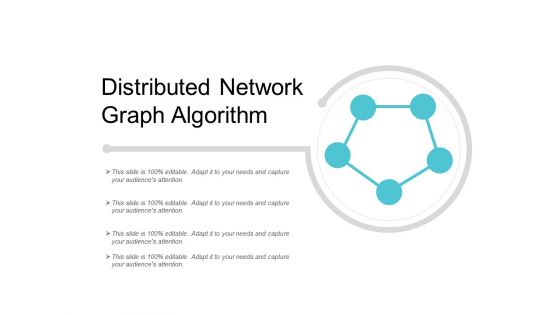
Distributed Network Graph Algorithm Ppt Powerpoint Presentation Outline Master Slide
This is a distributed network graph algorithm ppt powerpoint presentation outline master slide. This is a four stage process. The stages in this process are scatter plot, probability plots, plot diagram.

Plotting Line Graph Ppt Powerpoint Presentation Styles Maker
This is a plotting line graph ppt powerpoint presentation styles maker. This is a five stage process. The stages in this process are scatter plot, probability plots, plot diagram.

 Home
Home