Google Analytics
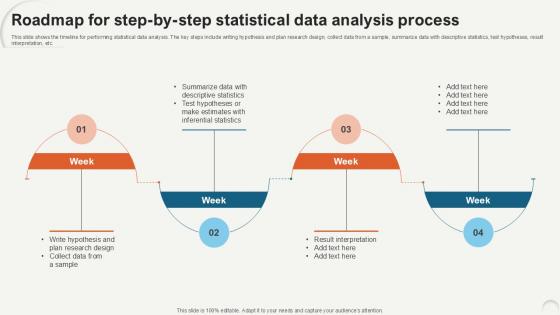
Roadmap For Step By Step Statistical Data Analytics For Informed Decision Ppt PowerPoint
This slide shows the timeline for performing statistical data analysis. The key steps include writing hypothesis and plan research design, collect data from a sample, summarize data with descriptive statistics, test hypotheses, result interpretation, etc. Retrieve professionally designed Roadmap For Step By Step Statistical Data Analytics For Informed Decision Ppt PowerPoint to effectively convey your message and captivate your listeners. Save time by selecting pre-made slideshows that are appropriate for various topics, from business to educational purposes. These themes come in many different styles, from creative to corporate, and all of them are easily adjustable and can be edited quickly. Access them as PowerPoint templates or as Google Slides themes. You do not have to go on a hunt for the perfect presentation because Slidegeeks got you covered from everywhere.
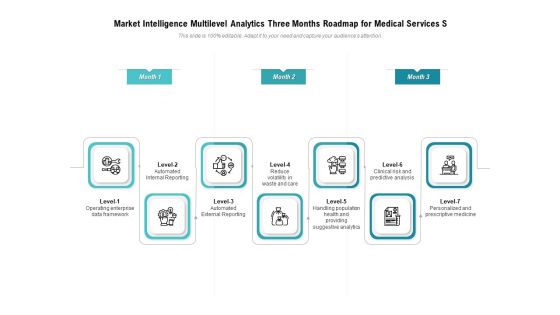
Market Intelligence Multilevel Analytics Three Months Roadmap For Medical Services Structure
Presenting our jaw dropping market intelligence multilevel analytics three months roadmap for medical services structure. You can alternate the color, font size, font type, and shapes of this PPT layout according to your strategic process. This PPT presentation is compatible with Google Slides and is available in both standard screen and widescreen aspect ratios. You can also download this well researched PowerPoint template design in different formats like PDF, JPG, and PNG. So utilize this visually appealing design by clicking the download button given below.

Table Of Contents Tools For HR Business Analytics Application In HR Ppt Ideas Gridlines PDF
Do you know about Slidesgeeks Table Of Contents Tools For HR Business Analytics Application In HR Ppt Ideas Gridlines PDF These are perfect for delivering any kind od presentation. Using it, create PowerPoint presentations that communicate your ideas and engage audiences. Save time and effort by using our pre-designed presentation templates that are perfect for a wide range of topic. Our vast selection of designs covers a range of styles, from creative to business, and are all highly customizable and easy to edit. Download as a PowerPoint template or use them as Google Slides themes.

Table Of Contents Developing Strategic Insights Using Big Data Analytics Across Business Sectors
Retrieve professionally designed Table Of Contents Developing Strategic Insights Using Big Data Analytics Across Business Sectors to effectively convey your message and captivate your listeners. Save time by selecting pre-made slideshows that are appropriate for various topics, from business to educational purposes. These themes come in many different styles, from creative to corporate, and all of them are easily adjustable and can be edited quickly. Access them as PowerPoint templates or as Google Slides themes. You do not have to go on a hunt for the perfect presentation because Slidegeeks got you covered from everywhere.
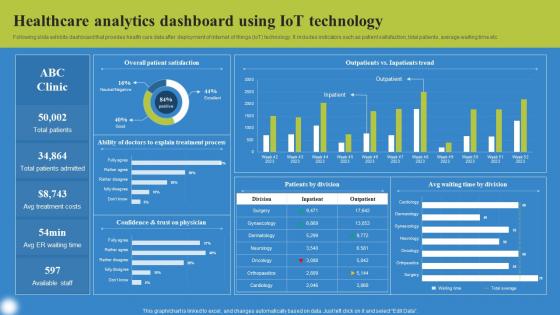
Healthcare Analytics Dashboard Using Deploying IoT Solutions For Enhanced Healthcare Background Pdf
Following slide exhibits dashboard that provides health care data after deployment of internet of things IoT technology. It includes indicators such as patient satisfaction, total patients, average waiting time etc. Do you know about Slidesgeeks Healthcare Analytics Dashboard Using Deploying IoT Solutions For Enhanced Healthcare Background Pdf These are perfect for delivering any kind od presentation. Using it, create PowerPoint presentations that communicate your ideas and engage audiences. Save time and effort by using our pre designed presentation templates that are perfect for a wide range of topic. Our vast selection of designs covers a range of styles, from creative to business, and are all highly customizable and easy to edit. Download as a PowerPoint template or use them as Google Slides themes.
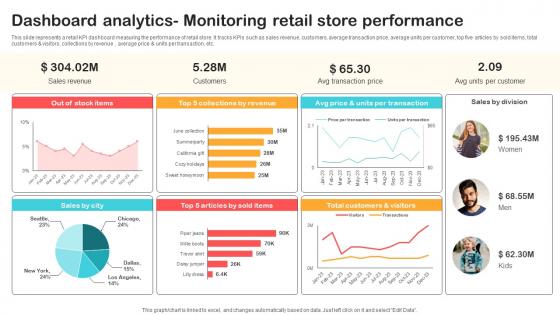
Dashboard Analytics Monitoring Retail Store Performance Optimizing Retail Operations With Digital DT SS V
This slide represents a retail KPI dashboard measuring the performance of retail store. It tracks KPIs such as sales revenue, customers, average transaction price, average units per customer, top five articles by sold items, total customers and visitors, collections by revenue , average price and units per transaction, etc.Are you in need of a template that can accommodate all of your creative concepts This one is crafted professionally and can be altered to fit any style. Use it with Google Slides or PowerPoint. Include striking photographs, symbols, depictions, and other visuals. Fill, move around, or remove text boxes as desired. Test out color palettes and font mixtures. Edit and save your work, or work with colleagues. Download Dashboard Analytics Monitoring Retail Store Performance Optimizing Retail Operations With Digital DT SS V and observe how to make your presentation outstanding. Give an impeccable presentation to your group and make your presentation unforgettable.
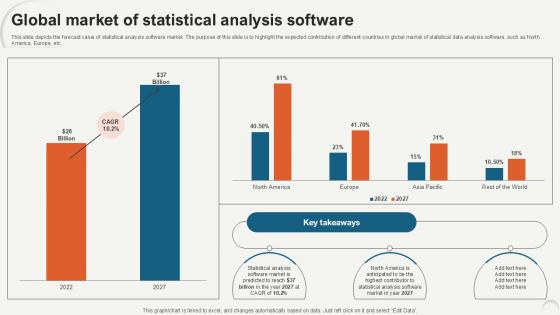
Global Market Of Statistical Data Analytics For Informed Decision Ppt PowerPoint
This slide depicts the forecast value of statistical analysis software market. The purpose of this slide is to highlight the expected contribution of different countries in global market of statistical data analysis software, such as North America, Europe, etc. Are you in need of a template that can accommodate all of your creative concepts This one is crafted professionally and can be altered to fit any style. Use it with Google Slides or PowerPoint. Include striking photographs, symbols, depictions, and other visuals. Fill, move around, or remove text boxes as desired. Test out color palettes and font mixtures. Edit and save your work, or work with colleagues. Download Global Market Of Statistical Data Analytics For Informed Decision Ppt PowerPoint and observe how to make your presentation outstanding. Give an impeccable presentation to your group and make your presentation unforgettable.
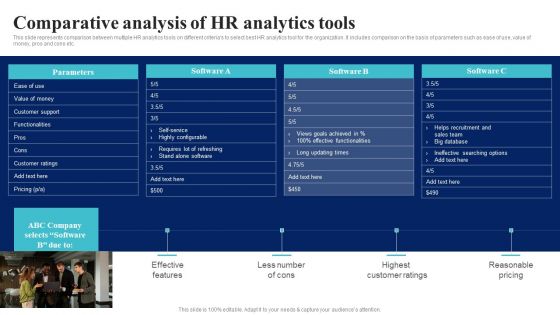
BI Implementation To Enhance Hiring Process Comparative Analysis Of Hr Analytics Tools Rules PDF
This slide represents comparison between multiple HR analytics tools on different criterias to select best HR analytics tool for the organization. It includes comparison on the basis of parameters such as ease of use, value of money, pros and cons etc.If you are looking for a format to display your unique thoughts, then the professionally designed BI Implementation To Enhance Hiring Process Comparative Analysis Of Hr Analytics Tools Rules PDF is the one for you. You can use it as a Google Slides template or a PowerPoint template. Incorporate impressive visuals, symbols, images, and other charts. Modify or reorganize the text boxes as you desire. Experiment with shade schemes and font pairings. Alter, share or cooperate with other people on your work. Download BI Implementation To Enhance Hiring Process Comparative Analysis Of Hr Analytics Tools Rules PDF and find out how to give a successful presentation. Present a perfect display to your team and make your presentation unforgettable.

Data Lake Implementation Essential Elements Of Data Lake And Analytics Solution Brochure PDF
This slide describes the essential elements of data lake and analytics solution including data movement, analytics, machine learning, and securely store, and cataloging data. If you are looking for a format to display your unique thoughts, then the professionally designed Data Lake Implementation Essential Elements Of Data Lake And Analytics Solution Brochure PDF is the one for you. You can use it as a Google Slides template or a PowerPoint template. Incorporate impressive visuals, symbols, images, and other charts. Modify or reorganize the text boxes as you desire. Experiment with shade schemes and font pairings. Alter, share or cooperate with other people on your work. Download Data Lake Implementation Essential Elements Of Data Lake And Analytics Solution Brochure PDF and find out how to give a successful presentation. Present a perfect display to your team and make your presentation unforgettable.
Marketing Success Metrics Introduction To Email Analytics For Tracking Sample PDF
This slide covers an email analytics overview to identify how subscribers interact with your email campaigns. It also includes steps to email analytics, such as checking kpis regularly, reflecting on numbers, refining customer profiles, building better lead-generation campaigns, etc. Here you can discover an assortment of the finest PowerPoint and Google Slides templates. With these templates, you can create presentations for a variety of purposes while simultaneously providing your audience with an eye-catching visual experience. Download Marketing Success Metrics Introduction To Email Analytics For Tracking Sample PDF to deliver an impeccable presentation. These templates will make your job of preparing presentations much quicker, yet still, maintain a high level of quality. Slidegeeks has experienced researchers who prepare these templates and write high-quality content for you. Later on, you can personalize the content by editing the Marketing Success Metrics Introduction To Email Analytics For Tracking Sample PDF.

Projection Model Difference Between Four Types Of Advanced Analytics Portrait PDF
This slide represents the difference between the main types of advanced analytics, and it includes diagnostic, descriptive, predictive, and prescriptive analytics. The four major categories of advanced analytics share certain commonalities but are distinguished mostly by their distinctions. Are you in need of a template that can accommodate all of your creative concepts This one is crafted professionally and can be altered to fit any style. Use it with Google Slides or PowerPoint. Include striking photographs, symbols, depictions, and other visuals. Fill, move around, or remove text boxes as desired. Test out color palettes and font mixtures. Edit and save your work, or work with colleagues. Download Projection Model Difference Between Four Types Of Advanced Analytics Portrait PDF and observe how to make your presentation outstanding. Give an impeccable presentation to your group and make your presentation unforgettable.

Projection Model Uses And Benefits Of Predictive Analytics In Manufacturing Topics PDF
This slide talks about using predictive analytics in manufacturing forecasting for optimal use of resources. The use cases include predictive maintenance analytics, quality, predictive demand, and workforce analytics. Are you in need of a template that can accommodate all of your creative concepts This one is crafted professionally and can be altered to fit any style. Use it with Google Slides or PowerPoint. Include striking photographs, symbols, depictions, and other visuals. Fill, move around, or remove text boxes as desired. Test out color palettes and font mixtures. Edit and save your work, or work with colleagues. Download Projection Model Uses And Benefits Of Predictive Analytics In Manufacturing Topics PDF and observe how to make your presentation outstanding. Give an impeccable presentation to your group and make your presentation unforgettable.
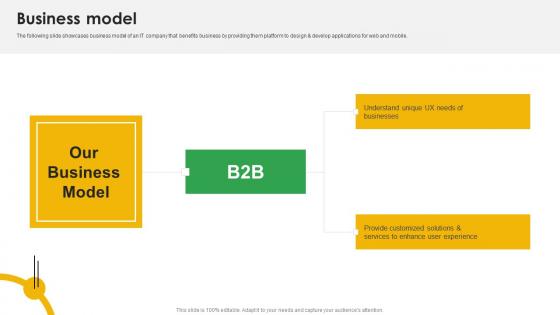
Business Model Mobile App Analytics Company Fund Raising Pitch Deck Formats Pdf
The following slide showcases business model of an IT company that benefits business by providing them platform to design and develop applications for web and mobile. Retrieve professionally designed Business Model Mobile App Analytics Company Fund Raising Pitch Deck Formats Pdf to effectively convey your message and captivate your listeners. Save time by selecting pre made slideshows that are appropriate for various topics, from business to educational purposes. These themes come in many different styles, from creative to corporate, and all of them are easily adjustable and can be edited quickly. Access them as PowerPoint templates or as Google Slides themes. You do not have to go on a hunt for the perfect presentation because Slidegeeks got you covered from everywhere.
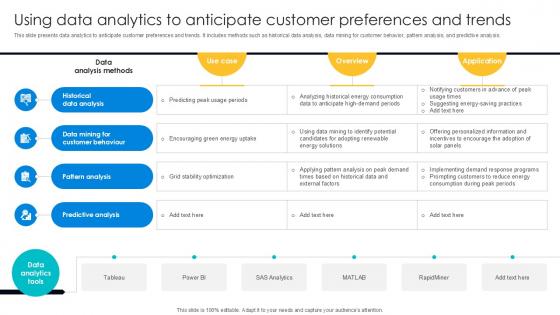
Using Data Analytics To Anticipate Digital Transformation Journey PPT PowerPoint DT SS V
This slide presents data analytics to anticipate customer preferences and trends. It includes methods such as historical data analysis, data mining for customer behavior, pattern analysis, and predictive analysis. Here you can discover an assortment of the finest PowerPoint and Google Slides templates. With these templates, you can create presentations for a variety of purposes while simultaneously providing your audience with an eye-catching visual experience. Download Historical Data Analysis, Data Mining For Customer Behaviour, Pattern Analysis to deliver an impeccable presentation. These templates will make your job of preparing presentations much quicker, yet still, maintain a high level of quality. Slidegeeks has experienced researchers who prepare these templates and write high-quality content for you. Later on, you can personalize the content by editing the Historical Data Analysis, Data Mining For Customer Behaviour, Pattern Analysis.
BI Technique For Data Informed Decisions Global Market Landscape Of Sap Analytics Cloud Suite Icons PDF
The purpose of this slide is to showcase the global market landscape of SAP analytics cloud as BI tool. It also contains information regarding the business intelligence BI software market share and SAP analytics cloud customers by industry. Are you in need of a template that can accommodate all of your creative concepts This one is crafted professionally and can be altered to fit any style. Use it with Google Slides or PowerPoint. Include striking photographs, symbols, depictions, and other visuals. Fill, move around, or remove text boxes as desired. Test out color palettes and font mixtures. Edit and save your work, or work with colleagues. Download BI Technique For Data Informed Decisions Global Market Landscape Of Sap Analytics Cloud Suite Icons PDF and observe how to make your presentation outstanding. Give an impeccable presentation to your group and make your presentation unforgettable.

How To Bridge Business Intelligence And Predictive Analytics Challenges Mockup PDF
This template depicts that with interactive BI visualization and predictive modeling in the same enterprise analytics platform, organizations can easily collaborate on initiatives that make recommended actions accessible to the business. If you are looking for a format to display your unique thoughts, then the professionally designed How To Bridge Business Intelligence And Predictive Analytics Challenges Mockup PDF is the one for you. You can use it as a Google Slides template or a PowerPoint template. Incorporate impressive visuals, symbols, images, and other charts. Modify or reorganize the text boxes as you desire. Experiment with shade schemes and font pairings. Alter, share or cooperate with other people on your work. Download How To Bridge Business Intelligence And Predictive Analytics Challenges Mockup PDF and find out how to give a successful presentation. Present a perfect display to your team and make your presentation unforgettable.

Data Evaluation And Processing Toolkit Data Analytics Program Checklist Inspiration PDF
This slide shows progress status of data analytics process which includes important key tasks that must be performed while initiating a project. If you are looking for a format to display your unique thoughts, then the professionally designed Data Evaluation And Processing Toolkit Data Analytics Program Checklist Inspiration PDF is the one for you. You can use it as a Google Slides template or a PowerPoint template. Incorporate impressive visuals, symbols, images, and other charts. Modify or reorganize the text boxes as you desire. Experiment with shade schemes and font pairings. Alter, share or cooperate with other people on your work. Download Data Evaluation And Processing Toolkit Data Analytics Program Checklist Inspiration PDF and find out how to give a successful presentation. Present a perfect display to your team and make your presentation unforgettable.
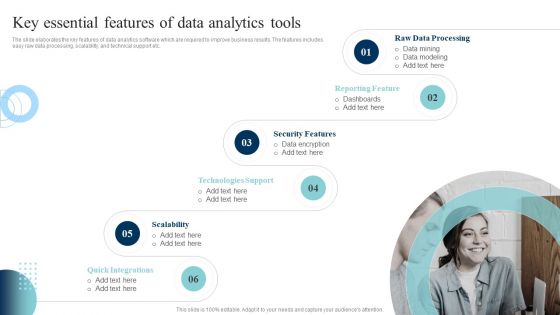
Data Evaluation And Processing Toolkit Key Essential Features Of Data Analytics Tools Inspiration PDF
The slide elaborates the key features of data analytics software which are required to improve business results. The features includes easy raw data processing, scalability, and technical support etc. Here you can discover an assortment of the finest PowerPoint and Google Slides templates. With these templates, you can create presentations for a variety of purposes while simultaneously providing your audience with an eye-catching visual experience. Download Data Evaluation And Processing Toolkit Key Essential Features Of Data Analytics Tools Inspiration PDF to deliver an impeccable presentation. These templates will make your job of preparing presentations much quicker, yet still, maintain a high level of quality. Slidegeeks has experienced researchers who prepare these templates and write high-quality content for you. Later on, you can personalize the content by editing the Data Evaluation And Processing Toolkit Key Essential Features Of Data Analytics Tools Inspiration PDF.
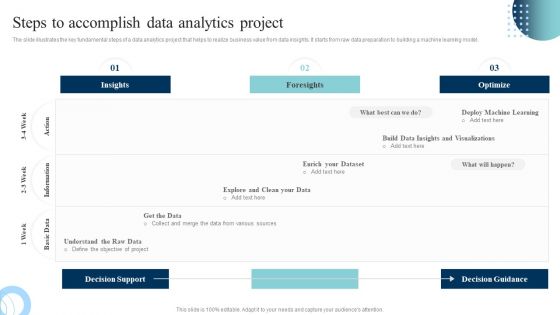
Data Evaluation And Processing Toolkit Steps To Accomplish Data Analytics Project Structure PDF
The slide illustrates the key fundamental steps of a data analytics project that helps to realize business value from data insights. It starts from raw data preparation to building a machine learning model. If you are looking for a format to display your unique thoughts, then the professionally designed Data Evaluation And Processing Toolkit Steps To Accomplish Data Analytics Project Structure PDF is the one for you. You can use it as a Google Slides template or a PowerPoint template. Incorporate impressive visuals, symbols, images, and other charts. Modify or reorganize the text boxes as you desire. Experiment with shade schemes and font pairings. Alter, share or cooperate with other people on your work. Download Data Evaluation And Processing Toolkit Steps To Accomplish Data Analytics Project Structure PDF and find out how to give a successful presentation. Present a perfect display to your team and make your presentation unforgettable.
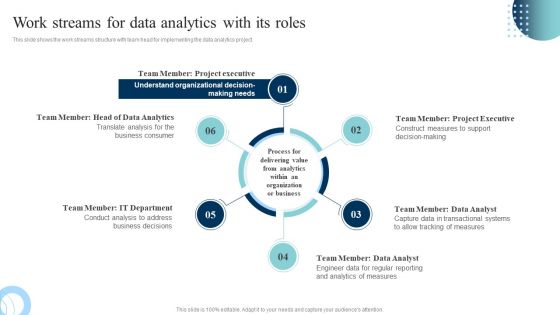
Data Evaluation And Processing Toolkit Work Streams For Data Analytics With Its Roles Themes PDF
This slide shows the work streams structure with team head for implementing the data analytics project. Here you can discover an assortment of the finest PowerPoint and Google Slides templates. With these templates, you can create presentations for a variety of purposes while simultaneously providing your audience with an eye-catching visual experience. Download Data Evaluation And Processing Toolkit Work Streams For Data Analytics With Its Roles Themes PDF to deliver an impeccable presentation. These templates will make your job of preparing presentations much quicker, yet still, maintain a high level of quality. Slidegeeks has experienced researchers who prepare these templates and write high-quality content for you. Later on, you can personalize the content by editing the Data Evaluation And Processing Toolkit Work Streams For Data Analytics With Its Roles Themes PDF.
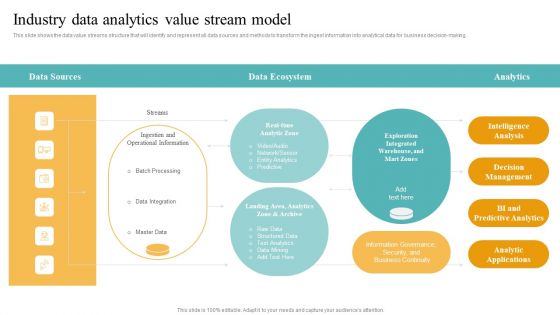
Transformation Toolkit Competitive Intelligence Information Analysis Industry Data Analytics Value Stream Model Raw Mockup PDF
This slide illustrates the workflow related to performing the data analytics project along with key responsible owners to accomplish the activities. If you are looking for a format to display your unique thoughts, then the professionally designed Transformation Toolkit Competitive Intelligence Information Analysis Industry Data Analytics Value Stream Model Raw Mockup PDF is the one for you. You can use it as a Google Slides template or a PowerPoint template. Incorporate impressive visuals, symbols, images, and other charts. Modify or reorganize the text boxes as you desire. Experiment with shade schemes and font pairings. Alter, share or cooperate with other people on your work. Download Transformation Toolkit Competitive Intelligence Information Analysis Industry Data Analytics Value Stream Model Raw Mockup PDF and find out how to give a successful presentation. Present a perfect display to your team and make your presentation unforgettable.
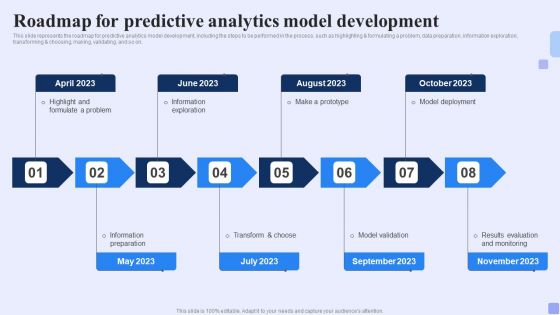
Roadmap For Predictive Analytics Model Development Forward Looking Analysis IT Guidelines PDF
This slide represents the roadmap for predictive analytics model development, including the steps to be performed in the process, such as highlighting formulating a problem, data preparation, information exploration, transforming choosing, making, validating, and so on.Here you can discover an assortment of the finest PowerPoint and Google Slides templates. With these templates, you can create presentations for a variety of purposes while simultaneously providing your audience with an eye-catching visual experience. Download Roadmap For Predictive Analytics Model Development Forward Looking Analysis IT Guidelines PDF to deliver an impeccable presentation. These templates will make your job of preparing presentations much quicker, yet still, maintain a high level of quality. Slidegeeks has experienced researchers who prepare these templates and write high-quality content for you. Later on, you can personalize the content by editing the Roadmap For Predictive Analytics Model Development Forward Looking Analysis IT Guidelines PDF.

Improving Technology Based HR Recruitment Analytics Process And Kpis Designs PDF
This slide showcases generic process and key performance indicators included in recruitment analytics. It provides information about top source identification, source boosters usage, performance data gathering along with difference between manual and predictive recruitment analytics. Are you in need of a template that can accommodate all of your creative concepts This one is crafted professionally and can be altered to fit any style. Use it with Google Slides or PowerPoint. Include striking photographs, symbols, depictions, and other visuals. Fill, move around, or remove text boxes as desired. Test out color palettes and font mixtures. Edit and save your work, or work with colleagues. Download Improving Technology Based HR Recruitment Analytics Process And Kpis Designs PDF and observe how to make your presentation outstanding. Give an impeccable presentation to your group and make your presentation unforgettable.

Essential Business Requirements For Data Analytics In Venn Diagram Introduction PDF
In this slide, we are showing the basic key components including people, process and technology that are required for data analytics strategy management process. Here you can discover an assortment of the finest PowerPoint and Google Slides templates. With these templates, you can create presentations for a variety of purposes while simultaneously providing your audience with an eye catching visual experience. Download Essential Business Requirements For Data Analytics In Venn Diagram Introduction PDF to deliver an impeccable presentation. These templates will make your job of preparing presentations much quicker, yet still, maintain a high level of quality. Slidegeeks has experienced researchers who prepare these templates and write high quality content for you. Later on, you can personalize the content by editing the Essential Business Requirements For Data Analytics In Venn Diagram Introduction PDF.
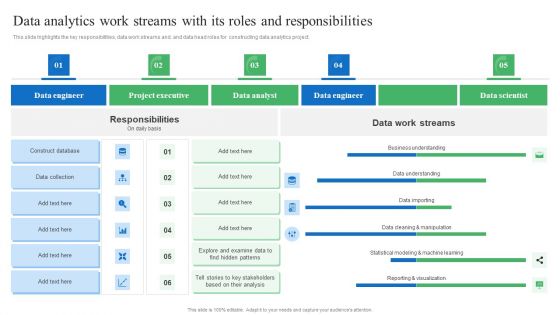
Data Analytics Work Streams With Its Roles And Responsibilities Rules PDF
This slide highlights the key responsibilities, data work streams and. and data head roles for constructing data analytics project. Here you can discover an assortment of the finest PowerPoint and Google Slides templates. With these templates, you can create presentations for a variety of purposes while simultaneously providing your audience with an eye catching visual experience. Download Data Analytics Work Streams With Its Roles And Responsibilities Rules PDF to deliver an impeccable presentation. These templates will make your job of preparing presentations much quicker, yet still, maintain a high level of quality. Slidegeeks has experienced researchers who prepare these templates and write high quality content for you. Later on, you can personalize the content by editing the Data Analytics Work Streams With Its Roles And Responsibilities Rules PDF.

Marketing Success Metrics Introduction To Social Media Analytics To Increase Graphics PDF
This slide covers an overview of social media analytics to increase new customers. It also includes the benefits of social media analytics, such as boosting social media campaign performance, improving crisis management, maximizing product launches, lower customer care costs, etc. Do you know about Slidesgeeks Marketing Success Metrics Introduction To Social Media Analytics To Increase Graphics PDF These are perfect for delivering any kind od presentation. Using it, create PowerPoint presentations that communicate your ideas and engage audiences. Save time and effort by using our pre-designed presentation templates that are perfect for a wide range of topic. Our vast selection of designs covers a range of styles, from creative to business, and are all highly customizable and easy to edit. Download as a PowerPoint template or use them as Google Slides themes.

Intelligent Manufacturing Predictive Analytics Dashboard To Track Manufacturing Operations Information PDF
This slide depicts the predictive analytics dashboard to track manufacturing operations, including production volume, order volume, active machines, sales revenue, top five products, downtime causes, production volume by top five machines, and so on. If you are looking for a format to display your unique thoughts, then the professionally designed Intelligent Manufacturing Predictive Analytics Dashboard To Track Manufacturing Operations Information PDF is the one for you. You can use it as a Google Slides template or a PowerPoint template. Incorporate impressive visuals, symbols, images, and other charts. Modify or reorganize the text boxes as you desire. Experiment with shade schemes and font pairings. Alter, share or cooperate with other people on your work. Download Intelligent Manufacturing Predictive Analytics Dashboard To Track Manufacturing Operations Information PDF and find out how to give a successful presentation. Present a perfect display to your team and make your presentation unforgettable.
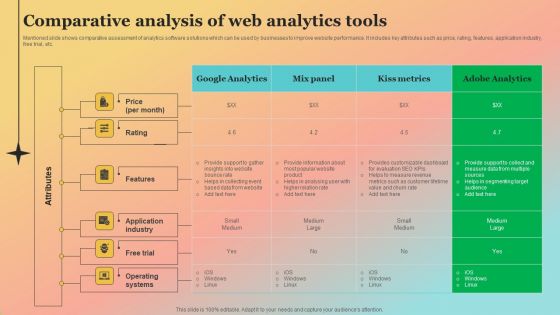
New Website Launch Strategy Comparative Analysis Of Web Analytics Tools Pictures PDF
Mentioned slide shows comparative assessment of analytics software solutions which can be used by businesses to improve website performance. It includes key attributes such as price, rating, features, application industry, free trial, etc. Here you can discover an assortment of the finest PowerPoint and Google Slides templates. With these templates, you can create presentations for a variety of purposes while simultaneously providing your audience with an eye catching visual experience. Download New Website Launch Strategy Comparative Analysis Of Web Analytics Tools Pictures PDF to deliver an impeccable presentation. These templates will make your job of preparing presentations much quicker, yet still, maintain a high level of quality. Slidegeeks has experienced researchers who prepare these templates and write high quality content for you. Later on, you can personalize the content by editing the New Website Launch Strategy Comparative Analysis Of Web Analytics Tools Pictures PDF.
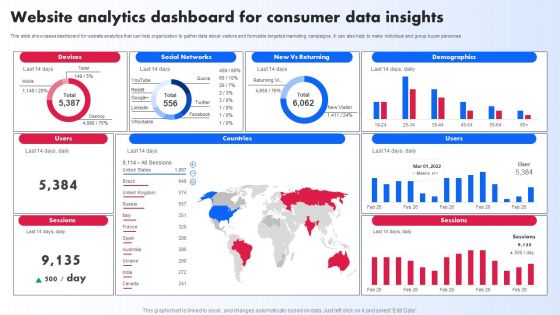
Website Analytics Dashboard For Consumer Data Insights Ppt PowerPoint Presentation File Slides PDF
This slide showcases dashboard for website analytics that can help organization to gather data about visitors and formulate targeted marketing campaigns. It can also help to make individual and group buyer personas. If you are looking for a format to display your unique thoughts, then the professionally designed Website Analytics Dashboard For Consumer Data Insights Ppt PowerPoint Presentation File Slides PDF is the one for you. You can use it as a Google Slides template or a PowerPoint template. Incorporate impressive visuals, symbols, images, and other charts. Modify or reorganize the text boxes as you desire. Experiment with shade schemes and font pairings. Alter, share or cooperate with other people on your work. Download Website Analytics Dashboard For Consumer Data Insights Ppt PowerPoint Presentation File Slides PDF and find out how to give a successful presentation. Present a perfect display to your team and make your presentation unforgettable.
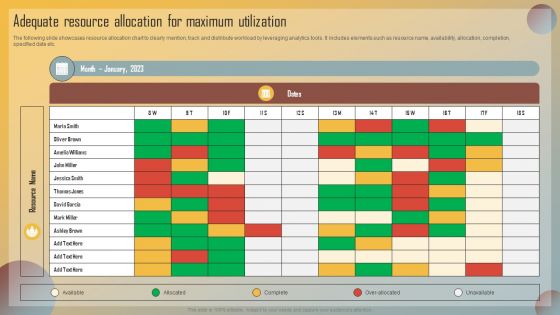
Guide For Marketing Analytics To Improve Decisions Adequate Resource Allocation For Maximum Utilization Download PDF
The following slide showcases resource allocation chart to clearly mention, track and distribute workload by leveraging analytics tools. It includes elements such as resource name, availability, allocation, completion, specified date etc. If you are looking for a format to display your unique thoughts, then the professionally designed Guide For Marketing Analytics To Improve Decisions Adequate Resource Allocation For Maximum Utilization Download PDF is the one for you. You can use it as a Google Slides template or a PowerPoint template. Incorporate impressive visuals, symbols, images, and other charts. Modify or reorganize the text boxes as you desire. Experiment with shade schemes and font pairings. Alter, share or cooperate with other people on your work. Download Guide For Marketing Analytics To Improve Decisions Adequate Resource Allocation For Maximum Utilization Download PDF and find out how to give a successful presentation. Present a perfect display to your team and make your presentation unforgettable.
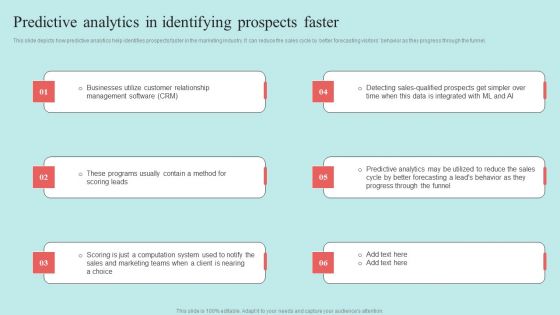
Predictive Data Model Predictive Analytics In Identifying Prospects Faster Pictures PDF

Iot Integration In Manufacturing Predictive Analytics Dashboard To Track Manufacturing Operations Background PDF
This slide depicts the predictive analytics dashboard to track manufacturing operations, including production volume, order volume, active machines, sales revenue, top five products, downtime causes, production volume by top five machines, and so on. If you are looking for a format to display your unique thoughts, then the professionally designed Iot Integration In Manufacturing Predictive Analytics Dashboard To Track Manufacturing Operations Background PDF is the one for you. You can use it as a Google Slides template or a PowerPoint template. Incorporate impressive visuals, symbols, images, and other charts. Modify or reorganize the text boxes as you desire. Experiment with shade schemes and font pairings. Alter, share or cooperate with other people on your work. Download Iot Integration In Manufacturing Predictive Analytics Dashboard To Track Manufacturing Operations Background PDF and find out how to give a successful presentation. Present a perfect display to your team and make your presentation unforgettable.
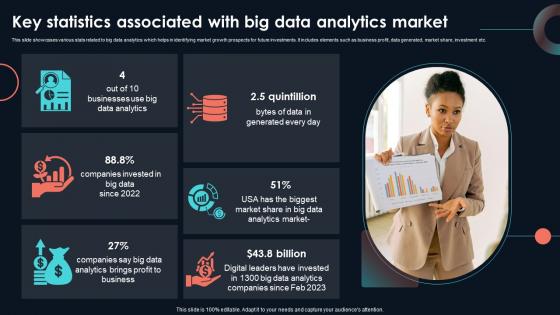
Key Statistics Associated With Big Data Developing Strategic Insights Using Big Data Analytics SS V
This slide showcases various stats related to big data analytics which helps in identifying market growth prospects for future investments. It includes elements such as business profit, data generated, market share, investment etc. If you are looking for a format to display your unique thoughts, then the professionally designed Key Statistics Associated With Big Data Developing Strategic Insights Using Big Data Analytics SS V is the one for you. You can use it as a Google Slides template or a PowerPoint template. Incorporate impressive visuals, symbols, images, and other charts. Modify or reorganize the text boxes as you desire. Experiment with shade schemes and font pairings. Alter, share or cooperate with other people on your work. Download Key Statistics Associated With Big Data Developing Strategic Insights Using Big Data Analytics SS V and find out how to give a successful presentation. Present a perfect display to your team and make your presentation unforgettable.

Key Techniques Used In Big Data Predictive Developing Strategic Insights Using Big Data Analytics SS V
This slide showcases various techniques used in predictive analytics which helps in data driven decision making. It provides information regarding deep learning, graph analytics and recommendation systems. Are you in need of a template that can accommodate all of your creative concepts This one is crafted professionally and can be altered to fit any style. Use it with Google Slides or PowerPoint. Include striking photographs, symbols, depictions, and other visuals. Fill, move around, or remove text boxes as desired. Test out color palettes and font mixtures. Edit and save your work, or work with colleagues. Download Key Techniques Used In Big Data Predictive Developing Strategic Insights Using Big Data Analytics SS V and observe how to make your presentation outstanding. Give an impeccable presentation to your group and make your presentation unforgettable.

Social Media Kpi Analytics Measurement Business Social Strategy Guide Infographics PDF
This template covers key performance indicator KPI to determine the performance against the company objectives. These Social media KPIs would be focusing on social engagements, content reach, purchase leads and conversions. If you are looking for a format to display your unique thoughts, then the professionally designed Social Media Kpi Analytics Measurement Business Social Strategy Guide Infographics PDF is the one for you. You can use it as a Google Slides template or a PowerPoint template. Incorporate impressive visuals, symbols, images, and other charts. Modify or reorganize the text boxes as you desire. Experiment with shade schemes and font pairings. Alter, share or cooperate with other people on your work. Download Social Media Kpi Analytics Measurement Business Social Strategy Guide Infographics PDF and find out how to give a successful presentation. Present a perfect display to your team and make your presentation unforgettable.

Information Analysis And BI Playbook Data Management Framework After Data Analytics Solution Template PDF
This template illustrates the BI company data governance framework after the implementation of data science analytics solutions. It includes data discovery, data sharing, reuse of data for another insights, data acquisition etc. Are you in need of a template that can accommodate all of your creative concepts This one is crafted professionally and can be altered to fit any style. Use it with Google Slides or PowerPoint. Include striking photographs, symbols, depictions, and other visuals. Fill, move around, or remove text boxes as desired. Test out color palettes and font mixtures. Edit and save your work, or work with colleagues. Download Information Analysis And BI Playbook Data Management Framework After Data Analytics Solution Template PDF and observe how to make your presentation outstanding. Give an impeccable presentation to your group and make your presentation unforgettable.

Using Data Science Technologies For Business Transformation Data Science With Data Analytics Formats PDF
This slide represents the difference between data science and data analytics based on skillset, scope, exploration and goals and how both will work together. Do you know about Slidesgeeks Using Data Science Technologies For Business Transformation Data Science With Data Analytics Formats PDF These are perfect for delivering any kind od presentation. Using it, create PowerPoint presentations that communicate your ideas and engage audiences. Save time and effort by using our pre designed presentation templates that are perfect for a wide range of topic. Our vast selection of designs covers a range of styles, from creative to business, and are all highly customizable and easy to edit. Download as a PowerPoint template or use them as Google Slides themes.

Business Analytics Application Roles And Responsibilities By Stages Of BI Implementation Guidelines PDF
This slide represents the responsibilities performed by different key stakeholders at the time of implementation of business intelligence in organization. It includes roles and responsibilities of business executive, BI head, data analytics, BI engineer etc. Retrieve professionally designed Business Analytics Application Roles And Responsibilities By Stages Of BI Implementation Guidelines PDF to effectively convey your message and captivate your listeners. Save time by selecting pre-made slideshows that are appropriate for various topics, from business to educational purposes. These themes come in many different styles, from creative to corporate, and all of them are easily adjustable and can be edited quickly. Access them as PowerPoint templates or as Google Slides themes. You dont have to go on a hunt for the perfect presentation because Slidegeeks got you covered from everywhere.

Data Evaluation And Processing Toolkit Data Analytics Project Plan Lifecycle Background PDF
This slide shows the data analytics lifecycle covering multiple stages starting from presenting the business case to data identification, data validation, analysis and ending at data visualization and utilization of results. Are you in need of a template that can accommodate all of your creative concepts This one is crafted professionally and can be altered to fit any style. Use it with Google Slides or PowerPoint. Include striking photographs, symbols, depictions, and other visuals. Fill, move around, or remove text boxes as desired. Test out color palettes and font mixtures. Edit and save your work, or work with colleagues. Download Data Evaluation And Processing Toolkit Data Analytics Project Plan Lifecycle Background PDF and observe how to make your presentation outstanding. Give an impeccable presentation to your group and make your presentation unforgettable.
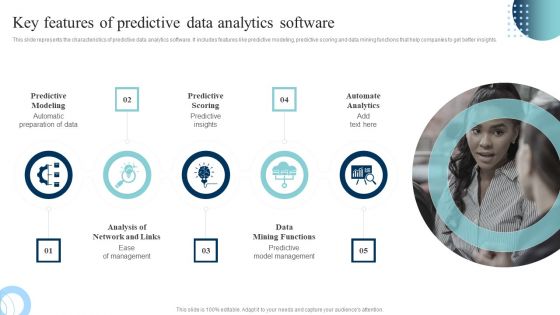
Data Evaluation And Processing Toolkit Key Features Of Predictive Data Analytics Software Ideas PDF
This slide represents the characteristics of predictive data analytics software. It includes features like predictive modeling, predictive scoring and data mining functions that help companies to get better insights. Do you know about Slidesgeeks Data Evaluation And Processing Toolkit Key Features Of Predictive Data Analytics Software Ideas PDF These are perfect for delivering any kind od presentation. Using it, create PowerPoint presentations that communicate your ideas and engage audiences. Save time and effort by using our pre-designed presentation templates that are perfect for a wide range of topic. Our vast selection of designs covers a range of styles, from creative to business, and are all highly customizable and easy to edit. Download as a PowerPoint template or use them as Google Slides themes.
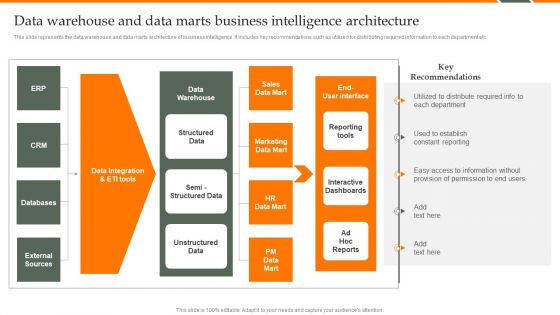
Human Resource Analytics Data Warehouse And Data Marts Business Intelligence Introduction PDF
This slide represents the data warehouse and data marts architecture of business intelligence. It includes key recommendations such as utilized for distributing required information to each department etc. If you are looking for a format to display your unique thoughts, then the professionally designed Human Resource Analytics Data Warehouse And Data Marts Business Intelligence Introduction PDF is the one for you. You can use it as a Google Slides template or a PowerPoint template. Incorporate impressive visuals, symbols, images, and other charts. Modify or reorganize the text boxes as you desire. Experiment with shade schemes and font pairings. Alter, share or cooperate with other people on your work. Download Human Resource Analytics Data Warehouse And Data Marts Business Intelligence Introduction PDF and find out how to give a successful presentation. Present a perfect display to your team and make your presentation unforgettable.
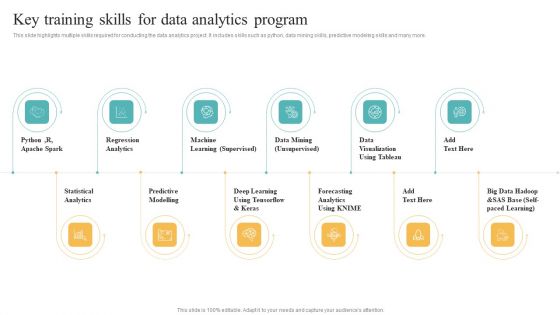
Transformation Toolkit Competitive Intelligence Information Analysis Key Training Skills For Data Analytics Program Structure PDF
This slide highlights multiple skills required for conducting the data analytics project. It includes skills such as python, data mining skills, predictive modeling skills and many more. Retrieve professionally designed Transformation Toolkit Competitive Intelligence Information Analysis Key Training Skills For Data Analytics Program Structure PDF to effectively convey your message and captivate your listeners. Save time by selecting pre made slideshows that are appropriate for various topics, from business to educational purposes. These themes come in many different styles, from creative to corporate, and all of them are easily adjustable and can be edited quickly. Access them as PowerPoint templates or as Google Slides themes. You do not have to go on a hunt for the perfect presentation because Slidegeeks got you covered from everywhere.
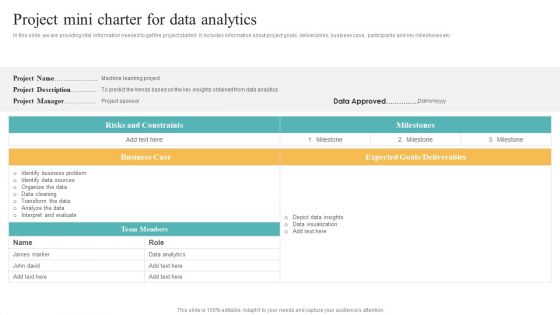
Transformation Toolkit Competitive Intelligence Information Analysis Project Mini Charter For Data Analytics Guidelines PDF
In this slide, we are providing vital information needed to get the project started. It includes information about project goals, deliverables, business case, participants and key milestones etc. Here you can discover an assortment of the finest PowerPoint and Google Slides templates. With these templates, you can create presentations for a variety of purposes while simultaneously providing your audience with an eye catching visual experience. Download Transformation Toolkit Competitive Intelligence Information Analysis Project Mini Charter For Data Analytics Guidelines PDF to deliver an impeccable presentation. These templates will make your job of preparing presentations much quicker, yet still, maintain a high level of quality. Slidegeeks has experienced researchers who prepare these templates and write high quality content for you. Later on, you can personalize the content by editing the Transformation Toolkit Competitive Intelligence Information Analysis Project Mini Charter For Data Analytics Guidelines PDF.

Transformation Toolkit Competitive Intelligence Information Analysis Steps To Accomplish Data Analytics Project Slides PDF
The slide illustrates the key fundamental steps of a data analytics project that helps to realize business value from data insights. It starts from raw data preparation to building a machine learning model. Do you know about Slidesgeeks Transformation Toolkit Competitive Intelligence Information Analysis Steps To Accomplish Data Analytics Project Slides PDF These are perfect for delivering any kind od presentation. Using it, create PowerPoint presentations that communicate your ideas and engage audiences. Save time and effort by using our pre designed presentation templates that are perfect for a wide range of topic. Our vast selection of designs covers a range of styles, from creative to business, and are all highly customizable and easy to edit. Download as a PowerPoint template or use them as Google Slides themes.

Data Analytics Change Management Gantt Chart Transformation Toolkit Competitive Intelligence Rules PDF
The slide shows the timeline for assessing and implementing the change in data analytics project. Are you in need of a template that can accommodate all of your creative concepts This one is crafted professionally and can be altered to fit any style. Use it with Google Slides or PowerPoint. Include striking photographs, symbols, depictions, and other visuals. Fill, move around, or remove text boxes as desired. Test out color palettes and font mixtures. Edit and save your work, or work with colleagues. Download Data Analytics Change Management Gantt Chart Transformation Toolkit Competitive Intelligence Rules PDF and observe how to make your presentation outstanding. Give an impeccable presentation to your group and make your presentation unforgettable.

Identifying Direct And Indirect Selecting Suitable Data Analytics Tool Diagrams PDF
This slide will help firm in choosing the suitable data analytics tool which is to handle existing bulk of data. The firm will choose effective tool with features such as API integration, centralized platform, business intelligence etc. Retrieve professionally designed Identifying Direct And Indirect Selecting Suitable Data Analytics Tool Diagrams PDF to effectively convey your message and captivate your listeners. Save time by selecting pre-made slideshows that are appropriate for various topics, from business to educational purposes. These themes come in many different styles, from creative to corporate, and all of them are easily adjustable and can be edited quickly. Access them as PowerPoint templates or as Google Slides themes. You dont have to go on a hunt for the perfect presentation because Slidegeeks got you covered from everywhere.
Optimizing Marketing Analytics To Enhance Organizational Growth Analyzing Landing Page Views Icons PDF
This slide covers an overview of page view KPI to identify which pages drive the most traffic and which are underperforming. It also includes improvement strategies such as push notifications, yes or yes campaigns, and popups for related articles. Here you can discover an assortment of the finest PowerPoint and Google Slides templates. With these templates, you can create presentations for a variety of purposes while simultaneously providing your audience with an eye catching visual experience. Download Optimizing Marketing Analytics To Enhance Organizational Growth Analyzing Landing Page Views Icons PDF to deliver an impeccable presentation. These templates will make your job of preparing presentations much quicker, yet still, maintain a high level of quality. Slidegeeks has experienced researchers who prepare these templates and write high quality content for you. Later on, you can personalize the content by editing the Optimizing Marketing Analytics To Enhance Organizational Growth Analyzing Landing Page Views Icons PDF.
Predictive Analytics Classification Model Introduction Forward Looking Analysis IT Icons PDF
This slide describes the overview of the classification model used in predictive analytics, including the questions it answers. It also contains algorithms used in this model, such as random forest, gradient boosted model, convolution neural network, bagging, and stacking.Are you in need of a template that can accommodate all of your creative concepts This one is crafted professionally and can be altered to fit any style. Use it with Google Slides or PowerPoint. Include striking photographs, symbols, depictions, and other visuals. Fill, move around, or remove text boxes as desired. Test out color palettes and font mixtures. Edit and save your work, or work with colleagues. Download Predictive Analytics Classification Model Introduction Forward Looking Analysis IT Icons PDF and observe how to make your presentation outstanding. Give an impeccable presentation to your group and make your presentation unforgettable.
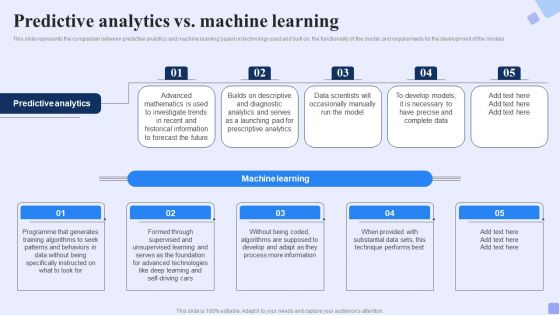
Predictive Analytics Vs Machine Learning Forward Looking Analysis IT Rules PDF
This slide represents the comparison between predictive analytics and machine learning based on technology used and built on, the functionality of the model, and requirements for the development of the models.Retrieve professionally designed Predictive Analytics Vs Machine Learning Forward Looking Analysis IT Rules PDF to effectively convey your message and captivate your listeners. Save time by selecting pre-made slideshows that are appropriate for various topics, from business to educational purposes. These themes come in many different styles, from creative to corporate, and all of them are easily adjustable and can be edited quickly. Access them as PowerPoint templates or as Google Slides themes. You do not have to go on a hunt for the perfect presentation because Slidegeeks got you covered from everywhere.
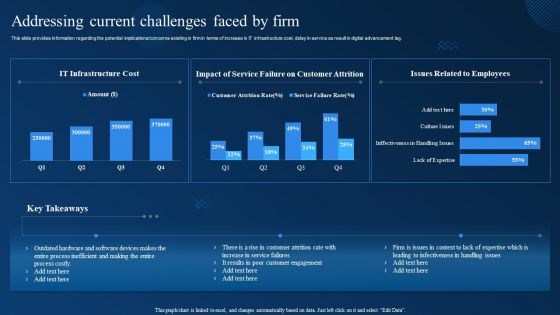
Cognitive Analytics Strategy And Techniques Addressing Current Challenges Faced By Firm Structure PDF
This slide provides information regarding the potential implications or concerns existing in firm in terms of increase in IT infrastructure cost, delay in service as result in digital advancement lag. Here you can discover an assortment of the finest PowerPoint and Google Slides templates. With these templates, you can create presentations for a variety of purposes while simultaneously providing your audience with an eye catching visual experience. Download Cognitive Analytics Strategy And Techniques Addressing Current Challenges Faced By Firm Structure PDF to deliver an impeccable presentation. These templates will make your job of preparing presentations much quicker, yet still, maintain a high level of quality. Slidegeeks has experienced researchers who prepare these templates and write high quality content for you. Later on, you can personalize the content by editing the Cognitive Analytics Strategy And Techniques Addressing Current Challenges Faced By Firm Structure PDF.
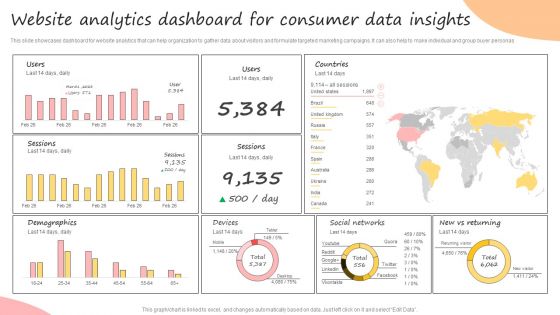
Developing Promotional Strategic Plan For Online Marketing Website Analytics Dashboard For Consumer Summary PDF
This slide showcases dashboard for website analytics that can help organization to gather data about visitors and formulate targeted marketing campaigns. It can also help to make individual and group buyer personas. Are you in need of a template that can accommodate all of your creative concepts This one is crafted professionally and can be altered to fit any style. Use it with Google Slides or PowerPoint. Include striking photographs, symbols, depictions, and other visuals. Fill, move around, or remove text boxes as desired. Test out color palettes and font mixtures. Edit and save your work, or work with colleagues. Download Developing Promotional Strategic Plan For Online Marketing Website Analytics Dashboard For Consumer Summary PDF and observe how to make your presentation outstanding. Give an impeccable presentation to your group and make your presentation unforgettable.
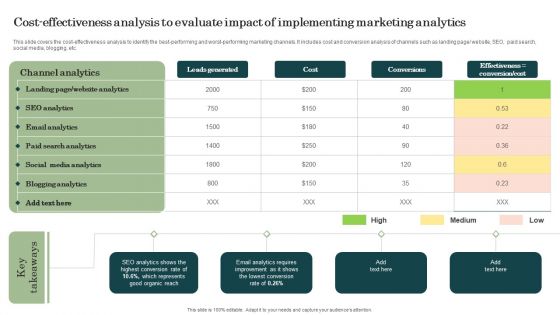
Cost Effectiveness Analysis To Evaluate Impact Of Implementing Marketing Analytics Structure PDF
This slide covers the cost-effectiveness analysis to identify the best-performing and worst-performing marketing channels. It includes cost and conversion analysis of channels such as landing page or website, SEO, paid search, social media, blogging, etc. If you are looking for a format to display your unique thoughts, then the professionally designed Cost Effectiveness Analysis To Evaluate Impact Of Implementing Marketing Analytics Structure PDF is the one for you. You can use it as a Google Slides template or a PowerPoint template. Incorporate impressive visuals, symbols, images, and other charts. Modify or reorganize the text boxes as you desire. Experiment with shade schemes and font pairings. Alter, share or cooperate with other people on your work. Download Cost Effectiveness Analysis To Evaluate Impact Of Implementing Marketing Analytics Structure PDF and find out how to give a successful presentation. Present a perfect display to your team and make your presentation unforgettable.
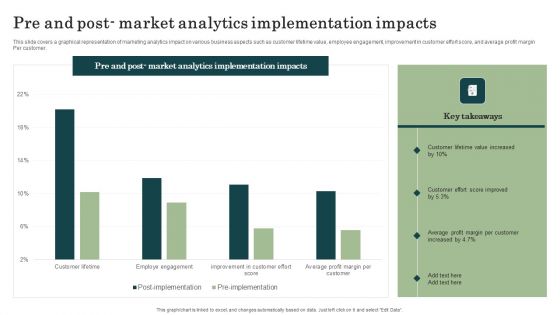
Marketing Success Metrics Pre And Post Market Analytics Implementation Information PDF
This slide covers a graphical representation of marketing analytics impact on various business aspects such as customer lifetime value, employee engagement, improvement in customer effort score, and average profit margin Per customer. Do you know about Slidesgeeks Marketing Success Metrics Pre And Post Market Analytics Implementation Information PDF These are perfect for delivering any kind od presentation. Using it, create PowerPoint presentations that communicate your ideas and engage audiences. Save time and effort by using our pre-designed presentation templates that are perfect for a wide range of topic. Our vast selection of designs covers a range of styles, from creative to business, and are all highly customizable and easy to edit. Download as a PowerPoint template or use them as Google Slides themes.

Tools For HR Business Analytics Comparison Between Reporting Type Flow Inspiration PDF
This slide represents the difference between the types of data reporting flow. It includes comparison between traditional BI and self-service BI on the basis of IT setup, agility, data governance, kind of reporting and data. If you are looking for a format to display your unique thoughts, then the professionally designed Tools For HR Business Analytics Comparison Between Reporting Type Flow Inspiration PDF is the one for you. You can use it as a Google Slides template or a PowerPoint template. Incorporate impressive visuals, symbols, images, and other charts. Modify or reorganize the text boxes as you desire. Experiment with shade schemes and font pairings. Alter, share or cooperate with other people on your work. Download Tools For HR Business Analytics Comparison Between Reporting Type Flow Inspiration PDF and find out how to give a successful presentation. Present a perfect display to your team and make your presentation unforgettable.
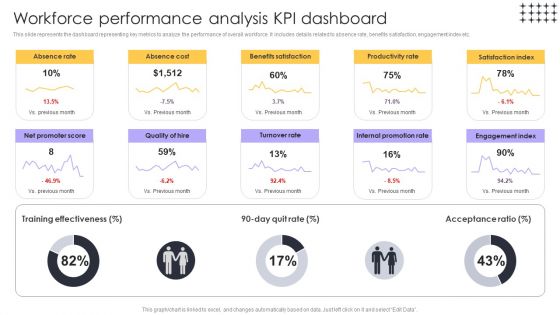
Tools For HR Business Analytics Workforce Performance Analysis KPI Dashboard Pictures PDF
This slide represents the dashboard representing key metrics to analyze the performance of overall workforce. It includes details related to absence rate, benefits satisfaction, engagement index etc. Here you can discover an assortment of the finest PowerPoint and Google Slides templates. With these templates, you can create presentations for a variety of purposes while simultaneously providing your audience with an eye-catching visual experience. Download Tools For HR Business Analytics Workforce Performance Analysis KPI Dashboard Pictures PDF to deliver an impeccable presentation. These templates will make your job of preparing presentations much quicker, yet still, maintain a high level of quality. Slidegeeks has experienced researchers who prepare these templates and write high-quality content for you. Later on, you can personalize the content by editing the Tools For HR Business Analytics Workforce Performance Analysis KPI Dashboard Pictures PDF.
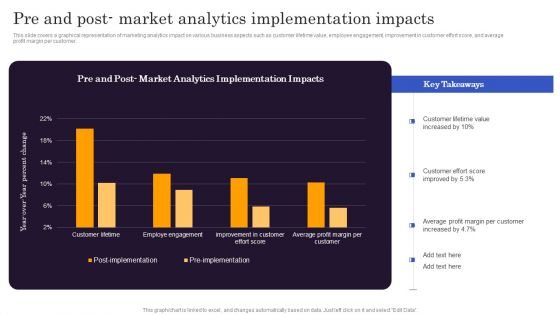
Marketers Guide To Data Analysis Optimization Pre And Post Market Analytics Implementation Impacts Formats PDF
This slide covers a graphical representation of marketing analytics impact on various business aspects such as customer lifetime value, employee engagement, improvement in customer effort score, and average profit margin per customer. Do you know about Slidesgeeks Marketers Guide To Data Analysis Optimization Pre And Post Market Analytics Implementation Impacts Formats PDF. These are perfect for delivering any kind od presentation. Using it, create PowerPoint presentations that communicate your ideas and engage audiences. Save time and effort by using our pre designed presentation templates that are perfect for a wide range of topic. Our vast selection of designs covers a range of styles, from creative to business, and are all highly customizable and easy to edit. Download as a PowerPoint template or use them as Google Slides themes.

Guide For Marketing Analytics To Improve Decisions Inbound Marketing Workflow Analysis With Benefits Clipart PDF
The following slide showcases inbound marketing funnel to review sales process and track customer journey. It includes elements such as attract, convert, close, delight, qualified database, nurture leads, strangers, leads, MQL, SQL, opportunity, client etc. If you are looking for a format to display your unique thoughts, then the professionally designed Guide For Marketing Analytics To Improve Decisions Inbound Marketing Workflow Analysis With Benefits Clipart PDF is the one for you. You can use it as a Google Slides template or a PowerPoint template. Incorporate impressive visuals, symbols, images, and other charts. Modify or reorganize the text boxes as you desire. Experiment with shade schemes and font pairings. Alter, share or cooperate with other people on your work. Download Guide For Marketing Analytics To Improve Decisions Inbound Marketing Workflow Analysis With Benefits Clipart PDF and find out how to give a successful presentation. Present a perfect display to your team and make your presentation unforgettable.
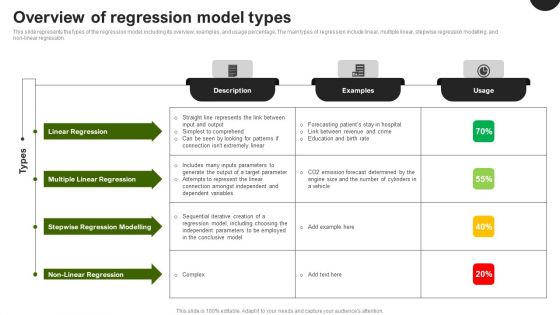
Predictive Analytics In The Age Of Big Data Overview Of Regression Model Types Diagrams PDF
This slide represents the types of the regression model, including its overview, examples, and usage percentage. The main types of regression include linear, multiple linear, stepwise regression modelling, and non-linear regression. If you are looking for a format to display your unique thoughts, then the professionally designed Predictive Analytics In The Age Of Big Data Overview Of Regression Model Types Diagrams PDF is the one for you. You can use it as a Google Slides template or a PowerPoint template. Incorporate impressive visuals, symbols, images, and other charts. Modify or reorganize the text boxes as you desire. Experiment with shade schemes and font pairings. Alter, share or cooperate with other people on your work. Download Predictive Analytics In The Age Of Big Data Overview Of Regression Model Types Diagrams PDF and find out how to give a successful presentation. Present a perfect display to your team and make your presentation unforgettable.
Online Marketing Analytics To Enhance Business Growth Analyzing Backlinks For Improved Search Icons PDF
This slide covers an overview of backlinks KPI to identify count as one of the most important Google ranking factors. It also includes improvement strategies such as finding backlink opportunities with top referral sources, guest blogging, and writing testimonials. Create an editable Online Marketing Analytics To Enhance Business Growth Analyzing Backlinks For Improved Search Icons PDF that communicates your idea and engages your audience. Whether youre presenting a business or an educational presentation, pre designed presentation templates help save time. Online Marketing Analytics To Enhance Business Growth Analyzing Backlinks For Improved Search Icons PDF is highly customizable and very easy to edit, covering many different styles from creative to business presentations. Slidegeeks has creative team members who have crafted amazing templates. So, go and get them without any delay.

Financial Analytics Solution Investor Funding Elevator Pitch Deck Client Testimonials Background PDF
This slide represents positive customer reviews related to the global analyst marketplace. It includes reviews from customers from Georgia, Florida, and California. If you are looking for a format to display your unique thoughts, then the professionally designed Financial Analytics Solution Investor Funding Elevator Pitch Deck Client Testimonials Background PDF is the one for you. You can use it as a Google Slides template or a PowerPoint template. Incorporate impressive visuals, symbols, images, and other charts. Modify or reorganize the text boxes as you desire. Experiment with shade schemes and font pairings. Alter, share or cooperate with other people on your work. Download Financial Analytics Solution Investor Funding Elevator Pitch Deck Client Testimonials Background PDF and find out how to give a successful presentation. Present a perfect display to your team and make your presentation unforgettable.

 Home
Home