Goals And Metrics

Best Techniques To Enhance New Product Management Efficiency Considerations That Affect Product Diagrams PDF
This slide focuses on key considerations that affects product differentiation success such as features, technology, performance, design, customer service and quality. This is a best techniques to enhance new product management efficiency comparing product metrics themes pdf template with various stages. Focus and dispense information on three stages using this creative set, that comes with editable features. It contains large content boxes to add your information on topics like proprietary technology, performance, customer service. You can also showcase facts, figures, and other relevant content using this PPT layout. Grab it now.
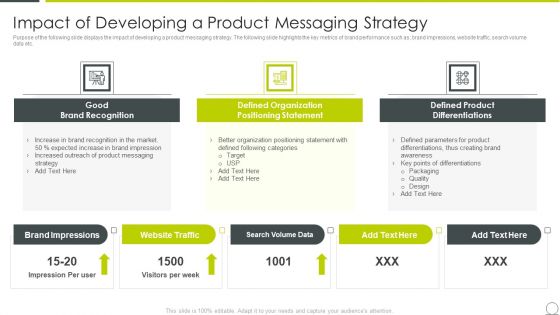
Examining Product Characteristics Brand Messaging Impact Of Developing A Product Slides PDF
Purpose of the following slide displays the impact of developing a product messaging strategy. The following slide highlights the key metrics of brand performance such as brand impressions, website traffic, search volume data etc. This is a examining product characteristics brand messaging impact of developing a product slides pdf template with various stages. Focus and dispense information on three stages using this creative set, that comes with editable features. It contains large content boxes to add your information on topics like recognition, positioning, organization, outreach, brand. You can also showcase facts, figures, and other relevant content using this PPT layout. Grab it now.

Dashboard For Analyzing Brand Perception Communication Strategy To Enhance Brand Value Topics PDF
This slide covers the dashboard for tracking brand reputation. It also includes metrics such as new customer lifetime value, customer acquisition cost, target met, above sales target, average weekly sales revenue, etc. Boost your pitch with our creative Dashboard For Analyzing Brand Perception Communication Strategy To Enhance Brand Value Topics PDF. Deliver an awe-inspiring pitch that will mesmerize everyone. Using these presentation templates you will surely catch everyones attention. You can browse the ppts collection on our website. We have researchers who are experts at creating the right content for the templates. So you do not have to invest time in any additional work. Just grab the template now and use them.
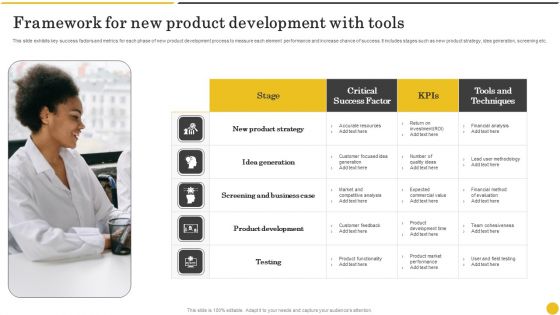
Framework For New Product Development With Tools Formats PDF

Assuring Management In Product Innovation To Enhance Processes Key Points Related To Successful Product Leadership Professional PDF
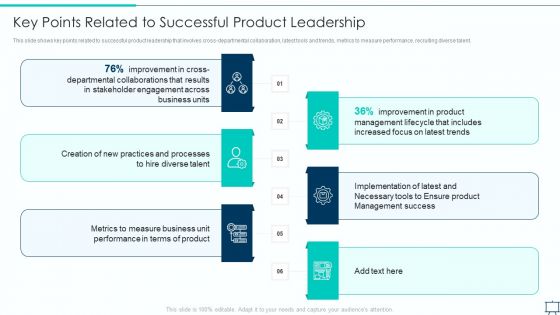
This slide shows key points related to successful product leadership that involves cross departmental collaboration, latest tools and trends, metrics to measure performance, recruiting diverse talent.This is a assuring management in product innovation to enhance processes key points related to successful product leadership professional pdf template with various stages. Focus and dispense information on six stages using this creative set, that comes with editable features. It contains large content boxes to add your information on topics like improvement in cross departmental, improvement in product management, increased focus on latest You can also showcase facts, figures, and other relevant content using this PPT layout. Grab it now.

Various Kpis To Measure Effectiveness Of Risk Management Course Guidelines PDF
The following slide exhibits multiple key performance indicator kPIs metrics which can assist the real estate company to measure the effectiveness of online risk management course. The KPIs are risks identified, monitored, mitigated and cost incurred. Deliver an awe inspiring pitch with this creative Various Kpis To Measure Effectiveness Of Risk Management Course Guidelines PDF bundle. Topics like Systematic Risks Identified, Key Risks Mitigated, Management Course can be discussed with this completely editable template. It is available for immediate download depending on the needs and requirements of the user.
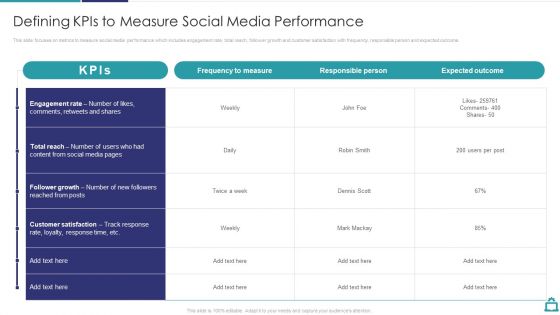
Deploying B2C Social Media Defining Kpis To Measure Social Media Performance Guidelines PDF
This slide focuses on metrics to measure social media performance which includes engagement rate, total reach, follower growth and customer satisfaction with frequency, responsible person and expected outcome.Deliver and pitch your topic in the best possible manner with this Deploying B2C Social Media Defining Kpis To Measure Social Media Performance Guidelines PDF. Use them to share invaluable insights on Frequency To Measure, Responsible Person, Expected Outcome and impress your audience. This template can be altered and modified as per your expectations. So, grab it now.

Digital Marketing Techniques To Improve Lead Defining Kpis To Measure Social Media Performance Infographics PDF
This slide focuses on metrics to measure social media performance which includes engagement rate, total reach, follower growth and customer satisfaction with frequency, responsible person and expected outcome. Deliver and pitch your topic in the best possible manner with this Digital Marketing Techniques To Improve Lead Defining Kpis To Measure Social Media Performance Infographics PDF. Use them to share invaluable insights on Frequency To Measure, Expected Outcome, Growth and impress your audience. This template can be altered and modified as per your expectations. So, grab it now.
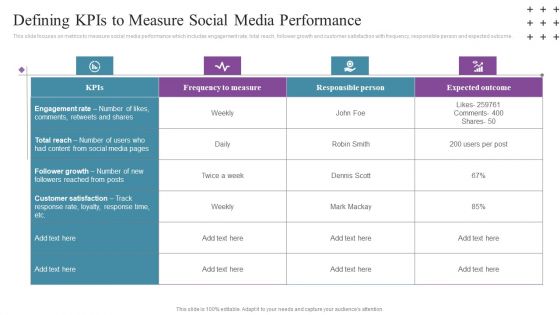
Social Networking Program Defining Kpis To Measure Social Media Performance Inspiration PDF
This slide focuses on metrics to measure social media performance which includes engagement rate, total reach, follower growth and customer satisfaction with frequency, responsible person and expected outcome. Deliver and pitch your topic in the best possible manner with this Social Networking Program Defining Kpis To Measure Social Media Performance Inspiration PDF. Use them to share invaluable insights on Frequency To Measure, Responsible Person, Expected Outcome and impress your audience. This template can be altered and modified as per your expectations. So, grab it now.

Online Marketing Tactics To Enhance Sales Kpis To Measure Audience Reach Across Social Media Professional PDF
This slide shows the dashboard that represents metrics to measure audience reach across social media channels which includes views, clicks, likes, impressions, actions, tweets, followers, interactions, etc. Deliver an awe inspiring pitch with this creative Online Marketing Tactics To Enhance Sales Kpis To Measure Audience Reach Across Social Media Professional PDF bundle. Topics like LinkedIn Channel, Facebook Account, Twitter, Facebook Ads can be discussed with this completely editable template. It is available for immediate download depending on the needs and requirements of the user.
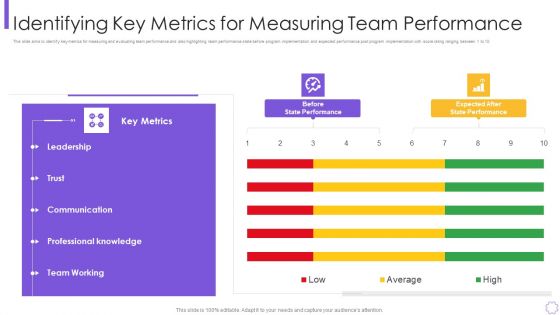
Process Optimization Through Product Life Process Management Techniques Identifying Sample PDF
This slide aims to identify key metrics for measuring and evaluating team performance and also highlighting team performance state before program implementation and expected performance post program implementation with score rating ranging between 1 to 10.Deliver and pitch your topic in the best possible manner with this process optimization through product life process management techniques identifying sample pdf Use them to share invaluable insights on communication, professional knowledge, team working and impress your audience. This template can be altered and modified as per your expectations. So, grab it now.

Product Marketing And Awareness Programs Product Promotion Program Overview Infographics PDF
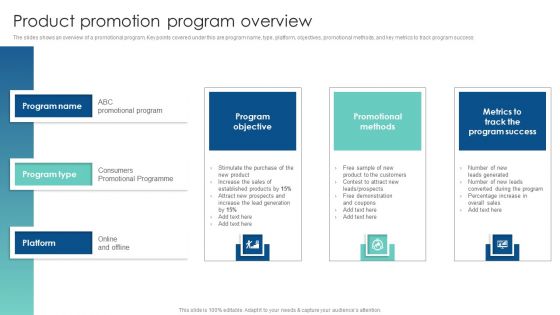
The slides shows an overview of a promotional program. Key points covered under this are program name, type, platform, objectives, promotional methods, and key metrics to track program success. The Product Marketing And Awareness Programs Product Promotion Program Overview Infographics PDF is a compilation of the most recent design trends as a series of slides. It is suitable for any subject or industry presentation, containing attractive visuals and photo spots for businesses to clearly express their messages. This template contains a variety of slides for the user to input data, such as structures to contrast two elements, bullet points, and slides for written information. Slidegeeks is prepared to create an impression.

Software Product Evaluation KPI Dashboard With Average Defects Infographics PDF
Mentioned slide indicates software product testing KPI dashboard which shows various aspects like defects by type and severity, average solution over last 18 weeks etc. These metrics can assist the developers to evaluate the performance of software by performing test.Showcasing this set of slides titled Software Product Evaluation KPI Dashboard With Average Defects Infographics PDF The topics addressed in these templates are Software Product, Evaluation Dashboard, Average Defects All the content presented in this PPT design is completely editable. Download it and make adjustments in color, background, font etc. as per your unique business setting.

Information Technology Facility Flow Administration Measuring IT Staff Performance Structure PDF
This slide helps in analyzing the performance of different IT executives or representatives. It will help in tracking metrics such as cost per contact, percentage of tickets opened, etc. The staff performance will be assessed on various parameters such as cost, quality, productivity and service level. Deliver an awe-inspiring pitch with this creative information technology facility flow administration measuring it staff performance structure pdf bundle. Topics like cost, quality, productivity, service level can be discussed with this completely editable template. It is available for immediate download depending on the needs and requirements of the user.
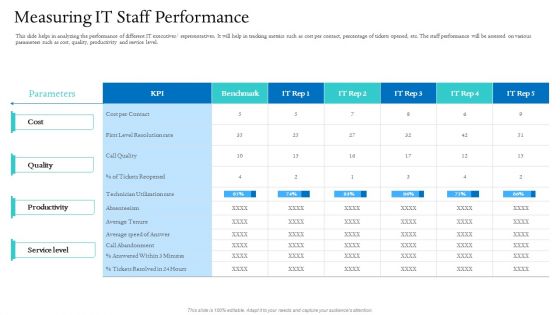
Information Technology Facilities Governance Measuring IT Staff Performance Ppt Infographic Template Graphics Download PDF
This slide helps in analyzing the performance of different IT executives representatives. It will help in tracking metrics such as cost per contact, percentage of tickets opened, etc. The staff performance will be assessed on various parameters such as cost, quality, productivity and service level. Deliver and pitch your topic in the best possible manner with this information technology facilities governance measuring IT staff performance ppt infographic template graphics download pdf. Use them to share invaluable insights on cost per contact, productivity, service level, technician, parameters and impress your audience. This template can be altered and modified as per your expectations. So, grab it now.
Impeccable Information Technology Facility Measuring IT Staff Performance Ppt Icon Design Templates PDF
This slide helps in analyzing the performance of different IT executives or representatives. It will help in tracking metrics such as cost per contact, percentage of tickets opened, etc. The staff performance will be assessed on various parameters such as cost, quality, productivity and service level. Deliver an awe-inspiring pitch with this creative impeccable information technology facility measuring it staff performance ppt icon design templates pdf bundle. Topics like service level, productivity, quality, cost can be discussed with this completely editable template. It is available for immediate download depending on the needs and requirements of the user.

Technology Facility Maintenance And Provider Measuring IT Staff Performance Guidelines PDF
This slide helps in analyzing the performance of different IT executives representatives. It will help in tracking metrics such as cost per contact, percentage of tickets opened, etc. The staff performance will be assessed on various parameters such as cost, quality, productivity and service level. Deliver an awe inspiring pitch with this creative technology facility maintenance and provider measuring IT staff performance guidelines pdf bundle. Topics like cost per contact, parameters, productivity, service level, technician utilization rate can be discussed with this completely editable template. It is available for immediate download depending on the needs and requirements of the user.

Retaining Clients Improving Information Technology Facilities Measuring IT Staff Performance Designs PDF
This slide helps in analyzing the performance of different IT executives representatives. It will help in tracking metrics such as cost per contact, percentage of tickets opened, etc. The staff performance will be assessed on various parameters such as cost, quality, productivity and service level. Deliver an awe-inspiring pitch with this creative retaining clients improving information technology facilities measuring it staff performance designs pdf bundle. Topics like cost, quality, productivity, service level can be discussed with this completely editable template. It is available for immediate download depending on the needs and requirements of the user.

KPI Dashboard To Monitor Beauty Care Products Sales Performance Ppt Outline Example Topics PDF
This slide shows the key performance indicators dashboard which can be used to analyze current financial position of cosmetic business. It includes metrics such as sales, expenses, profit, cash in hand, etc. Showcasing this set of slides titled KPI Dashboard To Monitor Beauty Care Products Sales Performance Ppt Outline Example Topics PDF. The topics addressed in these templates are Accounts Receivable, Profit Margin, Expense. All the content presented in this PPT design is completely editable. Download it and make adjustments in color, background, font etc. as per your unique business setting.
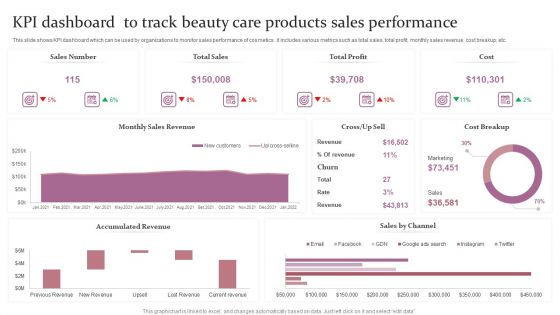
KPI Dashboard To Track Beauty Care Products Sales Performance Ppt Outline Pictures PDF
This slide shows the key performance indicators dashboard which can be used to analyze current financial position of cosmetic business. It includes metrics such as sales, expenses, profit, cash in hand, etc. Showcasing this set of slides titled KPI Dashboard To Track Beauty Care Products Sales Performance Ppt Outline Pictures PDF. The topics addressed in these templates are Sales Number, Total Sales, Total Profit, Cost. All the content presented in this PPT design is completely editable. Download it and make adjustments in color, background, font etc. as per your unique business setting.
Product Development Status Icon With Bulb Ideas PDF
The following slide showcases dashboard that helps to track key performance indicators of product development. Key metrics covered overall progress, planning, design, development, testing, risks, summary, average handle time, overdue tasks, upcoming deadlines and projected launch date. Showcasing this set of slides titled Product Development Status Icon With Bulb Ideas PDF. The topics addressed in these templates are Design, Development, Planning. All the content presented in this PPT design is completely editable. Download it and make adjustments in color, background, font etc. as per your unique business setting.

Project Earned Value Analysis Management Report Ppt PowerPoint Presentation Gallery Outline PDF
This slide represents project earned value analysis report showcasing project task, budget cost, planned value, actual cost, earned value, project performance metrics etc. Pitch your topic with ease and precision using this Project Earned Value Analysis Management Report Ppt PowerPoint Presentation Gallery Outline PDF. This layout presents information on Project Software Development, Phase Management, Communication Planning. It is also available for immediate download and adjustment. So, changes can be made in the color, design, graphics or any other component to create a unique layout.

Business Performance Review Dashboard To Measure Overall Business Performance Formats PDF
The following slide highlights a comprehensive quarterly business review QBR dashboard which can be used by the organization to evaluate business performance. The metrics used for review are total revenue, new customers, gross profit, overall costs, sales comparison, sales by different products and top performing channels. Showcasing this set of slides titled Business Performance Review Dashboard To Measure Overall Business Performance Formats PDF. The topics addressed in these templates are Sales Comparison, Sales Product, High Performing. All the content presented in this PPT design is completely editable. Download it and make adjustments in color, background, font etc. as per your unique business setting.
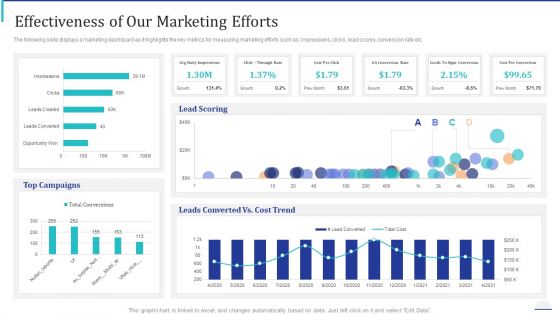
How Make Impactful Product Marketing Message Build Product Differentiation Effectiveness Of Our Marketing Efforts Themes PDF
The following slide displays a marketing dashboard as it highlights the key metrics for measuring marketing efforts such as Impressions, clicks, lead scores, conversion rate etc. Deliver an awe inspiring pitch with this creative how make impactful product marketing message build product differentiation effectiveness of our marketing efforts themes pdf bundle. Topics like top campaigns, lead scoring, leads converted vs cost trend can be discussed with this completely editable template. It is available for immediate download depending on the needs and requirements of the user.

Lean Operational Excellence Strategy Manufacturing Dashboard To Check Production System Efficiency Pictures PDF
This slide showcases manufacturing dashboard to track KPIs defined under lean and kaizen process improvement plans. Key performance metrics included here are TEEP, OEE, loading time, production quality, losses by hours, losses by categories etc. Pitch your topic with ease and precision using this Lean Operational Excellence Strategy Manufacturing Dashboard To Check Production System Efficiency Pictures PDF. This layout presents information on Loading, Availability, Performance. It is also available for immediate download and adjustment. So, changes can be made in the color, design, graphics or any other component to create a unique layout.
Banking Operations Performance Tracking Dashboard Incorporating Banking Operational Growth
The purpose of the mentioned slide is to showcase a performance tracking dashboard of banking operations. It includes metrics such as accounts opened and closed, total deposits, referrals by product, etc. Want to ace your presentation in front of a live audience Our Banking Operations Performance Tracking Dashboard Incorporating Banking Operational Growth can help you do that by engaging all the users towards you. Slidegeeks experts have put their efforts and expertise into creating these impeccable powerpoint presentations so that you can communicate your ideas clearly. Moreover, all the templates are customizable, and easy-to-edit and downloadable. Use these for both personal and commercial use.

Inspecting Sales Optimization Areas Sales Analysis Dashboard To Measure Performance Demonstration PDF
This slide showcases a dashboard presenting various metrics to measure and analyze sales performance for revenue growth. It includes key components such as number of annual new customer, sales revenue, customer satisfaction, customer acquisition cost, product wise sales, month wise sales and sales comparison. From laying roadmaps to briefing everything in detail, our templates are perfect for you. You can set the stage with your presentation slides. All you have to do is download these easy-to-edit and customizable templates. Inspecting Sales Optimization Areas Sales Analysis Dashboard To Measure Performance Demonstration PDF will help you deliver an outstanding performance that everyone would remember and praise you for. Do download this presentation today.
Product Promotion Program Overview Customer Acquisition Through Advertising Slides PDF
The slides shows an overview of a promotional program. Key points covered under this are program name, type, platform, objectives, promotional methods, and key metrics to track program success. Want to ace your presentation in front of a live audience Our Product Promotion Program Overview Customer Acquisition Through Advertising Slides PDF can help you do that by engaging all the users towards you. Slidegeeks experts have put their efforts and expertise into creating these impeccable powerpoint presentations so that you can communicate your ideas clearly. Moreover, all the templates are customizable, and easy-to-edit and downloadable. Use these for both personal and commercial use.
Deployment Procedure Of Hyper Automation RPA Dashboard With Automated Process And Productivity Brochure PDF
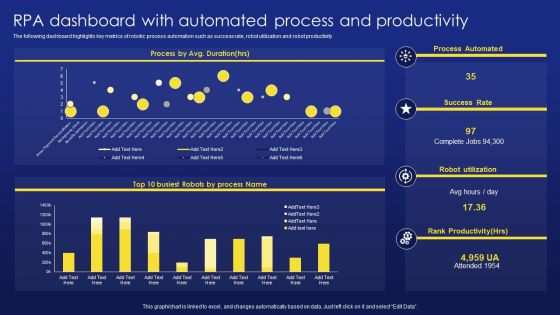
The following dashboard highlights key metrics of robotic process automation such as success rate, robot utilization and robot productivity. From laying roadmaps to briefing everything in detail, our templates are perfect for you. You can set the stage with your presentation slides. All you have to do is download these easy to edit and customizable templates. Deployment Procedure Of Hyper Automation RPA Dashboard With Automated Process And Productivity Brochure PDF will help you deliver an outstanding performance that everyone would remember and praise you for. Do download this presentation today.

Illustrating Product Leadership Plan Incorporating Innovative Techniques Key Points Related To Successful Pictures PDF
This slide shows key points related to successful product leadership that involves cross-departmental collaboration, latest tools and trends, metrics to measure performance, recruiting diverse talent. This is a illustrating product leadership plan incorporating innovative techniques key points related to successful pictures pdf template with various stages. Focus and dispense information on six stages using this creative set, that comes with editable features. It contains large content boxes to add your information on topics like improvement, business, collaborations, processes, performance. You can also showcase facts, figures, and other relevant content using this PPT layout. Grab it now.

Techniques To Enhance Brand Awareness Product Promotion Program Overview Diagrams PDF
The slides shows an overview of a promotional program. Key points covered under this are program name, type, platform, objectives, promotional methods, and key metrics to track program success Boost your pitch with our creative Techniques To Enhance Brand Awareness Product Promotion Program Overview Diagrams PDF. Deliver an awe-inspiring pitch that will mesmerize everyone. Using these presentation templates you will surely catch everyones attention. You can browse the ppts collection on our website. We have researchers who are experts at creating the right content for the templates. So you do not have to invest time in any additional work. Just grab the template now and use them.
Formulating Product Development Action Plan To Enhance Client Experience Dashboard Depicting Product Download PDF
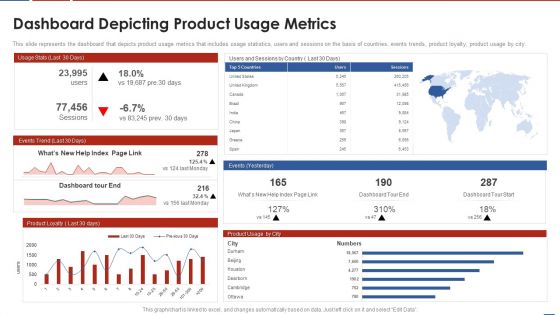
This slide represents the dashboard that depicts product usage metrics that includes usage statistics, users and sessions on the basis of countries, events trends, product loyalty, product usage by city. Deliver an awe inspiring pitch with this creative formulating product development action plan to enhance client experience dashboard depicting product download pdf bundle. Topics like usage statistics, users and sessions on the basis of countries, events trends, product loyalty, product usage by city can be discussed with this completely editable template. It is available for immediate download depending on the needs and requirements of the user.
Formulating Competitive Plan Of Action For Effective Product Leadership Key Points Related To Successful Infographics PDF
This slide shows key points related to successful product leadership that involves cross departmental collaboration, latest tools and trends, metrics to measure performance, recruiting diverse talent. Presenting formulating competitive plan of action for effective product leadership key points related to successful infographics pdf to provide visual cues and insights. Share and navigate important information on six stages that need your due attention. This template can be used to pitch topics like product management, implementation, stakeholder engagement. In addtion, this PPT design contains high resolution images, graphics, etc, that are easily editable and available for immediate download.
Monthly Retail Stock Performance Dashboard Icons PDF
This slide shows monthly inventory performance of retail products for analyzing monthly in stock an out-stock with their values. It include metrics like current inventory available, current inventory value and closing monthly stock etc. Showcasing this set of slides titled Monthly Retail Stock Performance Dashboard Icons PDF. The topics addressed in these templates are Current Inventory Available, Current Inventory Value. All the content presented in this PPT design is completely editable. Download it and make adjustments in color, background, font etc. as per your unique business setting.

QA Modification For Product Quality Development And Consumer Satisfaction Implement Code Quality Brochure PDF
This slide shows the details about Code Quality Measurements Approach for Effective QA Transformation along with details on Software Quality Indicators and Test Metrics such as Reliability, Security, Testability, Rate of Delivery etc. Presenting qa modification for product quality development and consumer satisfaction implement code quality brochure pdf to provide visual cues and insights. Share and navigate important information on seven stages that need your due attention. This template can be used to pitch topics like reliability, performance efficiency, security, maintainability, rate of delivery. In addtion, this PPT design contains high resolution images, graphics, etc, that are easily editable and available for immediate download.
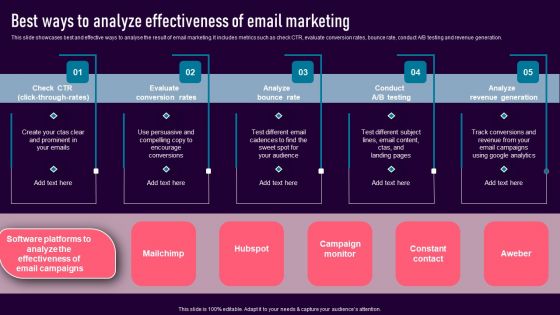
Best Ways To Analyze Effectiveness Of Email Marketing Graphics PDF
This slide showcases best and effective ways to analyse the result of email marketing. It includes metrics such as check CTR, evaluate conversion rates, bounce rate, conduct A B testing and revenue generation. If your project calls for a presentation, then Slidegeeks is your go-to partner because we have professionally designed, easy-to-edit templates that are perfect for any presentation. After downloading, you can easily edit Best Ways To Analyze Effectiveness Of Email Marketing Graphics PDF and make the changes accordingly. You can rearrange slides or fill them with different images. Check out all the handy templates

Best Ways Analyze Effectiveness Music Industry Marketing Plan To Enhance Brand Image Graphics Pdf
This slide showcases best and effective ways to analyse the result of email marketing. It includes metrics such as check CTR, evaluate conversion rates, bounce rate, conduct A B testing and revenue generation. There are so many reasons you need a Best Ways Analyze Effectiveness Music Industry Marketing Plan To Enhance Brand Image Graphics Pdf. The first reason is you can not spend time making everything from scratch, Thus, Slidegeeks has made presentation templates for you too. You can easily download these templates from our website easily.
Kpis To Test And Iterate Customer Segmentation Ppt Icon Professional PDF
This slide presents various metrics for test and monitor effectiveness of customer segmentation and change marketing strategy with changed customer requirements. It highlights KPIs such as cohort segmentation, user churn segmentation, customer lifetime value segmentation, etc. The best PPT templates are a great way to save time, energy, and resources. Slidegeeks have 100 percent editable powerpoint slides making them incredibly versatile. With these quality presentation templates, you can create a captivating and memorable presentation by combining visually appealing slides and effectively communicating your message. Download Kpis To Test And Iterate Customer Segmentation Ppt Icon Professional PDF from Slidegeeks and deliver a wonderful presentation.
Customer Segmentation And Behavioral Analysis Kpis To Test And Iterate Customer Icons PDF
This slide presents various metrics for test and monitor effectiveness of customer segmentation and change marketing strategy with changed customer requirements. It highlights KPIs such as cohort segmentation, user churn segmentation, customer lifetime value segmentation, etc. The best PPT templates are a great way to save time, energy, and resources. Slidegeeks have 100 percent editable powerpoint slides making them incredibly versatile. With these quality presentation templates, you can create a captivating and memorable presentation by combining visually appealing slides and effectively communicating your message. Download Customer Segmentation And Behavioral Analysis Kpis To Test And Iterate Customer Icons PDF from Slidegeeks and deliver a wonderful presentation.

Ppt Team Effort Person Standing Yellow Piece Of Chart PowerPoint Ks2 Templates
PPT team effort person standing yellow piece of chart PowerPoint ks2 Templates-Use this Circular Arrow diagram to show activities that are related to the business plan metrics and monitor the results to determine if the business plan is proceeding as planned. You can apply other 3D Styles and shapes to the slide to enhance your presentations.-PPT team effort person standing yellow piece of chart PowerPoint ks2 Templates-arrow, bar, business, businessman, candidate, cartoon, character, chart, circle, circular, client, communication, company, concept, diagram, finance, financial, flow, growth, human, illustration, increase, information, iteration, man, market, marketing, process, processing, profit, sales, statistics, stats, success, target

Technical Analysis Kpis To Track Website Performance Ppt Model Example Topics PDF
This slide outlines kpis that can be tracked during audit by organization and help in improving the website performance. it also showcases result before and after the implementation of metrics improvement strategies. Showcasing this set of slides titled Technical Analysis Kpis To Track Website Performance Ppt Model Example Topics PDF. The topics addressed in these templates are Page Load Speed, Organic Visibility, Quality Backlinks. All the content presented in this PPT design is completely editable. Download it and make adjustments in color, background, font etc. as per your unique business setting.
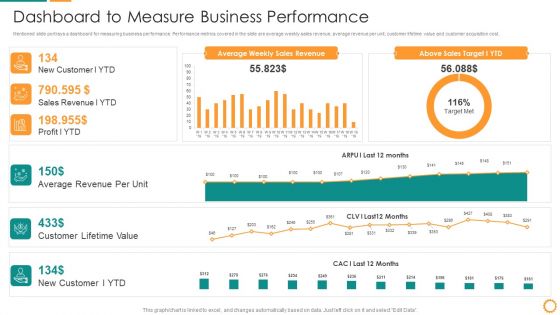
IT Consolidation Post Mergers And Acquisition Dashboard To Measure Business Performance Clipart PDF
Mentioned slide portrays a dashboard for measuring business performance. Performance metrics covered in the slide are average weekly sales revenue, average revenue per unit, customer lifetime value and customer acquisition cost. Deliver and pitch your topic in the best possible manner with this IT Consolidation Post Mergers And Acquisition Dashboard To Measure Business Performance Clipart PDF. Use them to share invaluable insights on Average Revenue, Customer Lifetime Value, Sales Revenue, Sales Target and impress your audience. This template can be altered and modified as per your expectations. So, grab it now.

Overview Of The Food Analyzing Product Launch Success With KPI Dashboard Mockup PDF
The following slide outlines key performance indicator KPI dashboard which will assist marketers to analyze the success of product launch. The metrics covered in the slide are related to total units produced, sales, average selling price ASP, penetrated planned customers, product mix, etc. Find a pre-designed and impeccable Overview Of The Food Analyzing Product Launch Success With KPI Dashboard Mockup PDF. The templates can ace your presentation without additional effort. You can download these easy-to-edit presentation templates to make your presentation stand out from others. So, what are you waiting for Download the template from Slidegeeks today and give a unique touch to your presentation.
Improving Brand Recognition With Message And Differentiation Strategy Impact Of Developing A Product Messaging Icons PDF
Purpose of the following slide displays the impact of developing a product messaging strategy. The following slide highlights the key metrics of brand performance such as brand impressions, website traffic, search volume data etc. Presenting improving brand recognition with message and differentiation strategy impact of developing a product messaging icons pdf to provide visual cues and insights. Share and navigate important information on three stages that need your due attention. This template can be used to pitch topics like increase, recognition, brand, strategy. In addtion, this PPT design contains high resolution images, graphics, etc, that are easily editable and available for immediate download.

Marketing Communication Channels For Increasing Brand Awarenes Impact Of Developing A Product Introduction PDF
Purpose of the following slide displays the impact of developing a product messaging strategy. The following slide highlights the key metrics of brand performance such as brand impressions, website traffic, search volume data etc. This is a marketing communication channels for increasing brand awarenes impact of developing a product introduction pdf template with various stages. Focus and dispense information on three stages using this creative set, that comes with editable features. It contains large content boxes to add your information on topics like recognition, positioning, organization, outreach, brand. You can also showcase facts, figures, and other relevant content using this PPT layout. Grab it now.
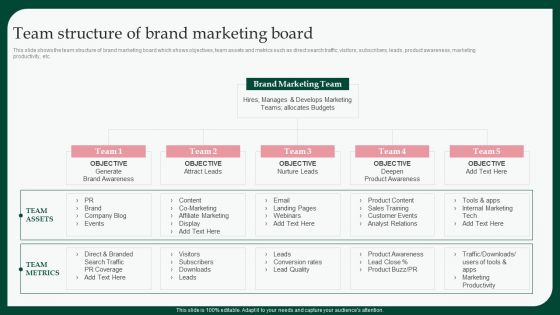
Boosting Product Sales Through Branding Team Structure Of Brand Marketing Themes PDF
This slide shows the team structure of brand marketing board which shows objectives, team assets and metrics such as direct search traffic, visitors, subscribers, leads, product awareness, marketing productivity, etc. Want to ace your presentation in front of a live audience Our Boosting Product Sales Through Branding Team Structure Of Brand Marketing Themes PDF can help you do that by engaging all the users towards you.. Slidegeeks experts have put their efforts and expertise into creating these impeccable powerpoint presentations so that you can communicate your ideas clearly. Moreover, all the templates are customizable, and easy-to-edit and downloadable. Use these for both personal and commercial use.

Agile Group For Product Development Ways To Lead Product Management Team Portrait PDF
This slide shows the ways to lead product management team such as using metrics to set priorities, developing soft skills, creating product roadmap, strategize self improvement, etc. Presenting agile group for product development ways to lead product management team portrait pdf to provide visual cues and insights. Share and navigate important information on five stages that need your due attention. This template can be used to pitch topics like develop soft skills, strategize self improvement, embrace agile methodology to product management. In addtion, this PPT design contains high resolution images, graphics, etc, that are easily editable and available for immediate download.

Assuring Management In Product Innovation To Enhance Processes Ways To Lead Product Management Team Template PDF
This slide shows the ways to lead product management team such as using metrics to set priorities, developing soft skills, creating product roadmap, strategize self improvement, etc.Presenting assuring management in product innovation to enhance processes ways to lead product management team template pdf to provide visual cues and insights. Share and navigate important information on five stages that need your due attention. This template can be used to pitch topics like develop soft skills, create product roadmap, strategize self improvement In addtion, this PPT design contains high resolution images, graphics, etc, that are easily editable and available for immediate download.

Call Center Kpis Dashboard With Data Management Infographics PDF
This slide covers contact center metrics KPI dashboard with call data details. It involves details such as total number of contacts handled, product sales, repeated calls and contact handles per day. Pitch your topic with ease and precision using this Call Center Kpis Dashboard With Data Management Infographics PDF. This layout presents information on Achieved, Contacts Handled, Repeated Calls. It is also available for immediate download and adjustment. So, changes can be made in the color, design, graphics or any other component to create a unique layout.
Development And Operations KPI Dashboard With Central Processing Unit Statistics Icons PDF
This slide covers devops KPI metrics dashboard with central processing unit statistics about input output statistics , network traffic volume under during recorded sessions. Further, this template includes numbers of sessions with waiting time.Showcasing this set of slides titled Development And Operations KPI Dashboard With Central Processing Unit Statistics Icons PDF The topics addressed in these templates are Central Processing, Output Statistics, Resource Limits All the content presented in this PPT design is completely editable. Download it and make adjustments in color, background, font etc. as per your unique business setting.
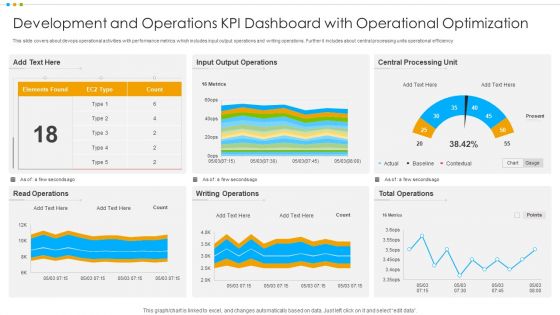
Development And Operations KPI Dashboard With Operational Optimization Pictures PDF
This slide covers about devops operational activities with performance metrics which includes input output operations and writing operations. Further it includes about central processing units operational efficiency.Pitch your topic with ease and precision using this Development And Operations KPI Dashboard With Operational Optimization Pictures PDF This layout presents information on Output Operations, Central Processing, Total Operations It is also available for immediate download and adjustment. So, changes can be made in the color, design, graphics or any other component to create a unique layout.
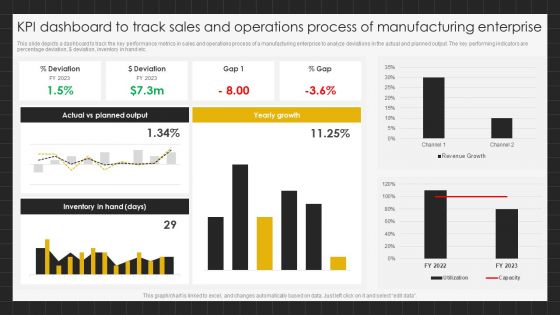
KPI Dashboard To Track Sales And Operations Process Of Manufacturing Enterprise Brochure PDF
This slide depicts a dashboard to track the key performance metrics in sales and operations process of a manufacturing enterprise to analyze deviations in the actual and planned output. The key performing indicators are percentage deviation, dollar deviation, inventory in hand etc.Pitch your topic with ease and precision using this KPI Dashboard To Track Sales And Operations Process Of Manufacturing Enterprise Brochure PDF. This layout presents information on Planned Output, Yearly Growth, Inventory Hand. It is also available for immediate download and adjustment. So, changes can be made in the color, design, graphics or any other component to create a unique layout.

PLM Execution In Company Techniques For Assessing Product Management Opportunities Microsoft PDF
This slide covers the comparison of product metrics with key competitors which focuses on conversion rate, new customers growth rate, churn rate, customer lifetime value, weekly active users, etc. Presenting plm execution in company techniques for assessing product management opportunities microsoft pdf to provide visual cues and insights. Share and navigate important information on four stages that need your due attention. This template can be used to pitch topics like techniques for assessing product management opportunities . In addtion, this PPT design contains high resolution images, graphics, etc, that are easily editable and available for immediate download.

Seasonal Advertising Campaign Kpis To Track Success Of Seasonal Marketing Campaign Summary PDF
This slide showcases the crucial metrics to be tracked for seasonal marketing campaigns. The KPIs covered are ROI, clickthrough rate, cost per acquisition, average order value and return on advertising spends. There are so many reasons you need a Seasonal Advertising Campaign Kpis To Track Success Of Seasonal Marketing Campaign Summary PDF. The first reason is you can not spend time making everything from scratch, Thus, Slidegeeks has made presentation templates for you too. You can easily download these templates from our website easily.

Advertising Programs Management Techniques Kpis To Track Success Of Seasonal Marketing Campaign Formats PDF
This slide showcases the crucial metrics to be tracked for seasonal marketing campaigns. The KPIs covered are ROI, clickthrough rate, cost per acquisition, average order value and return on advertising spends. Want to ace your presentation in front of a live audience Our Advertising Programs Management Techniques Kpis To Track Success Of Seasonal Marketing Campaign Formats PDF can help you do that by engaging all the users towards you. Slidegeeks experts have put their efforts and expertise into creating these impeccable powerpoint presentations so that you can communicate your ideas clearly. Moreover, all the templates are customizable, and easy to edit and downloadable. Use these for both personal and commercial use.
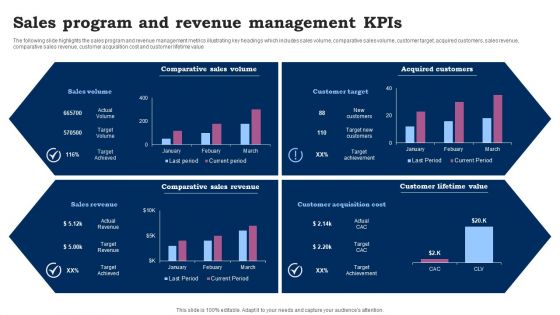
Sales Program And Revenue Management Kpis Ppt Outline Slide Download PDF
The following slide highlights the sales program and revenue management metrics illustrating key headings which includes sales volume, comparative sales volume, customer target, acquired customers, sales revenue, comparative sales revenue, customer acquisition cost and customer lifetime value. Showcasing this set of slides titled Sales Program And Revenue Management Kpis Ppt Outline Slide Download PDF. The topics addressed in these templates are Comparative Sales Volume, Acquired Customers, Comparative Sales Revenue. All the content presented in this PPT design is completely editable. Download it and make adjustments in color, background, font etc. as per your unique business setting.

Post Merger Information Technology Service Delivery Amalgamation KPI Dashboard To Measure Business Template PDF
Mentioned slide portrays a dashboard for measuring business performance. Performance metrics covered in the slide are average weekly sales revenue, average revenue per unit, customer lifetime value and customer acquisition cost. Deliver an awe inspiring pitch with this creative post merger information technology service delivery amalgamation kpi dashboard to measure business template pdf bundle. Topics like kpi dashboard to measure business performance can be discussed with this completely editable template. It is available for immediate download depending on the needs and requirements of the user.

IT Service Incorporation And Administration Dashboard To Measure Business Performance Portrait PDF
Mentioned slide portrays a dashboard for measuring business performance. Performance metrics covered in the slide are average weekly sales revenue, average revenue per unit, customer lifetime value and customer acquisition cost. Deliver and pitch your topic in the best possible manner with this it service incorporation and administration dashboard to measure business performance portrait pdf. Use them to share invaluable insights on sales, revenue, target, acquisition cost and impress your audience. This template can be altered and modified as per your expectations. So, grab it now.
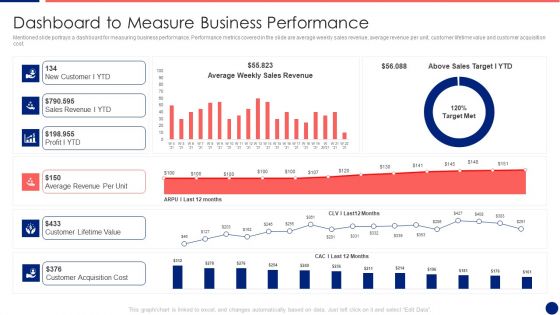
Information Technology Service Integration Post Acquisition Merger Dashboard To Measure Business Pictures PDF
Mentioned slide portrays a dashboard for measuring business performance. Performance metrics covered in the slide are average weekly sales revenue, average revenue per unit, customer lifetime value and customer acquisition cost. Deliver and pitch your topic in the best possible manner with this information technology service integration post acquisition merger dashboard to measure business pictures pdf. Use them to share invaluable insights on sales revenue, average, cost and impress your audience. This template can be altered and modified as per your expectations. So, grab it now.
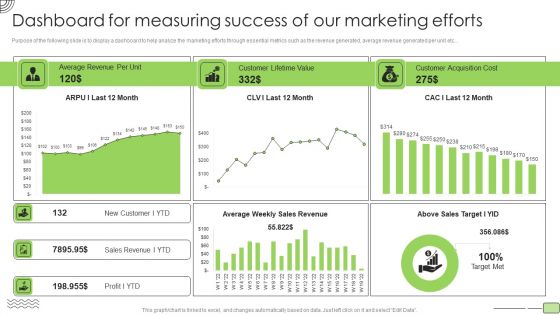
Organic Business Growth Strategies Dashboard For Measuring Success Of Our Marketing Efforts Diagrams PDF
Purpose of the following slide is to display a dashboard to help analyze the marketing efforts through essential metrics such as the revenue generated, average revenue generated per unit etc. Deliver an awe inspiring pitch with this creative Organic Business Growth Strategies Dashboard For Measuring Success Of Our Marketing Efforts Diagrams PDF bundle. Topics like Average Revenue, Customer Lifetime Value, Customer Acquisition Cost can be discussed with this completely editable template. It is available for immediate download depending on the needs and requirements of the user.

 Home
Home