Four Block

Product Comparison Data Bar Graph Ppt Powerpoint Presentation Slides Show
This is a product comparison data bar graph ppt powerpoint presentation slides show. This is a four stage process. The stages in this process are data presentation, content presentation, information presentation.

Project Performance Bar Graph Ppt PowerPoint Presentation Outline
This is a project performance bar graph ppt powerpoint presentation outline. This is a four stage process. The stages in this process are finance, year, business, marketing, future, marketing.

Bar Graph Template 2 Ppt PowerPoint Presentation Introduction
This is a bar graph template 2 ppt powerpoint presentation introduction. This is a four stage process. The stages in this process are bar graph, presentation, year, planning, marketing.
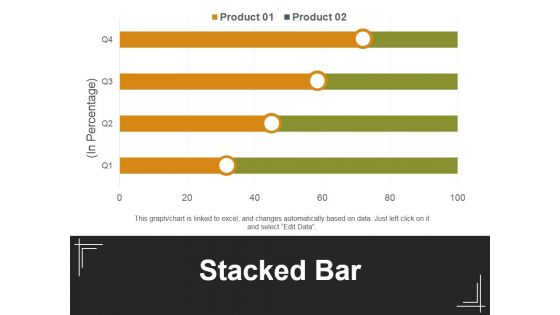
Stacked Bar Template 1 Ppt PowerPoint Presentation Inspiration Background Designs
This is a stacked bar template 1 ppt powerpoint presentation inspiration background designs. This is a four stage process. The stages in this process are in percentage, stacked bar, product, business, marketing.
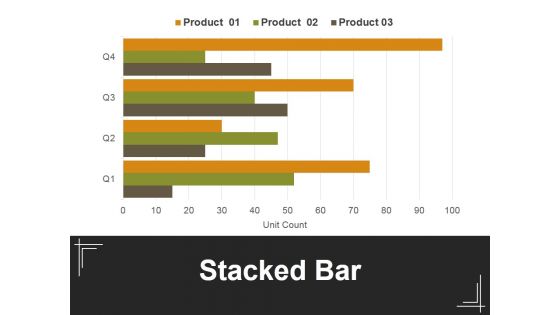
Stacked Bar Template 2 Ppt PowerPoint Presentation Professional Example
This is a stacked bar template 2 ppt powerpoint presentation professional example. This is a four stage process. The stages in this process are in percentage, stacked bar, product, business, marketing.

Bar Graph To Showcase Financial Analysis Ppt PowerPoint Presentation Professional
This is a bar graph to showcase financial analysis ppt powerpoint presentation professional. This is a four stage process. The stages in this process are business, marketing, growth, success, arrows.

Magnifier With Tools And Bar Graph Ppt PowerPoint Presentation Diagrams
This is a magnifier with tools and bar graph ppt powerpoint presentation diagrams. This is a four stage process. The stages in this process are magnifier, strategy, search, business, management.

Bar Graph Ppt PowerPoint Presentation Infographic Template Background
This is a bar graph ppt powerpoint presentation infographic template background. This is a four stage process. The stages in this process are business, strategy, analysis, growth, chart and graph.
Clustered Bar Template 1 Ppt PowerPoint Presentation Icon Gallery
This is a clustered bar template 1 ppt powerpoint presentation icon gallery. This is a four stage process. The stages in this process are finance, management, planning, strategy, marketing.
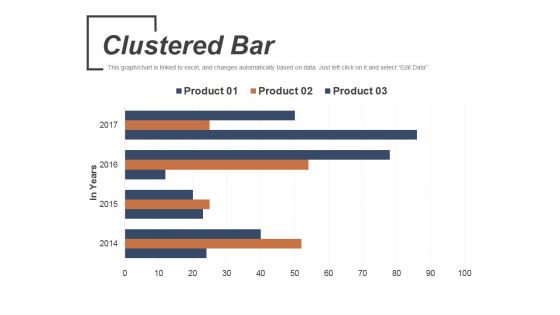
Clustered Bar Template 2 Ppt PowerPoint Presentation Infographic Template Information
This is a clustered bar template 2 ppt powerpoint presentation infographic template information. This is a four stage process. The stages in this process are business, management, planning, strategy, marketing.

Clustered Bar Ppt PowerPoint Presentation Show Slide Portrait
This is a clustered bar ppt powerpoint presentation show slide portrait. This is a four stage process. The stages in this process are product, unit count, graph, business, marketing.

Clustered Bar Finance Ppt PowerPoint Presentation Gallery Background Images
This is a clustered bar finance ppt powerpoint presentation gallery background images. This is a four stage process. The stages in this process are finance, marketing, analysis, business, investment.
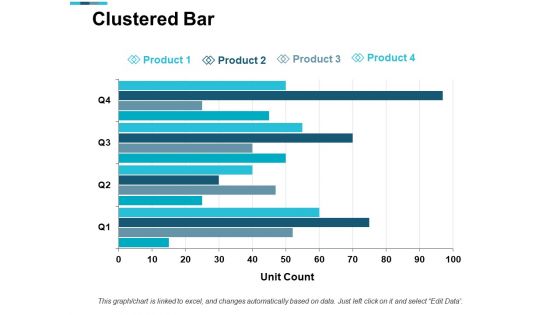
Clustered Bar Finance Ppt PowerPoint Presentation Gallery Graphics Design
This is a clustered bar finance ppt powerpoint presentation gallery graphics design. This is a four stage process. The stages in this process are finance, analysis, business, investment, marketing.
Clustered Bar Chart Marketing Ppt PowerPoint Presentation Layouts Icon
This is a clustered bar chart marketing ppt powerpoint presentation layouts icon. This is a four stage process. The stages in this process are finance, marketing, analysis, business, investment.
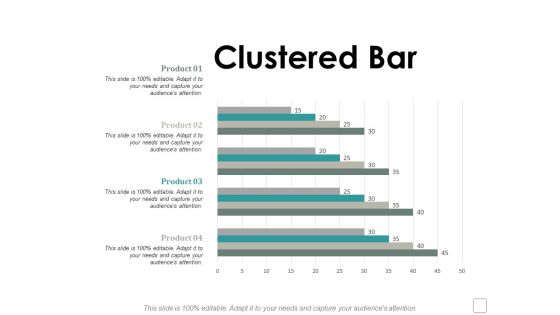
Clustered Bar Finance Ppt Powerpoint Presentation Visual Aids Example File
This is a clustered bar finance ppt powerpoint presentation visual aids example file. This is a four stage process. The stages in this process are finance, marketing, management, investment, analysis.
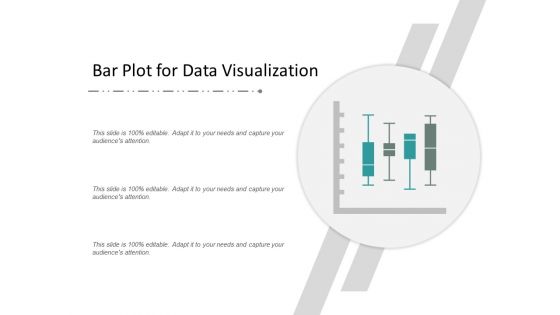
Bar Plot For Data Visualization Ppt Powerpoint Presentation Pictures Guide
This is a bar plot for data visualization ppt powerpoint presentation pictures guide. This is a four stage process. The stages in this process are scatter plot, probability plots, plot diagram.

Red Upward Arrow On Bar Graph Ppt Powerpoint Presentation Infographics
This is a red upward arrow on bar graph ppt powerpoint presentation infographics. This is a four stage process. The stages in this process are increasing arrows, improving arrows, growing arrows.

Donut Pie Chart Bar Ppt PowerPoint Presentation Infographics Slide Portrait
This is a donut pie chart bar ppt powerpoint presentation infographics slide portrait. This is a four stage process. The stages in this process are finance, marketing, analysis, investment, million.
Clustered Bar Chart Finance Ppt Powerpoint Presentation Icon Graphics Template
This is a clustered bar chart finance ppt powerpoint presentation icon graphics template. This is a four stage process. The stages in this process are finance, marketing, management, investment, analysis.
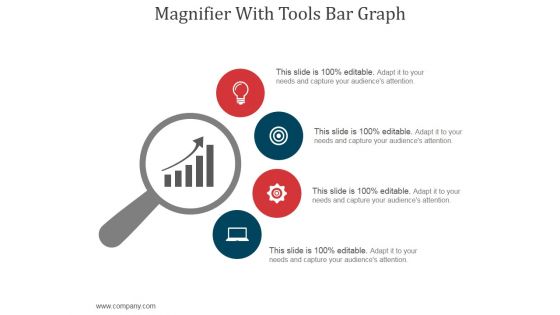
Magnifier With Tools Bar Graph Ppt PowerPoint Presentation Professional
This is a magnifier with tools bar graph ppt powerpoint presentation professional. This is a four stage process. The stages in this process are magnifier, business, marketing, strategy, icons.
Solutions To The Problem Ppt PowerPoint Presentation Icon Influencers
This is a solutions to the problem ppt powerpoint presentation icon influencers. This is a four stage process. The stages in this process are puzzle, solution, problem, marketing, management.

Bank Bar Graph Business Deal Result Analysis Ppt Slides Graphics
This power point icon slide has been designed with four different icons. Icons of bank, bar graph and business deal have been displayed in this slide. Use these icons in your presentations to add professional impact.

Bread Crumb Series Of Connected Pieces Ppt Powerpoint Presentation Infographic Template Examples
This is a bread crumb series of connected pieces ppt powerpoint presentation infographic template examples. This is a four stage process. The stages in this process are path, navigation, bread crumb.
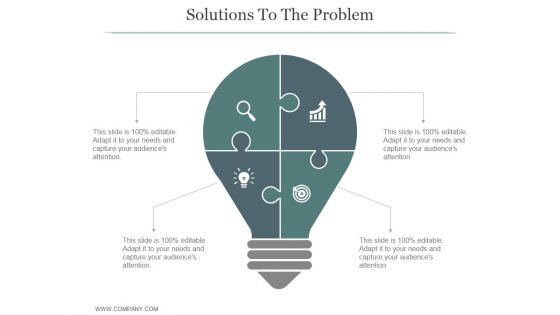
Solutions To The Problem Ppt PowerPoint Presentation Portfolio
This is a solutions to the problem ppt powerpoint presentation portfolio. This is a four stage process. The stages in this process are business, strategy, marketing, process, puzzle, icons, management.
key pieces of an agile marketing implementation ppt powerpoint presentation portfolio icons
This is a key pieces of an agile marketing implementation ppt powerpoint presentation portfolio icons. This is a four stage process. The stages in this process are sprints, stand up meetings, teamwork, business, process.
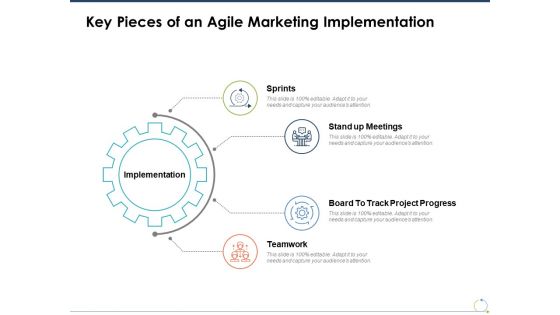
Key Pieces Of An Agile Marketing Implementation Ppt PowerPoint Presentation Layouts Summary
This is a key pieces of an agile marketing implementation ppt powerpoint presentation layouts summary. This is a four stage process. The stages in this process are Business, Marketing, Management.

Key Pieces Of An Agile Marketing Implementation Ppt PowerPoint Presentation Model Background Designs
This is a key pieces of an agile marketing implementation ppt powerpoint presentation model background designs. This is a four stage process. The stages in this process are sprints, meetings, project progress, teamwork, marketing.

Key Pieces Of An Agile Marketing Implementation Ppt PowerPoint Presentation Templates
This is a key pieces of an agile marketing implementation ppt powerpoint presentation templates. This is a four stage process. The stages in this process are business, planning, strategy, marketing, management.

Stack Of Gold Bars In Shape Of Triangle Ppt Powerpoint Presentation Infographic Template Guidelines
This is a stack of gold bars in shape of triangle ppt powerpoint presentation infographic template guidelines. This is a four stage process. The stages in this process are stacked bar, pile bar, heap bar.

Magnifier With Tools And Bar Graph Ppt PowerPoint Presentation Portfolio Templates
This is a magnifier with tools and bar graph ppt powerpoint presentation portfolio templates. This is a four stage process. The stages in this process are magnifier, search, marketing, strategy, business.

3D Bar Chart For Data Representation Ppt PowerPoint Presentation Model Graphic Tips
This is a 3d bar chart for data representation ppt powerpoint presentation model graphic tips. This is a four stage process. The stages in this process are art, colouring, paint brush.
3D Bar Chart To Display Data Ppt PowerPoint Presentation Icon Design Inspiration
This is a 3d bar chart to display data ppt powerpoint presentation icon design inspiration. This is a four stage process. The stages in this process are art, colouring, paint brush.
Stock Market Trend Dollar Sign On Bar Graph Ppt Powerpoint Presentation Show Deck
This is a stock market trend dollar sign on bar graph ppt powerpoint presentation show deck. This is a four stage process. The stages in this process are stock market, financial market, bull market.

Bar Graph To Present Financial Information Ppt PowerPoint Presentation Show Tips
This is a bar graph to present financial information ppt powerpoint presentation show tips. This is a four stage process. The stages in this process are stock market, financial markets, bull market.

Bar Graph With Downward Arrow For Business Failure Ppt PowerPoint Presentation Inspiration Graphics
This is a bar graph with downward arrow for business failure ppt powerpoint presentation inspiration graphics. This is a four stage process. The stages in this process are business failure, unsuccessful business, business non success.
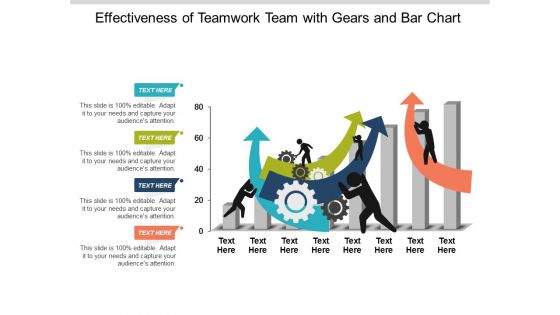
Effectiveness Of Teamwork Team With Gears And Bar Chart Ppt Powerpoint Presentation Ideas Information
This is a effectiveness of teamwork team with gears and bar chart ppt powerpoint presentation ideas information. This is a four stage process. The stages in this process are team performance, member performance, group performance.
Visual Data Presentation With Bar Chart Ppt PowerPoint Presentation Portfolio Brochure
This is a visual data presentation with bar chart ppt powerpoint presentation portfolio brochure. This is a four stage process. The stages in this process are visual aids, communication, business.

Economic Growth Arrow With Bar Graph On Human Hand Ppt PowerPoint Presentation Infographics Ideas
This is a economic growth arrow with bar graph on human hand ppt powerpoint presentation infographics ideas. This is a four stage process. The stages in this process are rising arrow, growing arrow, increasing arrow.
Financial Success Arrow On Bar Chart Ppt PowerPoint Presentation Ideas Display
This is a financial success arrow on bar chart ppt powerpoint presentation ideas display. This is a four stage process. The stages in this process are rising arrow, growing arrow, increasing arrow.
Bar Graph To Show Company Sales Budget Ppt PowerPoint Presentation Sample
This is a bar graph to show company sales budget ppt powerpoint presentation sample. This is a four stage process. The stages in this process are business, finance, growth, success, marketing, arrow.
Clustered Bar Chart Yearly Operating Plan Ppt PowerPoint Presentation Styles Icon
This is a clustered bar chart yearly operating plan ppt powerpoint presentation styles icon. This is a four stage process. The stages in this process are business, management, strategy, analysis, marketing.
Bar Graph Icon For Data Analysis Ppt PowerPoint Presentation Pictures Ideas
This is a bar graph icon for data analysis ppt powerpoint presentation pictures ideas. This is a four stage process. The stages in this process are financial analysis, quantitative, statistical modelling.

Financial Analysis Vector Bar Graph With Magnifying Glass Ppt PowerPoint Presentation Gallery Design Ideas
This is a financial analysis vector bar graph with magnifying glass ppt powerpoint presentation gallery design ideas. This is a four stage process. The stages in this process are marketing analytics, marketing performance, marketing discovery.
Worldwide Market Trends Mobile With Bar Graph And Globe Ppt PowerPoint Presentation Styles Demonstration
This is a worldwide market trends mobile with bar graph and globe ppt powerpoint presentation styles demonstration. This is a four stage process. The stages in this process are marketing analytics, marketing performance, marketing discovery.
Financial And Income Growth Bar Graph Dollar Sign Ppt PowerPoint Presentation Professional Shapes
This is a financial and income growth bar graph dollar sign ppt powerpoint presentation professional shapes. This is a four stage process. The stages in this process are growth, increase sales, increase revenue.

Financial Growth Strategy Arrow Up On Bar Graph Ppt PowerPoint Presentation Gallery Example
This is a financial growth strategy arrow up on bar graph ppt powerpoint presentation gallery example. This is a four stage process. The stages in this process are growth, increase sales, increase revenue.
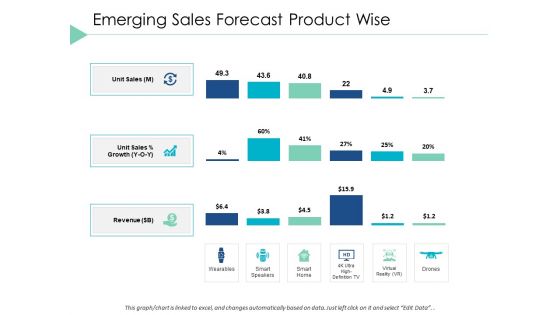
Emerging Sales Forecast Product Wise Bar Ppt PowerPoint Presentation Portfolio Slide Portrait
This is a emerging sales forecast product wise bar ppt powerpoint presentation portfolio slide portrait. This is a four stage process. The stages in this process are finance, marketing, analysis, investment, million.
Stock Market Analysis Magnifying Glass Over Bar Graph And Dollar Sign Ppt PowerPoint Presentation Icon Visual Aids
This is a stock market analysis magnifying glass over bar graph and dollar sign ppt powerpoint presentation icon visual aids. This is a four stage process. The stages in this process are stock market, financial markets, bull market.

Growing Plants On Stack Of Coins For Money Growth Ppt Powerpoint Presentation Outline Display
This is a growing plants on stack of coins for money growth ppt powerpoint presentation outline display. This is a four stage process. The stages in this process are stacked bar, pile bar, heap bar.
Stack Of Coins For Bitcoin Transactions Ppt Powerpoint Presentation Icon Infographics
This is a stack of coins for bitcoin transactions ppt powerpoint presentation icon infographics. This is a four stage process. The stages in this process are stacked bar, pile bar, heap bar.

Pie Chart For Data Comparison Ppt PowerPoint Presentation Portfolio Layouts
This is a pie chart for data comparison ppt powerpoint presentation portfolio layouts. This is a four stage process. The stages in this process are sectioned circle, segmented circle, partitioned circle.

key functions in business marketing quality assurance ppt powerpoint presentation styles visual aids
This is a key functions in business marketing quality assurance ppt powerpoint presentation styles visual aids. This is a four stage process. The stages in this process are cross functional team, cross sectional team, teams structure.

Business Diagram Business Finance Study PowerPoint Ppt Presentation
Our above slide displays business finance study diagram. It contains x-y graph of finance efficiency further divided into four sections. This diagram reflects finance efficiency depends on storekeepers, disciplined operators, constrained advisors and value integrators.
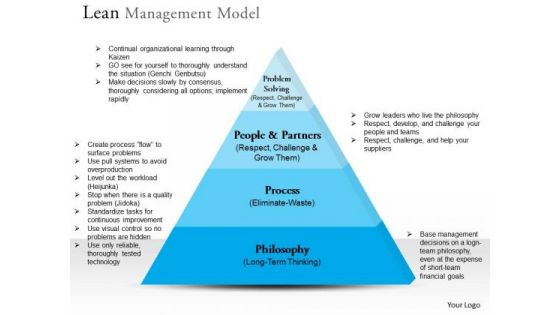
Business Framework Lean Management Model PowerPoint Presentation
This business slide displays lean management model. It contains pyramid diagram with four sections depicting concepts of problem solving, people and partners, process of eliminate waste and philosophy. Lean management focus on improving the work process by elimination of waste.
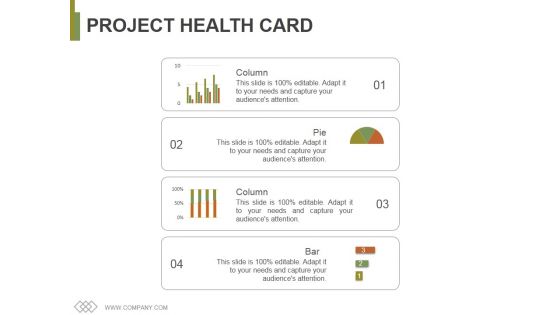
Project Health Card Template 1 Ppt PowerPoint Presentation Summary Visual Aids
This is a project health card template 1 ppt powerpoint presentation summary visual aids. This is a four stage process. The stages in this process are column, pie, bar, management, business.

Revenue Split By Product Segment Template 1 Ppt PowerPoint Presentation Infographics Smartart
This is a revenue split by product segment template 1 ppt powerpoint presentation infographics smartart. This is a four stage process. The stages in this process are business, finance, marketing, bar graph, product.

Profitability Ratios Template 3 Ppt PowerPoint Presentation Gallery Slide Portrait
This is a profitability ratios template 3 ppt powerpoint presentation gallery slide portrait. This is a four stage process. The stages in this process are category, roce, net income, business, bar graph.

Current Quarter Portfolio Template 1 Ppt PowerPoint Presentation Styles Mockup
This is a current quarter portfolio template 1 ppt powerpoint presentation styles mockup. This is a four stage process. The stages in this process are current quarter portfolio, pie chart, bar graph, business, marketing.
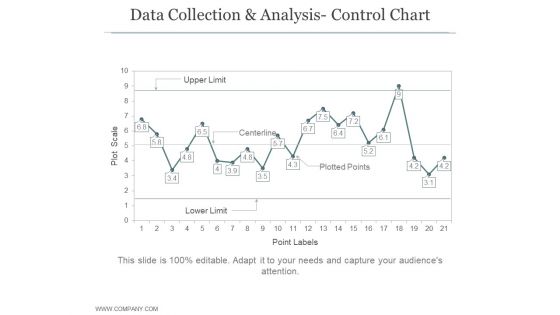
Data Collection And Analysis Control Chart Ppt PowerPoint Presentation Example File
This is a data collection and analysis control chart ppt powerpoint presentation example file. This is a four stage process. The stages in this process are business, strategy, marketing, bar graph, growth strategy.
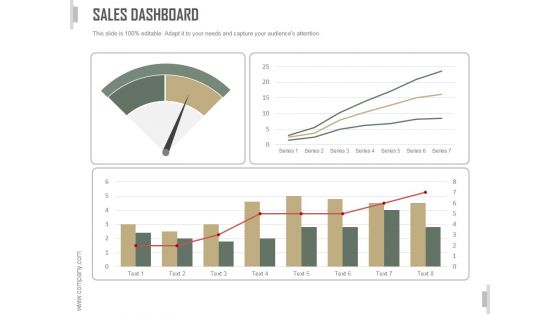
Sales Dashboard Ppt PowerPoint Presentation Design Templates
This is a sales dashboard ppt powerpoint presentation design templates. This is a four stage process. The stages in this process are business, strategy, marketing, analysis, bar graph, growth strategy.

 Home
Home