Forecast Dashboard
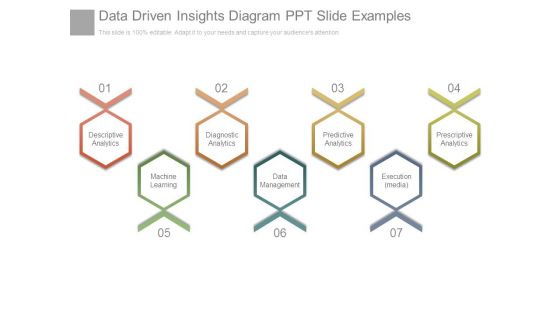
Data Driven Insights Diagram Ppt Slide Examples
This is a data driven insights diagram ppt slide examples. This is a seven stage process. The stages in this process are descriptive analytics, diagnostic analytics, predictive analytics, prescriptive analytics, machine learning, data management, execution media.
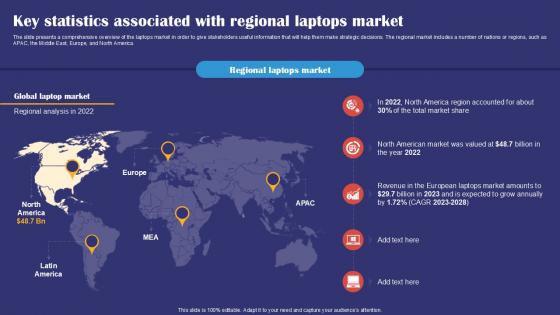
Key Statistics Associated With Regional Laptops Market Smartphones Industry Report PPT Sample IR SS V
The slide presents a comprehensive overview of the laptops market in order to give stakeholders useful information that will help them make strategic decisions. The regional market includes a number of nations or regions, such as APAC, the Middle East, Europe, and North America. This Key Statistics Associated With Regional Laptops Market Smartphones Industry Report PPT Sample IR SS V is perfect for any presentation, be it in front of clients or colleagues. It is a versatile and stylish solution for organizing your meetings. The Key Statistics Associated With Regional Laptops Market Smartphones Industry Report PPT Sample IR SS V features a modern design for your presentation meetings. The adjustable and customizable slides provide unlimited possibilities for acing up your presentation. Slidegeeks has done all the homework before launching the product for you. So, do not wait, grab the presentation templates today
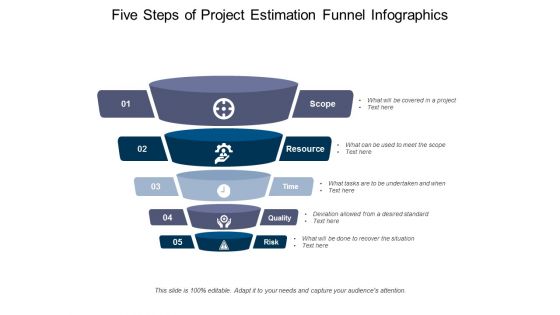
Five Steps Of Project Estimation Funnel Infographics Ppt PowerPoint Presentation Infographics Example Introduction
Presenting this set of slides with name five steps of project estimation funnel infographics ppt powerpoint presentation infographics example introduction. This is a five stage process. The stages in this process are project funnel, performance management, planning. This is a completely editable PowerPoint presentation and is available for immediate download. Download now and impress your audience.

Overview Of Survey Methods Competitive Intelligence Guide To Determine Market Pictures Pdf
This slide provides information of surveys as a data collection method to improve market intelligence of business. It also highlights various types of surveys which are online surveys, in person surveys, telephone surveys, email surveys and paper surveys. Do you have an important presentation coming up Are you looking for something that will make your presentation stand out from the rest Look no further than Overview Of Survey Methods Competitive Intelligence Guide To Determine Market Pictures Pdf. With our professional designs, you can trust that your presentation will pop and make delivering it a smooth process. And with Slidegeeks, you can trust that your presentation will be unique and memorable. So why wait Grab Overview Of Survey Methods Competitive Intelligence Guide To Determine Market Pictures Pdf today and make your presentation stand out from the rest.

Business Education PowerPoint Templates Business Bar Graph Data Driven Ppt Slides
Business Education PowerPoint Templates Business bar graph data driven PPT Slides-This PowerPoint slide is a data driven Columns Chart. The number of columns depend on the data.-Business Editable PowerPoint Templates Business beveled column chart PPT Slides-This ppt can be used for concepts relating to-chart,, graph, growth, investment, , market, percentage, , presentation report, results, statistics, stock, success and business.
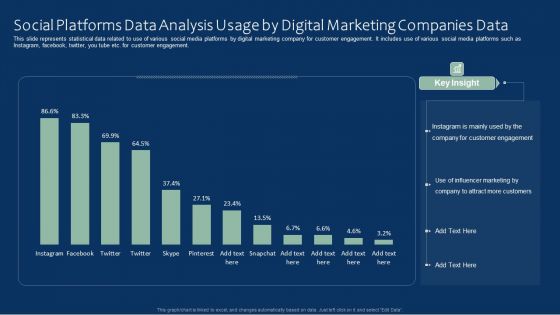
Social Platforms Data Analysis Usage By Digital Marketing Companies Data Clipart PDF
This slide represents statistical data related to use of various social media platforms by digital marketing company for customer engagement. It includes use of various social media platforms such as Instagram, facebook, twitter, you tube etc. for customer engagement. Pitch your topic with ease and precision using this Social Platforms Data Analysis Usage By Digital Marketing Companies Data Clipart PDF. This layout presents information on Social Platforms Data Analysis, Digital Marketing Companies Data. It is also available for immediate download and adjustment. So, changes can be made in the color, design, graphics or any other component to create a unique layout.

State Location On Africa Map With Percentage Data Powerpoint Slides
This PowerPoint template displays state location on Africa map with percentage data. This Map template can be used for annual growth report. This slide can also be used by school students for educational projects.
Map Of Czech With Percentage Data And Icons Powerpoint Slides
This PowerPoint template displays map of Czech with percentage data and icons. This Map template can be used for annual growth report. This slide can also be used by school students for educational projects.

Table Of Contents For Construction Project Cost Benefit Analysis Report For Mortgage Approval Download PDF
The Table Of Contents For Construction Project Cost Benefit Analysis Report For Mortgage Approval Download PDF is a compilation of the most recent design trends as a series of slides. It is suitable for any subject or industry presentation, containing attractive visuals and photo spots for businesses to clearly express their messages. This template contains a variety of slides for the user to input data, such as structures to contrast two elements, bullet points, and slides for written information. Slidegeeks is prepared to create an impression.
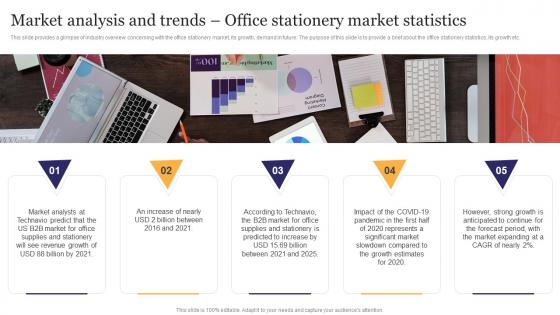
Market Analysis And Trends Office Stationery Business Plan Go To Market Strategy Download Pdf
This slide provides a glimpse of industry overview concerning with the office stationery market, its growth, demand in future. The purpose of this slide is to provide a brief about the office stationery statistics, its growth etc. This Market Analysis And Trends Office Stationery Business Plan Go To Market Strategy Download Pdf is perfect for any presentation, be it in front of clients or colleagues. It is a versatile and stylish solution for organizing your meetings. The Market Analysis And Trends Office Stationery Business Plan Go To Market Strategy Download Pdf features a modern design for your presentation meetings. The adjustable and customizable slides provide unlimited possibilities for acing up your presentation. Slidegeeks has done all the homework before launching the product for you. So, do not wait, grab the presentation templates today

Guy Kawasaki 10 20 30 Rule Investor Financial Projections And Key Metrics Rules PDF
This slide illustrates key performance indicators highlighting the financial projections of the company post product launch. KPIs covered here are revenue growth, profit margin along with customer acquisition cost.Deliver an awe inspiring pitch with this creative guy kawasaki 10 20 30 rule investor financial projections and key metrics rules pdf bundle. Topics like financial projections and key metrics can be discussed with this completely editable template. It is available for immediate download depending on the needs and requirements of the user.

Key Program Kpis For Project Management Ppt Slides Graphic Images PDF
The following slide highlights the key program metrics for program management illustrating key headings which includes active program, total budget, budget utilized, budget utilization, total program, completed program, overdue program and completion status. Pitch your topic with ease and precision using this Key Program Kpis For Project Management Ppt Slides Graphic Images PDF. This layout presents information on Program Budget, Active Program, Total Budget. It is also available for immediate download and adjustment. So, changes can be made in the color, design, graphics or any other component to create a unique layout.

Global Internet Of Things In Manufacturing Iot Manufacturing Ai Big Data And Predictive Guidelines PDF
This slide highlights the IoT components of manufacturing which includes artificial intelligence AI, big data and predictive analysis with the importance to businesses. This modern and well-arranged Global Internet Of Things In Manufacturing Iot Manufacturing Ai Big Data And Predictive Guidelines PDF provides lots of creative possibilities. It is very simple to customize and edit with the Powerpoint Software. Just drag and drop your pictures into the shapes. All facets of this template can be edited with Powerpoint, no extra software is necessary. Add your own material, put your images in the places assigned for them, adjust the colors, and then you can show your slides to the world, with an animated slide included.
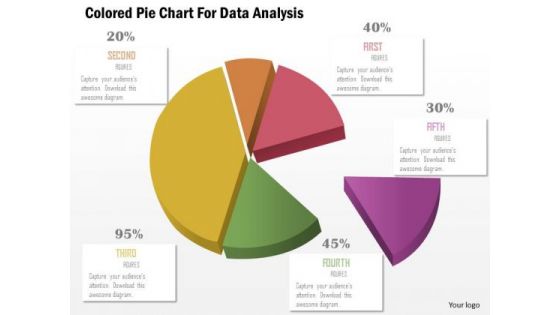
Business Diagram Colored Pie Chart For Data Analysis Presentation Template
This business slide displays pie chart. This diagram is a data visualization tool that gives you a simple way to present statistical information. This slide helps your audience examine and interpret the data you present.

One Page Summary Annual Committee Report Template Department Of Entomology One Pager Documents
This one page shows the information regarding annual committee report template department of entomology which includes executive summary, role of department, goals, vision, overview, other projects, data management, etc. Presenting you a fantastic One Page Summary Annual Committee Report Template Department Of Entomology One Pager Documents. This piece is crafted on hours of research and professional design efforts to ensure you have the best resource. It is completely editable and its design allow you to rehash its elements to suit your needs. Get this One Page Summary Annual Committee Report Template Department Of Entomology One Pager Documents A4 One-pager now.

System Analysis And Design Audit Checklist Ppt Layouts Pictures PDF
This slide shows system analysis and designing timeline with key phases. It provides information about gathering requirements, data preparation, analysis, modeling and finalizing project. Presenting System Analysis And Design Audit Checklist Ppt Layouts Pictures PDF to dispense important information. This template comprises one stages. It also presents valuable insights into the topics including JAD And Prototype, Does Database Design, Supports Requirements. This is a completely customizable PowerPoint theme that can be put to use immediately. So, download it and address the topic impactfully.

Ten Slides Guy Kawasaki Investor Deck Financial Projections And Key Metrics Structure PDF
This slide illustrates key performance indicators highlighting the financial projections of the company post product launch. KPIs covered here are revenue growth, profit margin along with customer acquisition cost. Deliver an awe-inspiring pitch with this creative ten slides guy kawasaki investor deck financial projections and key metrics structure pdf. bundle. Topics like financial projections and key metrics can be discussed with this completely editable template. It is available for immediate download depending on the needs and requirements of the user.

Key Technologies For Big Data Analytics In Organization Ppt Outline Gridlines PDF
The following slide highlights applications of key technologies for big data analytics in business industry to discover hardware and software solutions for processing data. It includes components such as predictive analysis, nosql database, knowledge discovery tools , data virtualization etc. Presenting Key Technologies For Big Data Analytics In Organization Ppt Outline Gridlines PDF to dispense important information. This template comprises five stages. It also presents valuable insights into the topics including Predictive Analytics, Knowledge Discovery Tools, Data Virtualization, Distributed Storage . This is a completely customizable PowerPoint theme that can be put to use immediately. So, download it and address the topic impactfully.
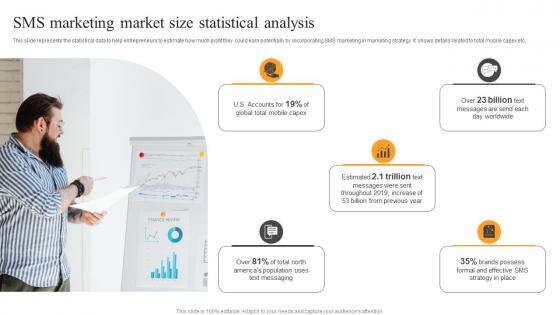
SMS Marketing Market Size Statistical Text Message Advertising Solutions Enhancing Background Pdf
This slide represents the statistical data to help entrepreneurs to estimate how much profit they could earn potentially by incorporating SMS marketing in marketing strategy. It shows details related to total mobile capex etc. Present like a pro with SMS Marketing Market Size Statistical Text Message Advertising Solutions Enhancing Background Pdf Create beautiful presentations together with your team, using our easy to use presentation slides. Share your ideas in real time and make changes on the fly by downloading our templates. So whether you are in the office, on the go, or in a remote location, you can stay in sync with your team and present your ideas with confidence. With Slidegeeks presentation got a whole lot easier. Grab these presentations today.
Business Intelligence And Big Data Analytics Project Plan Lifecycle Icons PDF
This slide shows the data analytics lifecycle covering multiple stages starting from presenting the business case to data identification, data validation, analysis and ending at data visualization and utilization of results. Deliver an awe inspiring pitch with this creative business intelligence and big data analytics project plan lifecycle icons pdf bundle. Topics like business case evaluation, data identification, data analysis, data visualization, data extraction can be discussed with this completely editable template. It is available for immediate download depending on the needs and requirements of the user.

Profit Report Image With Pen And Calculator Ppt PowerPoint Presentation Gallery Styles PDF
Presenting profit report image with pen and calculator ppt powerpoint presentation gallery styles pdf to dispense important information. This template comprises three stages. It also presents valuable insights into the topics including profit report image with pen and calculator. This is a completely customizable PowerPoint theme that can be put to use immediately. So, download it and address the topic impactfully.
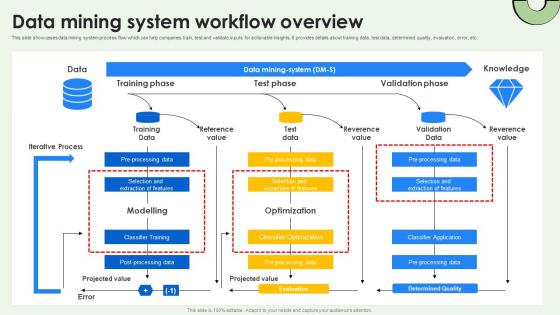
Data Warehousing And Data Mining System Workflow Overview AI SS V
This slide showcases data mining system process flow which can help companies train, test and validate inputs for actionable insights. It provides details about training data, test data, determined quality, evaluation, error, etc. Take your projects to the next level with our ultimate collection of Data Warehousing And Data Mining System Workflow Overview AI SS V. Slidegeeks has designed a range of layouts that are perfect for representing task or activity duration, keeping track of all your deadlines at a glance. Tailor these designs to your exact needs and give them a truly corporate look with your own brand colors they will make your projects stand out from the rest

Example Of Holistic Approach For Data Collection Powerpoint Slide Background Image
This is a example of holistic approach for data collection powerpoint slide background image. This is a eight stage process. The stages in this process are report, prevent, panet management, identify, customer transaction surveys, online surveys.

Transformation Toolkit Competitive Intelligence Information Analysis Business Case And Key Data Analytics Mockup PDF
This slide covers the business case of data analytics project that defines the major steps, key tasks and project owners with multiple strategic layer of business. From laying roadmaps to briefing everything in detail, our templates are perfect for you. You can set the stage with your presentation slides. All you have to do is download these easy to edit and customizable templates. Transformation Toolkit Competitive Intelligence Information Analysis Business Case And Key Data Analytics Mockup PDF will help you deliver an outstanding performance that everyone would remember and praise you for. Do download this presentation today.
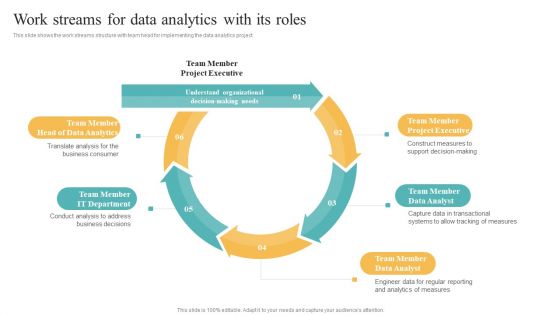
Transformation Toolkit Competitive Intelligence Information Analysis Work Streams For Data Analytics Infographics PDF
This slide shows the work streams structure with team head for implementing the data analytics project. If your project calls for a presentation, then Slidegeeks is your go to partner because we have professionally designed, easy to edit templates that are perfect for any presentation. After downloading, you can easily edit Transformation Toolkit Competitive Intelligence Information Analysis Work Streams For Data Analytics Infographics PDF and make the changes accordingly. You can rearrange slides or fill them with different images. Check out all the handy templates.
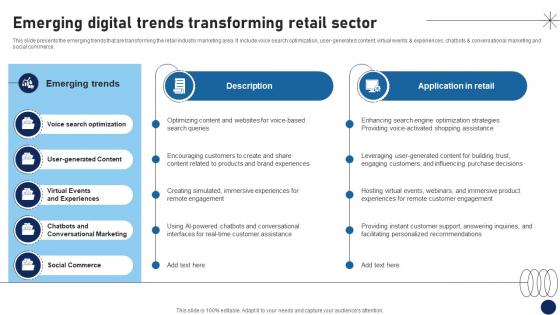
Emerging Digital Trends Transforming Retail Sector DT SS V
This slide presents the emerging trends that are transforming the retail industry marketing area. It include voice search optimization, user-generated content, virtual events and experiences, chatbots and conversational marketing and social commerce.Are you searching for a Emerging Digital Trends Transforming Retail Sector DT SS V that is uncluttered, straightforward, and original Its easy to edit, and you can change the colors to suit your personal or business branding. For a presentation that expresses how much effort you have put in, this template is ideal With all of its features, including tables, diagrams, statistics, and lists, its perfect for a business plan presentation. Make your ideas more appealing with these professional slides. Download Emerging Digital Trends Transforming Retail Sector DT SS V from Slidegeeks today.
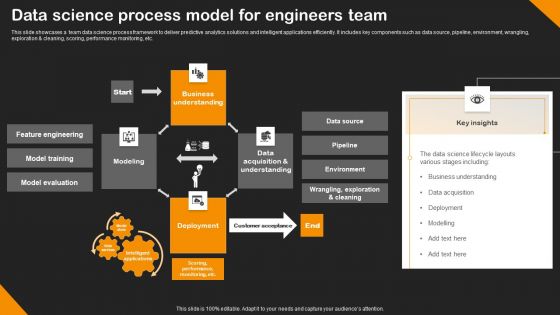
Data Science Process Model For Engineers Team Rules PDF
This slide showcases a team data science process framework to deliver predictive analytics solutions and intelligent applications efficiently. It includes key components such as data source, pipeline, environment, wrangling, exploration and cleaning, scoring, performance monitoring, etc. Showcasing this set of slides titled Data Science Process Model For Engineers Team Rules PDF. The topics addressed in these templates are Model Training, Model Evaluation, Business Understanding. All the content presented in this PPT design is completely editable. Download it and make adjustments in color, background, font etc. as per your unique business setting.
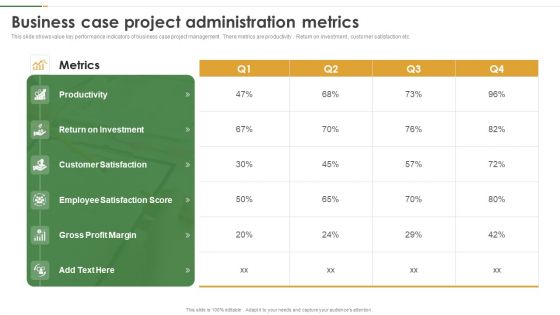
Business Case Project Administration Metrics Template PDF
This slide shows value key performance indicators of business case project management . There metrics are productivity . Return on investment , customer satisfaction etc. Showcasing this set of slides titled Business Case Project Administration Metrics Template PDF. The topics addressed in these templates are Productivity, Metrics, Return On Investment. All the content presented in this PPT design is completely editable. Download it and make adjustments in color, background, font etc. as per your unique business setting.
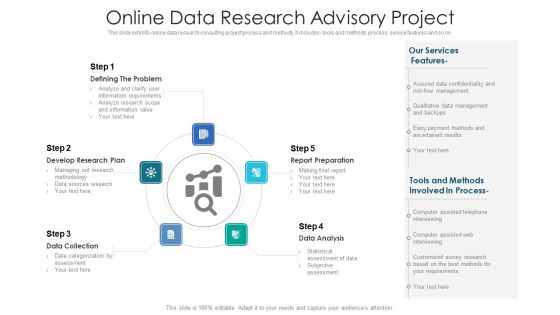
Online Data Research Advisory Project Ppt PowerPoint Presentation File Themes PDF
This slide exhibits online data research consulting project process and methods, It includes- tools and methods, process, service features and so on. Presenting online data research advisory project ppt powerpoint presentation file themes pdf to dispense important information. This template comprises five stages. It also presents valuable insights into the topics including report preparation, data analysis, data collection, develop research plan, problem. This is a completely customizable PowerPoint theme that can be put to use immediately. So, download it and address the topic impactfully.
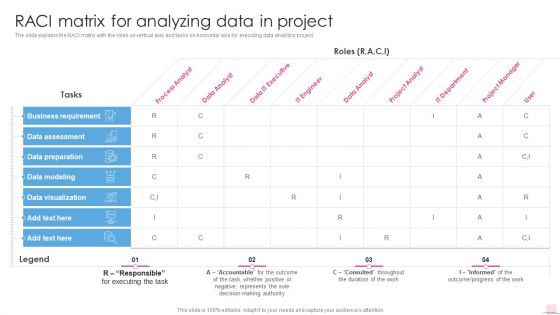
Raci Matrix For Analyzing Data In Project Business Analysis Modification Toolkit Demonstration PDF
The slide explains the RACI matrix with the roles on vertical axis and tasks on horizontal axis for executing data analytics project.Deliver and pitch your topic in the best possible manner with this Raci Matrix For Analyzing Data In Project Business Analysis Modification Toolkit Demonstration PDF. Use them to share invaluable insights on Business Requirement, Data Assessment, Data Preparation and impress your audience. This template can be altered and modified as per your expectations. So, grab it now.
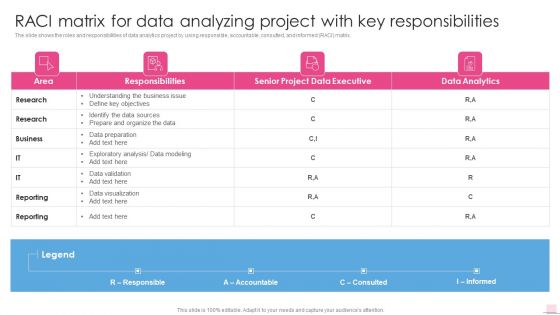
Raci Matrix For Data Analyzing Project With Key Business Analysis Modification Toolkit Mockup PDF
The slide shows the roles and responsibilities of data analytics project by using responsible, accountable, consulted, and informed RACI matrix.Deliver and pitch your topic in the best possible manner with this Raci Matrix For Data Analyzing Project With Key Business Analysis Modification Toolkit Mockup PDF. Use them to share invaluable insights on Understanding Business, Identify Data, Data Visualization and impress your audience. This template can be altered and modified as per your expectations. So, grab it now.
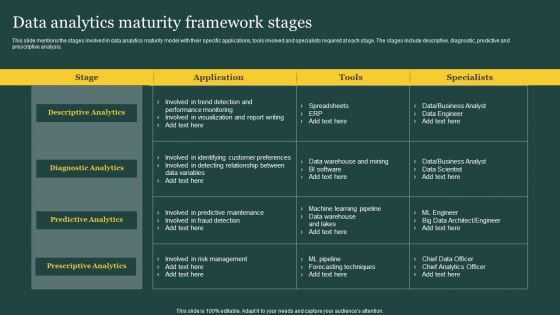
Data Analytics Maturity Framework Stages Ppt PowerPoint Presentation File Demonstration PDF
This slide mentions the stages involved in data analytics maturity model with their specific applications, tools involved and specialists required at each stage. The stages include descriptive, diagnostic, predictive and prescriptive analysis. Showcasing this set of slides titled Data Analytics Maturity Framework Stages Ppt PowerPoint Presentation File Demonstration PDF. The topics addressed in these templates are Descriptive Analytics, Diagnostic Analytics, Predictive Analytics, Prescriptive Analytics. All the content presented in this PPT design is completely editable. Download it and make adjustments in color, background, font etc. as per your unique business setting.

Training Project Handover Procedure Report Designs PDF
The following slide showcases handover report to transfer project details and files to new manager. The report covers project name, handed and taken over by place, date and time. Pitch your topic with ease and precision using this Training Project Handover Procedure Report Designs PDF. This layout presents information on Data Handover, Handover Method, Communication. It is also available for immediate download and adjustment. So, changes can be made in the color, design, graphics or any other component to create a unique layout.
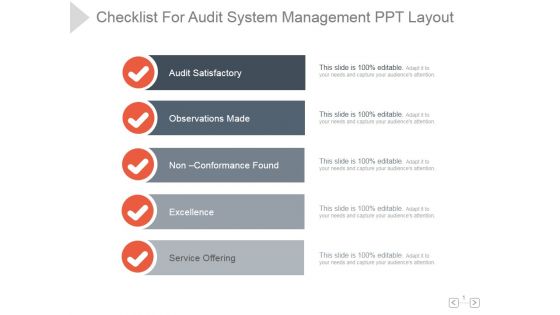
Checklist For Audit System Management Ppt PowerPoint Presentation Background Designs
This is a checklist for audit system management ppt powerpoint presentation background designs. This is a five stage process. The stages in this process are audit satisfactory, observations made, non conformance found, excellence, service offering.
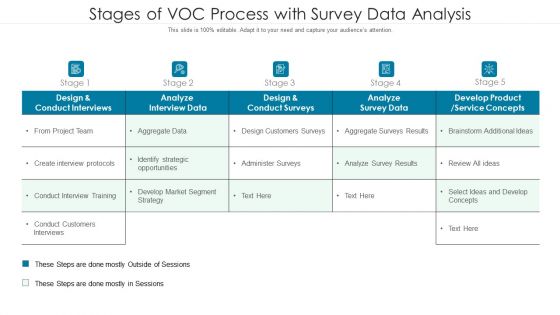
Stages Of Voc Process With Survey Data Analysis Ppt PowerPoint Presentation File Clipart Images PDF
Showcasing this set of slides titled stages of voc process with survey data analysis ppt powerpoint presentation file clipart images pdf. The topics addressed in these templates are strategy, market, develop. All the content presented in this PPT design is completely editable. Download it and make adjustments in color, background, font etc. as per your unique business setting.
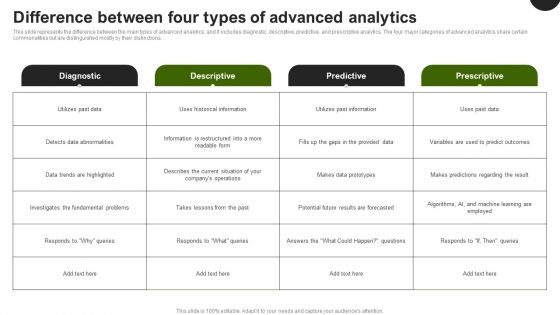
Predictive Analytics In The Age Of Big Data Difference Between Four Types Of Advanced Analytics Summary PDF
This slide represents the difference between the main types of advanced analytics, and it includes diagnostic, descriptive, predictive, and prescriptive analytics. The four major categories of advanced analytics share certain commonalities but are distinguished mostly by their distinctions. There are so many reasons you need a Predictive Analytics In The Age Of Big Data Difference Between Four Types Of Advanced Analytics Summary PDF. The first reason is you cannot spend time making everything from scratch, Thus, Slidegeeks has made presentation templates for you too. You can easily download these templates from our website easily.

Survey Results Showing Competitor How To Conduct Competitive Assessment Portrait Pdf
This slide showcases statistical data presenting survey results on how often marketers assess market competition. Its purpose is to control business positioning strategy and acquire maximum customer base This modern and well arranged Survey Results Showing Competitor How To Conduct Competitive Assessment Portrait Pdf provides lots of creative possibilities. It is very simple to customize and edit with the Powerpoint Software. Just drag and drop your pictures into the shapes. All facets of this template can be edited with Powerpoint no extra software is necessary. Add your own material, put your images in the places assigned for them, adjust the colors, and then you can show your slides to the world, with an animated slide included.
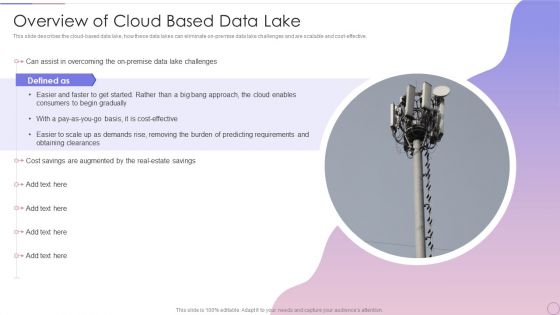
Data Lake Architecture Future Of Data Analysis Overview Of Cloud Based Data Professional PDF
Deliver an awe inspiring pitch with this creative Data Lake Architecture Future Of Data Analysis Overview Of Cloud Based Data Professional PDF bundle. Topics like Lake Challenges, Predicting Requirements, Cost Savings can be discussed with this completely editable template. It is available for immediate download depending on the needs and requirements of the user.

Person Making Calculations On Financial Report Ppt PowerPoint Presentation Model Introduction PDF
Persuade your audience using this person making calculations on financial report ppt powerpoint presentation model introduction pdf. This PPT design covers three stages, thus making it a great tool to use. It also caters to a variety of topics including person making calculations on financial report. Download this PPT design now to present a convincing pitch that not only emphasizes the topic but also showcases your presentation skills.

Expenses Report Analysis With Calculator And Pen Ppt PowerPoint Presentation Show Designs Download PDF
Persuade your audience using this expenses report analysis with calculator and pen ppt powerpoint presentation show designs download pdf. This PPT design covers three stages, thus making it a great tool to use. It also caters to a variety of topics including expenses report analysis with calculator and pen. Download this PPT design now to present a convincing pitch that not only emphasizes the topic but also showcases your presentation skills.

Statistical Data Supporting Data Driven Marketing Objectives Summary PDF
This slide represents the results of the survey conducted to gain insights related to the key objectives of implementing data driven marketing strategy in enterprise. It includes goals such as new customer acquisition etc. Are you in need of a template that can accommodate all of your creative concepts This one is crafted professionally and can be altered to fit any style. Use it with Google Slides or PowerPoint. Include striking photographs, symbols, depictions, and other visuals. Fill, move around, or remove text boxes as desired. Test out color palettes and font mixtures. Edit and save your work, or work with colleagues. Download Statistical Data Supporting Data Driven Marketing Objectives Summary PDF and observe how to make your presentation outstanding. Give an impeccable presentation to your group and make your presentation unforgettable.
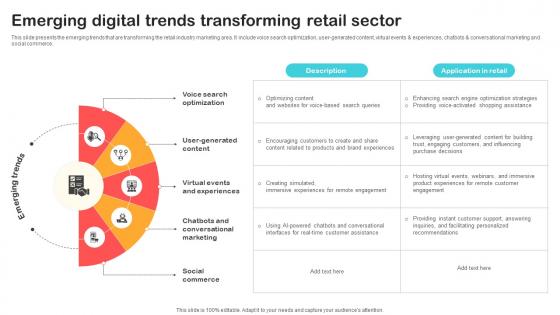
Emerging Digital Trends Transforming Retail Sector Optimizing Retail Operations With Digital DT SS V
This slide presents the emerging trends that are transforming the retail industry marketing area. It include voice search optimization, user-generated content, virtual events and experiences, chatbots and conversational marketing and social commerce.Are you searching for a Emerging Digital Trends Transforming Retail Sector Optimizing Retail Operations With Digital DT SS V that is uncluttered, straightforward, and original Its easy to edit, and you can change the colors to suit your personal or business branding. For a presentation that expresses how much effort you have put in, this template is ideal With all of its features, including tables, diagrams, statistics, and lists, its perfect for a business plan presentation. Make your ideas more appealing with these professional slides. Download Emerging Digital Trends Transforming Retail Sector Optimizing Retail Operations With Digital DT SS V from Slidegeeks today.

Construct Project Feasibility Analysis Report Ppt PowerPoint Presentation Complete Deck With Slides
This Construct Project Feasibility Analysis Report Ppt PowerPoint Presentation Complete Deck With Slides is designed to help you retain your audiences attention. This content ready PowerPoint Template enables you to take your audience on a journey and share information in a way that is easier to recall. It helps you highlight the crucial parts of your work so that the audience does not get saddled with information download. This forty nine slide PPT Deck comes prepared with the graphs and charts you could need to showcase your information through visuals. You only need to enter your own data in them. Download this editable PowerPoint Theme and walk into that meeting with confidence.

Data Warehousing IT Checklist To Implement Data Warehouse In Company Ppt Inspiration Example PDF
This slide describes the checklist to implement a data warehouse in the company, including strategies to assess data, organization of data, tools to manage data, and so on. This is a data warehousing it checklist to implement data warehouse in company ppt inspiration example pdf template with various stages. Focus and dispense information on one stages using this creative set, that comes with editable features. It contains large content boxes to add your information on topics like strategy, operational systems, integrity. You can also showcase facts, figures, and other relevant content using this PPT layout. Grab it now.
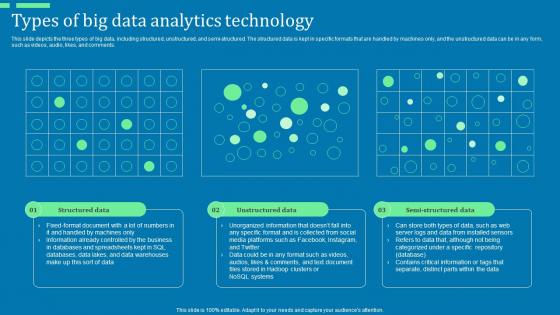
Types Of Big Data Analytics Technology Advanced Tools For Hyperautomation Ppt File Graphics Pictures Pdf
This slide depicts the three types of big data, including structured, unstructured, and semi-structured. The structured data is kept in specific formats that are handled by machines only, and the unstructured data can be in any form, such as videos, audio, likes, and comments. Make sure to capture your audiences attention in your business displays with our gratis customizable Types Of Big Data Analytics Technology Advanced Tools For Hyperautomation Ppt File Graphics Pictures Pdf. These are great for business strategies, office conferences, capital raising or task suggestions. If you desire to acquire more customers for your tech business and ensure they stay satisfied, create your own sales presentation with these plain slides.

Value Stream Data Analytics Process Business Analysis Modification Toolkit Professional PDF
This slide shows the step by step approach of data analytics project focusing on data gathering, consolidation and data analysis to build business insights for effective decision making. This is a Value Stream Data Analytics Process Business Analysis Modification Toolkit Professional PDF template with various stages. Focus and dispense information on six stages using this creative set, that comes with editable features. It contains large content boxes to add your information on topics like Data Gathering, Data Cleaning, Data Consolidation. You can also showcase facts, figures, and other relevant content using this PPT layout. Grab it now.
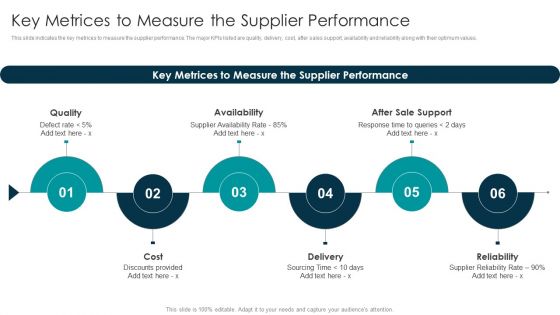
Tactical Approach For Vendor Reskilling Key Metrices To Measure The Supplier Performance Designs PDF
This slide indicates the key metrices to measure the supplier performance. The major KPIs listed are quality, delivery, cost, after sales support, availability and reliability along with their optimum values. Slidegeeks is here to make your presentations a breeze with Tactical Approach For Vendor Reskilling Key Metrices To Measure The Supplier Performance Designs PDF With our easy to use and customizable templates, you can focus on delivering your ideas rather than worrying about formatting. With a variety of designs to choose from, you are sure to find one that suits your needs. And with animations and unique photos, illustrations, and fonts, you can make your presentation pop. So whether you are giving a sales pitch or presenting to the board, make sure to check out Slidegeeks first.
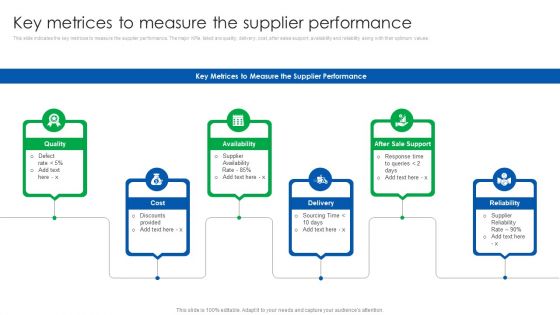
Vendor Relationship Management Strategic Plan Key Metrices To Measure The Supplier Performance Formats PDF
This slide indicates the key metrices to measure the supplier performance. The major KPIs listed are quality, delivery, cost, after sales support, availability and reliability along with their optimum values. Slidegeeks is here to make your presentations a breeze with Vendor Relationship Management Strategic Plan Key Metrices To Measure The Supplier Performance Formats PDF With our easy to use and customizable templates, you can focus on delivering your ideas rather than worrying about formatting. With a variety of designs to choose from, you are sure to find one that suits your needs. And with animations and unique photos, illustrations, and fonts, you can make your presentation pop. So whether you are giving a sales pitch or presenting to the board, make sure to check out Slidegeeks first.
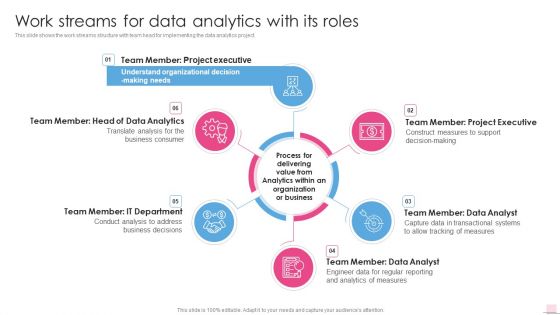
Work Streams For Data Analytics With Its Roles Business Analysis Modification Toolkit Topics PDF
Presenting Work Streams For Data Analytics With Its Roles Business Analysis Modification Toolkit Topics PDF to provide visual cues and insights. Share and navigate important information on six stages that need your due attention. This template can be used to pitch topics like Project Executive, Data Analytics, Organization Business. In addtion, this PPT design contains high resolution images, graphics, etc, that are easily editable and available for immediate download.

Sales Kpi Performance Summary Ppt PowerPoint Presentation Infographic Template Elements
This is a sales kpi performance summary ppt powerpoint presentation infographic template elements. This is a seven stage process. The stages in this process are revenue comparison, quantity comparison, product sales mix, regional sales mix, budget.
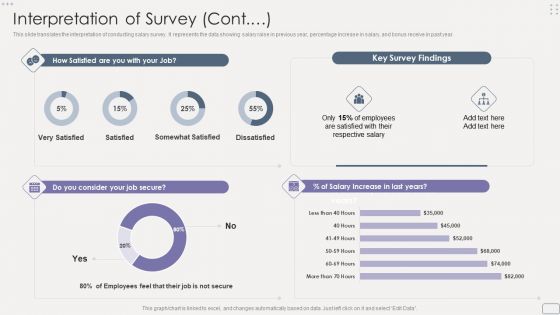
Income Assessment Report Interpretation Of Survey Contd Portrait PDF
This slide translates the interpretation of conducting salary survey. It represents the data showing salary raise in previous year, percentage increase in salary, and bonus receive in past year.Deliver and pitch your topic in the best possible manner with this Income Assessment Report Interpretation Of Survey Contd Portrait PDF. Use them to share invaluable insights on Increment Criteria, Projected Increment, Middle Management and impress your audience. This template can be altered and modified as per your expectations. So, grab it now.
Business Statistics Assessment Graph Icon Ppt PowerPoint Presentation Slides Background Images PDF
Presenting business statistics assessment graph icon ppt powerpoint presentation slides background images pdf to dispense important information. This template comprises three stages. It also presents valuable insights into the topics including business statistics assessment graph icon. This is a completely customizable PowerPoint theme that can be put to use immediately. So, download it and address the topic impactfully.
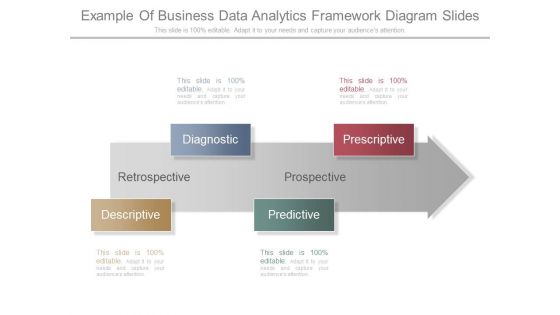
Example Of Business Data Analytics Framework Diagram Slides
This is a example of business data analytics framework diagram slides. This is a four stage process. The stages in this process are diagnostic, descriptive, predictive, prescriptive, retrospective, prospective.
Performance Statistics Chart With Magnifying Glass Vector Icon Ppt Show Shapes PDF
Presenting performance statistics chart with magnifying glass vector icon ppt show shapes pdf to provide visual cues and insights. Share and navigate important information on four stages that need your due attention. This template can be used to pitch topics like performance statistics chart with magnifying glass vector icon. In addition, this PPT design contains high-resolution images, graphics, etc, that are easily editable and available for immediate download.
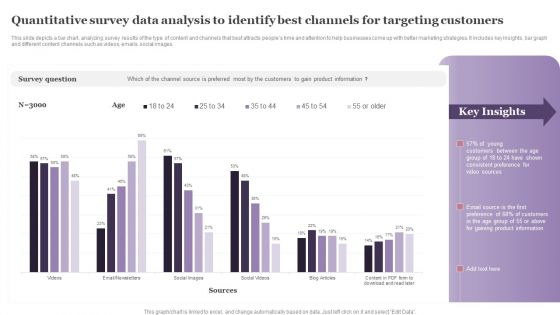
Quantitative Survey Data Analysis To Identify Best Channels For Targeting Customers Formats PDF
This slide depicts a bar chart, analyzing survey results of the type of content and channels that best attracts peoples time and attention to help businesses come up with better marketing strategies. It includes key insights, bar graph and different content channels such as videos, emails, social images. Pitch your topic with ease and precision using this Quantitative Survey Data Analysis To Identify Best Channels For Targeting Customers Formats PDF. This layout presents information on Survey Question, Young Customers, Consistent Preference. It is also available for immediate download and adjustment. So, changes can be made in the color, design, graphics or any other component to create a unique layout.
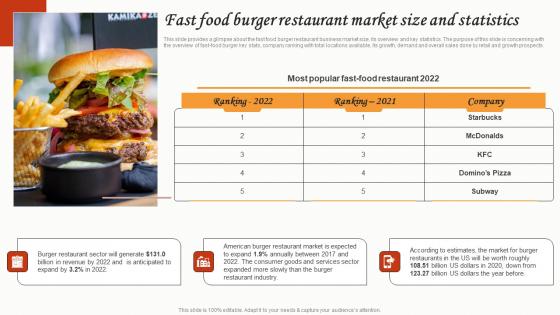
Fast Food Burger Restaurant Market Size And Statistics Small Restaurant Business Slides Pdf
This slide provides a glimpse about the fast food burger restaurant business market size, its overview and key statistics. The purpose of this slide is concerning with the overview of fast-food burger key stats, company ranking with total locations available, its growth, demand and overall sales done by retail and growth prospects. The Fast Food Burger Restaurant Market Size And Statistics Small Restaurant Business Slides Pdf is a compilation of the most recent design trends as a series of slides. It is suitable for any subject or industry presentation, containing attractive visuals and photo spots for businesses to clearly express their messages. This template contains a variety of slides for the user to input data, such as structures to contrast two elements, bullet points, and slides for written information. Slidegeeks is prepared to create an impression.
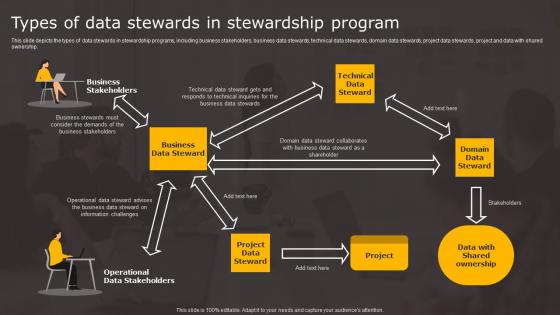
Data Stewardship In Business Processes Types Of Data Stewards Stewardship Professional Pdf
This slide depicts the types of data stewards in stewardship programs, including business stakeholders, business data stewards, technical data stewards, domain data stewards, project data stewards, project and data with shared ownership. Welcome to our selection of the Data Stewardship In Business Processes Types Of Data Stewards Stewardship Professional Pdf. These are designed to help you showcase your creativity and bring your sphere to life. Planning and Innovation are essential for any business that is just starting out. This collection contains the designs that you need for your everyday presentations. All of our PowerPoints are 100 percent editable, so you can customize them to suit your needs. This multi purpose template can be used in various situations. Grab these presentation templates today
Steps Involved In Search Engine Optimization Process Digital Marketing Strategy Deployment Icons PDF
This slide shows the search engine optimization process such as consult, devise strategies, keyword research, implement tactics, on-site optimization, monitor ranking and site, etc.Are you searching for a Steps Involved In Search Engine Optimization Process Digital Marketing Strategy Deployment Icons PDF that is uncluttered, straightforward, and original Its easy to edit, and you can change the colors to suit your personal or business branding. For a presentation that expresses how much effort you ve put in, this template is ideal With all of its features, including tables, diagrams, statistics, and lists, its perfect for a business plan presentation. Make your ideas more appealing with these professional slides. Download Steps Involved In Search Engine Optimization Process Digital Marketing Strategy Deployment Icons PDF from Slidegeeks today.
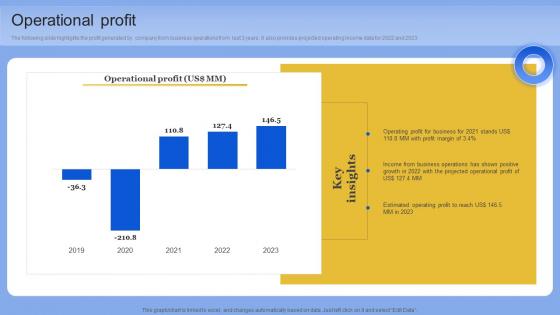
Operational Profit Data Analytics Company Outline Pictures PDF
The following slide highlights the profit generated by company from business operations from last 3 years. It also provides projected operating income data for 2022 and 2023. Slidegeeks has constructed Operational Profit Data Analytics Company Outline Pictures PDF after conducting extensive research and examination. These presentation templates are constantly being generated and modified based on user preferences and critiques from editors. Here, you will find the most attractive templates for a range of purposes while taking into account ratings and remarks from users regarding the content. This is an excellent jumping-off point to explore our content and will give new users an insight into our top-notch PowerPoint Templates.

Statistical Data Analysis In Marketing PowerPoint Templates Ppt Backgrounds For Slides 0313
We present our Statistical Data Analysis In Marketing PowerPoint Templates PPT Backgrounds For Slides 0313.Download our Marketing PowerPoint Templates because Our PowerPoint Templates and Slides will let you Clearly mark the path for others to follow. Download our Success PowerPoint Templates because You have gained great respect for your brilliant ideas. Use our PowerPoint Templates and Slides to strengthen and enhance your reputation. Use our Finance PowerPoint Templates because Our PowerPoint Templates and Slides has conjured up a web of all you need with the help of our great team. Use them to string together your glistening ideas. Download our Business PowerPoint Templates because Our PowerPoint Templates and Slides help you pinpoint your timelines. Highlight the reasons for your deadlines with their use. Use our Shapes PowerPoint Templates because Our PowerPoint Templates and Slides ensures Effective communication. They help you put across your views with precision and clarity.Use these PowerPoint slides for presentations relating to The diagramme which shows the statistical data, marketing, success, business, shapes, finance. The prominent colors used in the PowerPoint template are Green, Red, Yellow.

 Home
Home