Forecast Dashboard

Project Conclusion Report Performance Analysis Ppt PowerPoint Presentation Slides Design Templates
This is a project conclusion report performance analysis ppt powerpoint presentation slides design templates. This is a three stage process. The stages in this process are business, marketing, table, compare, analysis.
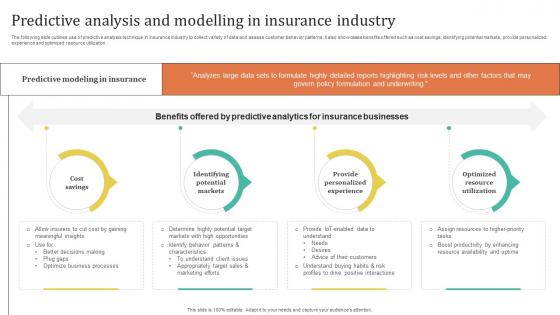
Improving Customer Satisfaction Predictive Analysis And Modelling In Insurance Industry
The following slide outlines use of predictive analysis technique in insurance industry to collect variety of data and assess customer behavior patterns. It also showcases benefits offered such as cost savings, identifying potential markets, provide personalized experience and optimized resource utilization. Slidegeeks is here to make your presentations a breeze with Improving Customer Satisfaction Predictive Analysis And Modelling In Insurance Industry With our easy-to-use and customizable templates, you can focus on delivering your ideas rather than worrying about formatting. With a variety of designs to choose from, you are sure to find one that suits your needs. And with animations and unique photos, illustrations, and fonts, you can make your presentation pop. So whether you are giving a sales pitch or presenting to the board, make sure to check out Slidegeeks first

Overview Of Different Types Of Data Analytics For Informed Decision Ppt PowerPoint
This slide outlines the various types of statistical analysis. These are mechanistic analysis, descriptive statistical analysis, inferential statistical analysis, predictive statistical analysis, prescriptive statistical analysis, exploratory data analysis, etc. The Overview Of Different Types Of Data Analytics For Informed Decision Ppt PowerPoint is a compilation of the most recent design trends as a series of slides. It is suitable for any subject or industry presentation, containing attractive visuals and photo spots for businesses to clearly express their messages. This template contains a variety of slides for the user to input data, such as structures to contrast two elements, bullet points, and slides for written information. Slidegeeks is prepared to create an impression.

Donut Chart For Business Development 4 Stages Plan Excel PowerPoint Templates
We present our donut chart for business development 4 stages plan excel PowerPoint templates.Download our Finance PowerPoint Templates because Our PowerPoint Templates and Slides are created by a hardworking bunch of busybees. Always flitting around with solutions gauranteed to please. Present our Marketing PowerPoint Templates because Our PowerPoint Templates and Slides team portray an attitude of elegance. Personify this quality by using them regularly. Download and present our Shapes PowerPoint Templates because Our PowerPoint Templates and Slides are innately eco-friendly. Their high recall value negate the need for paper handouts. Download our Business PowerPoint Templates because It will mark the footprints of your journey. Illustrate how they will lead you to your desired destination. Download and present our Process and Flows PowerPoint Templates because Our PowerPoint Templates and Slides will provide you a launch platform. Give a lift off to your ideas and send them into orbit.Use these PowerPoint slides for presentations relating to chart, business, data, donut, market, sales, document, economy, display, bar, corporate, income, concept, success, presentation, symbol, diagram, percentage, graphic, finance, stock, clean, analysis, report, marketing, accounting, management, graph, forecast, design, growth, competition, progress, profit, information, background, trade, investment, statistic, financial, infographics, 3d. The prominent colors used in the PowerPoint template are Yellow, Green, Blue.
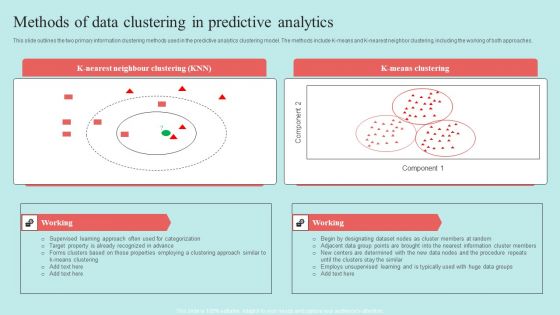
Predictive Data Model Methods Of Data Clustering In Predictive Analytics Rules PDF
Financial Analysis Calculator With Dollar Symbol Vector Icon Ppt PowerPoint Presentation File Example Topics PDF
Presenting this set of slides with name financial analysis calculator with dollar symbol vector icon ppt powerpoint presentation file example topics pdf. This is a three stage process. The stages in this process are financial analysis calculator with dollar symbol vector icon. This is a completely editable PowerPoint presentation and is available for immediate download. Download now and impress your audience.

Checklist For Developing Effective Data Modeling Approaches For Modern Analytics Rules Pdf
This slide explains the checklist for making well designed data model, including the key approaches such as data type mismatch, visualize, necessary data, verify each stage, and customize. Get a simple yet stunning designed Checklist For Developing Effective Data Modeling Approaches For Modern Analytics Rules Pdf. It is the best one to establish the tone in your meetings. It is an excellent way to make your presentations highly effective. So, download this PPT today from Slidegeeks and see the positive impacts. Our easy to edit Checklist For Developing Effective Data Modeling Approaches For Modern Analytics Rules Pdf can be your go to option for all upcoming conferences and meetings. So, what are you waiting for Grab this template today.
Quantitative Data Analysis Icon For Predictive Modelling Ppt Ideas Images PDF
Presenting Quantitative Data Analysis Icon For Predictive Modelling Ppt Ideas Images PDF to dispense important information. This template comprises one stages. It also presents valuable insights into the topics including Quantitative Data, Analysis Icon, Predictive Modelling. This is a completely customizable PowerPoint theme that can be put to use immediately. So, download it and address the topic impactfully.
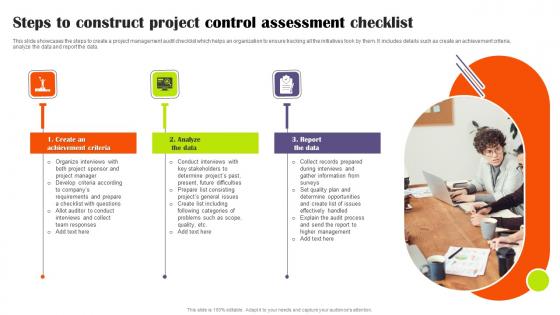
Steps To Construct Project Control Assessment Checklist Designs Pdf
This slide showcases the steps to create a project management audit checklist which helps an organization to ensure tracking all the initiatives took by them. It includes details such as create an achievement criteria, analyze the data and report the data. Pitch your topic with ease and precision using this Steps To Construct Project Control Assessment Checklist Designs Pdf This layout presents information on Achievement Criteria, Analyze The Data, Report The Data It is also available for immediate download and adjustment. So, changes can be made in the color, design, graphics or any other component to create a unique layout.

Predictive Data Model Working Of Predictive Analytics Models Pictures PDF
This slide depicts the working of predictive analytics models that operates iteratively. The main phases in working include business understanding, data understanding, data preparation, modeling, evaluation, and deployment. Formulating a presentation can take up a lot of effort and time, so the content and message should always be the primary focus. The visuals of the PowerPoint can enhance the presenters message, so our Predictive Data Model Working Of Predictive Analytics Models Pictures PDF was created to help save time. Instead of worrying about the design, the presenter can concentrate on the message while our designers work on creating the ideal templates for whatever situation is needed. Slidegeeks has experts for everything from amazing designs to valuable content, we have put everything into Predictive Data Model Working Of Predictive Analytics Models Pictures PDF
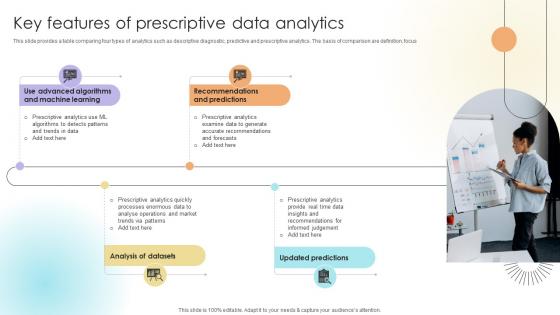
Key Features Of Prescriptive Data Analytics Data Analytics SS V
This slide provides a table comparing four types of analytics such as descriptive diagnostic, predictive and prescriptive analytics. The basis of comparison are definition, focus.Present like a pro with Key Features Of Prescriptive Data Analytics Data Analytics SS V. Create beautiful presentations together with your team, using our easy-to-use presentation slides. Share your ideas in real-time and make changes on the fly by downloading our templates. So whether you are in the office, on the go, or in a remote location, you can stay in sync with your team and present your ideas with confidence. With Slidegeeks presentation got a whole lot easier. Grab these presentations today.
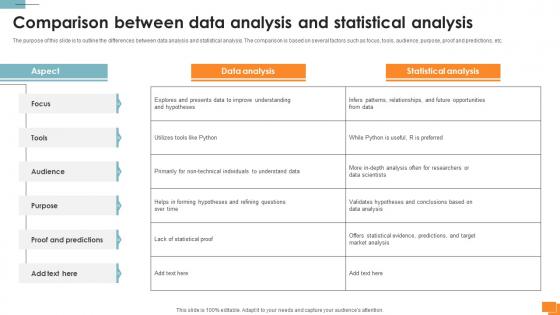
Statistical Tools For Evidence Comparison Between Data Analysis And Statistical Analysis
The purpose of this slide is to outline the differences between data analysis and statistical analysis. The comparison is based on several factors such as focus, tools, audience, purpose, proof and predictions, etc. Find highly impressive Statistical Tools For Evidence Comparison Between Data Analysis And Statistical Analysis on Slidegeeks to deliver a meaningful presentation. You can save an ample amount of time using these presentation templates. No need to worry to prepare everything from scratch because Slidegeeks experts have already done a huge research and work for you. You need to download Statistical Tools For Evidence Comparison Between Data Analysis And Statistical Analysis for your upcoming presentation. All the presentation templates are 100 percent editable and you can change the color and personalize the content accordingly. Download now
Icon For Target Market Assessment Survey Diagrams PDF
Persuade your audience using this Icon For Target Market Assessment Survey Diagrams PDF. This PPT design covers four stages, thus making it a great tool to use. It also caters to a variety of topics including Icon For Target Market, Assessment Survey. Download this PPT design now to present a convincing pitch that not only emphasizes the topic but also showcases your presentation skills.

Utilize Heatmaps To Predict Consumer Behavior DT SS V
This slide presents a strategy for utilizing heatmaps to capture and analyse customer data to increase sales within retail store. It include overview, features, and strategies such as store performance analysis, targeted marketing campaigns, shelf placement optimization and supply chain optimization. Present like a pro with Utilize Heatmaps To Predict Consumer Behavior DT SS V. Create beautiful presentations together with your team, using our easy-to-use presentation slides. Share your ideas in real-time and make changes on the fly by downloading our templates. So whether you are in the office, on the go, or in a remote location, you can stay in sync with your team and present your ideas with confidence. With Slidegeeks presentation got a whole lot easier. Grab these presentations today.
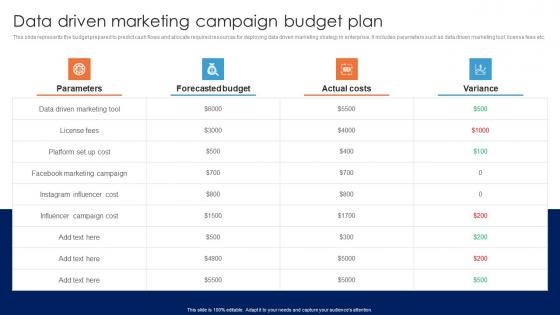
Data Driven Marketing Campaign Budget Plan Guide For Data Driven Advertising Introduction Pdf
This slide represents the budget prepared to predict cash flows and allocate required resources for deploying data driven marketing strategy in enterprise. It includes parameters such as data driven marketing tool, license fees etc.The best PPT templates are a great way to save time, energy, and resources. Slidegeeks have 100Precent editable powerpoint slides making them incredibly versatile. With these quality presentation templates, you can create a captivating and memorable presentation by combining visually appealing slides and effectively communicating your message. Download Data Driven Marketing Campaign Budget Plan Guide For Data Driven Advertising Introduction Pdf from Slidegeeks and deliver a wonderful presentation.

Key Metrics To Measure Current Evaluation And Deployment Of Enhanced Professional Pdf
This slide represents the key performance indicators to track and monitor the performance of ecommerce website to draw effective strategies to tackle the problems. It includes key metrics for ecommerce website performance measurement such as average order value and shopping cart abandonment rate. Are you searching for a Key Metrics To Measure Current Evaluation And Deployment Of Enhanced Professional Pdf that is uncluttered, straightforward, and original It is easy to edit, and you can change the colors to suit your personal or business branding. For a presentation that expresses how much effort you have put in, this template is ideal With all of its features, including tables, diagrams, statistics, and lists, it is perfect for a business plan presentation. Make your ideas more appealing with these professional slides. Download Key Metrics To Measure Current Evaluation And Deployment Of Enhanced Professional Pdf from Slidegeeks today.
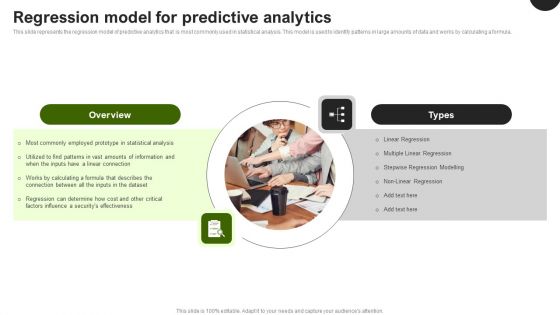
Predictive Analytics In The Age Of Big Data Regression Model For Predictive Analytics Elements PDF
This slide represents the regression model of predictive analytics that is most commonly used in statistical analysis. This model is used to identify patterns in large amounts of data and works by calculating a formula. Do you know about Slidesgeeks Predictive Analytics In The Age Of Big Data Regression Model For Predictive Analytics Elements PDF, These are perfect for delivering any kind od presentation. Using it, create PowerPoint presentations that communicate your ideas and engage audiences. Save time and effort by using our pre designed presentation templates that are perfect for a wide range of topic. Our vast selection of designs covers a range of styles, from creative to business, and are all highly customizable and easy to edit. Download as a PowerPoint template or use them as Google Slides themes.
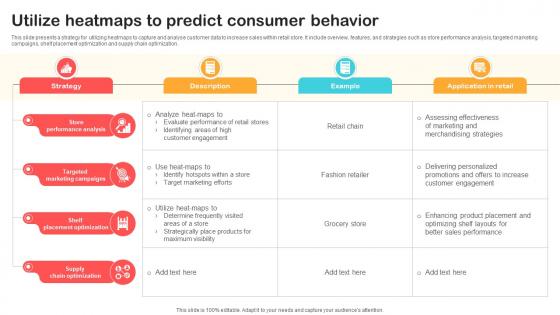
Utilize Heatmaps To Predict Consumer Behavior Optimizing Retail Operations With Digital DT SS V
This slide presents a strategy for utilizing heatmaps to capture and analyse customer data to increase sales within retail store. It include overview, features, and strategies such as store performance analysis, targeted marketing campaigns, shelf placement optimization and supply chain optimization. Present like a pro with Utilize Heatmaps To Predict Consumer Behavior Optimizing Retail Operations With Digital DT SS V. Create beautiful presentations together with your team, using our easy-to-use presentation slides. Share your ideas in real-time and make changes on the fly by downloading our templates. So whether you are in the office, on the go, or in a remote location, you can stay in sync with your team and present your ideas with confidence. With Slidegeeks presentation got a whole lot easier. Grab these presentations today.
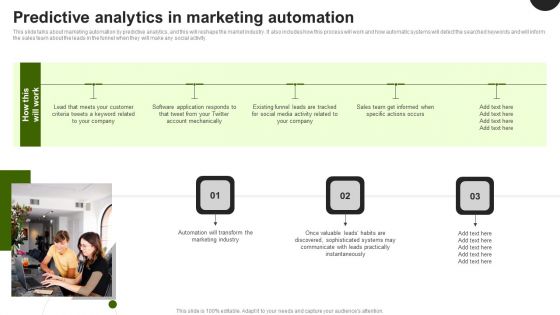
Predictive Analytics In The Age Of Big Data Predictive Analytics In Marketing Automation Ideas PDF
This slide talks about marketing automation by predictive analytics, and this will reshape the market industry. It also includes how this process will work and how automatic systems will detect the searched keywords and will inform the sales team about the leads in the funnel when they will make any social activity. The Predictive Analytics In The Age Of Big Data Predictive Analytics In Marketing Automation Ideas PDF is a compilation of the most recent design trends as a series of slides. It is suitable for any subject or industry presentation, containing attractive visuals and photo spots for businesses to clearly express their messages. This template contains a variety of slides for the user to input data, such as structures to contrast two elements, bullet points, and slides for written information. Slidegeeks is prepared to create an impression.

Data Stewardship By Project Data Stewardship In Business Processes Template Pdf
This slide talks about the data steward by project model that caters to demonstrating the value of data stewardship and provides entry to a more formal approach, a simple and quick process to promote data stewardship, a temporary solution, and so on. Are you in need of a template that can accommodate all of your creative concepts This one is crafted professionally and can be altered to fit any style. Use it with Google Slides or PowerPoint. Include striking photographs, symbols, depictions, and other visuals. Fill, move around, or remove text boxes as desired. Test out color palettes and font mixtures. Edit and save your work, or work with colleagues. Download Data Stewardship By Project Data Stewardship In Business Processes Template Pdf and observe how to make your presentation outstanding. Give an impeccable presentation to your group and make your presentation unforgettable.
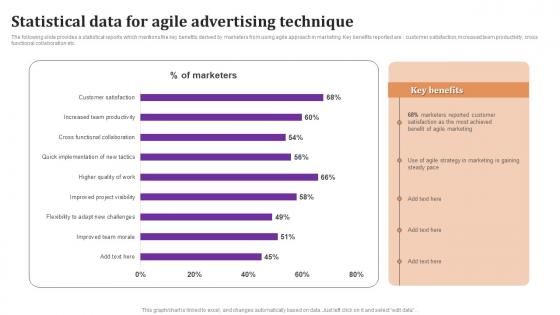
Statistical Data For Agile Advertising Technique Diagrams Pdf
The following slide provides a statistical reports which mentions the key benefits derived by marketers from using agile approach in marketing. Key benefits reported are customer satisfaction, increased team productivity, cross functional collaboration etc. Pitch your topic with ease and precision using this Statistical Data For Agile Advertising Technique Diagrams Pdf This layout presents information on Statistical Data, Agile Advertising, Technique It is also available for immediate download and adjustment. So, changes can be made in the color, design, graphics or any other component to create a unique layout.
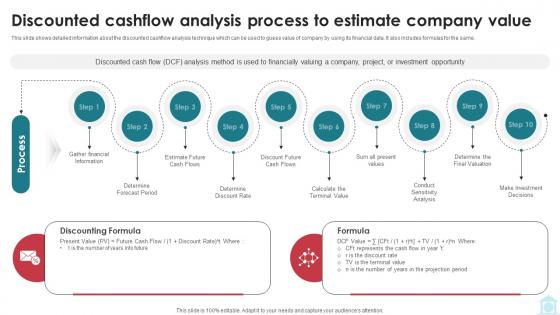
Discounted Cashflow Analysis Process To Estimate Mastering Investment Banking Fin SS V
This slide shows detailed information about the discounted cashflow analysis technique which can be used to guess value of company by using its financial data. It also includes formulas for the same. Make sure to capture your audiences attention in your business displays with our gratis customizable Discounted Cashflow Analysis Process To Estimate Mastering Investment Banking Fin SS V These are great for business strategies, office conferences, capital raising or task suggestions. If you desire to acquire more customers for your tech business and ensure they stay satisfied, create your own sales presentation with these plain slides.
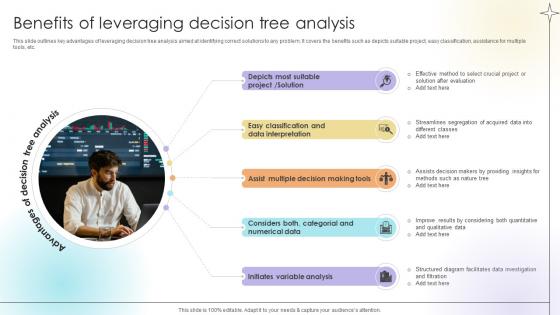
Benefits Of Leveraging Decision Tree Analysis Data Analytics SS V
This slide outlines key advantages of leveraging decision tree analysis aimed at identifying correct solutions to any problem. It covers the benefits such as depicts suitable project, easy classification, assistance for multiple tools, etc.Coming up with a presentation necessitates that the majority of the effort goes into the content and the message you intend to convey. The visuals of a PowerPoint presentation can only be effective if it supplements and supports the story that is being told. Keeping this in mind our experts created Benefits Of Leveraging Decision Tree Analysis Data Analytics SS V to reduce the time that goes into designing the presentation. This way, you can concentrate on the message while our designers take care of providing you with the right template for the situation.
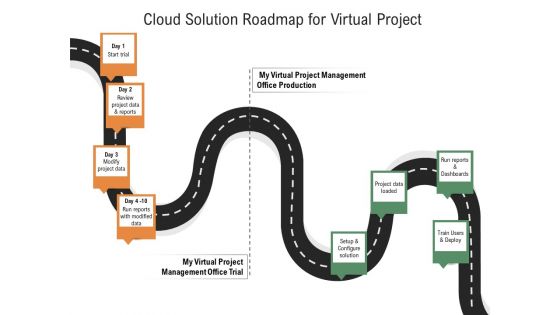
Cloud Solution Roadmap For Virtual Project Ppt PowerPoint Presentation Outline Infographic Template PDF
Persuade your audience using this cloud solution roadmap for virtual project ppt powerpoint presentation outline infographic template pdf. This PPT design covers four stages, thus making it a great tool to use. It also caters to a variety of topics including run reports and dashboards, project data loaded, setup and configure solution, train users and deploy, modify project data, review project, data and reports, start trial, run reports with modified data. Download this PPT design now to present a convincing pitch that not only emphasizes the topic but also showcases your presentation skills.

Data Collection Methods For Prescriptive Analytics Data Analytics SS V
This slide outlines various data collection methods aimed at helping businesses optimize data driven decision making. It covers methods such as observations, interviews, transactional tracking, social media monitoring, surveys, forms and online tracking.Slidegeeks has constructed Data Collection Methods For Prescriptive Analytics Data Analytics SS V after conducting extensive research and examination. These presentation templates are constantly being generated and modified based on user preferences and critiques from editors. Here, you will find the most attractive templates for a range of purposes while taking into account ratings and remarks from users regarding the content. This is an excellent jumping-off point to explore our content and will give new users an insight into our top-notch PowerPoint Templates.
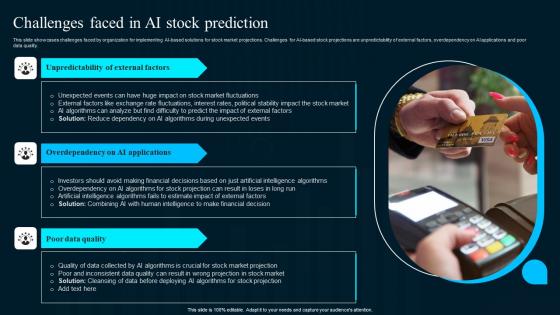
Challenges Faced In Ai Stock Prediction Artificial Intelligence Applications Ideas Pdf
This slide showcases challenges faced by organization for implementing AI-based solutions for stock market projections. Challenges for AI-based stock projections are unpredictability of external factors, overdependency on AI applications and poor data quality.Boost your pitch with our creative Challenges Faced In Ai Stock Prediction Artificial Intelligence Applications Ideas Pdf. Deliver an awe-inspiring pitch that will mesmerize everyone. Using these presentation templates you will surely catch everyones attention. You can browse the ppts collection on our website. We have researchers who are experts at creating the right content for the templates. So you do not have to invest time in any additional work. Just grab the template now and use them.
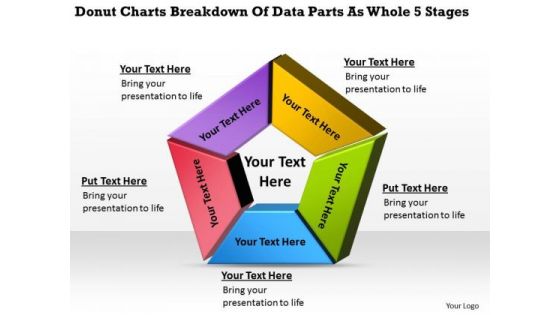
Breakdown Of Data Parts As Whole 5 Stages Business Plan Model PowerPoint Templates
We present our breakdown of data parts as whole 5 stages business plan model PowerPoint templates.Use our Competition PowerPoint Templates because Our PowerPoint Templates and Slides offer you the widest possible range of options. Download our Finance PowerPoint Templates because Our PowerPoint Templates and Slides will help you be quick off the draw. Just enter your specific text and see your points hit home. Present our Pentagon PowerPoint Templates because Our PowerPoint Templates and Slides will help you be quick off the draw. Just enter your specific text and see your points hit home. Present our Business PowerPoint Templates because You can Stir your ideas in the cauldron of our PowerPoint Templates and Slides. Cast a magic spell on your audience. Use our Shapes PowerPoint Templates because Our PowerPoint Templates and Slides will bullet point your ideas. See them fall into place one by one.Use these PowerPoint slides for presentations relating to Chart, business, data, donut, market, sales, document, display, bar, corporate, income, concept, success, presentation, symbol, diagram, graphic, finance, stock, clean, marketing, accounting, management, graph, forecast, design, growth, competition, progress, profit, information, investment, financial, infographics. The prominent colors used in the PowerPoint template are Purple, Green, Blue.

Data Into Constituents 6 Stages How Prepare Business Plan PowerPoint Templates
We present our data into constituents 6 stages how prepare business plan PowerPoint templates.Use our Competition PowerPoint Templates because Our PowerPoint Templates and Slides will let you Hit the right notes. Watch your audience start singing to your tune. Download our Finance PowerPoint Templates because Our PowerPoint Templates and Slides are effectively colour coded to prioritise your plans They automatically highlight the sequence of events you desire. Use our Pentagon PowerPoint Templates because You have the co-ordinates for your destination of success. Let our PowerPoint Templates and Slides map out your journey. Use our Business PowerPoint Templates because These PowerPoint Templates and Slides will give the updraft to your ideas. See them soar to great heights with ease. Download and present our Shapes PowerPoint Templates because You have gained great respect for your brilliant ideas. Use our PowerPoint Templates and Slides to strengthen and enhance your reputation.Use these PowerPoint slides for presentations relating to Chart, business, data, donut, market, sales, document, display, bar, corporate, income, concept, success, presentation, symbol, diagram, graphic, finance, stock, clean, marketing, accounting, management, graph, forecast, design, growth, competition, progress, profit, information, investment, financial, infographics. The prominent colors used in the PowerPoint template are Blue, Red, Green.
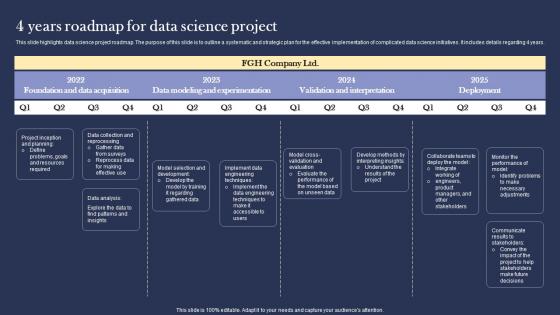
4 Years Roadmap For Data Science Project Structure pdf
This slide highlights data science project roadmap. The purpose of this slide is to outline a systematic and strategic plan for the effective implementation of complicated data science initiatives. It includes details regarding 4 years. Showcasing this set of slides titled 4 Years Roadmap For Data Science Project Structure pdf. The topics addressed in these templates are Project Inception, Data Collection, Data Analysis. All the content presented in this PPT design is completely editable. Download it and make adjustments in color, background, font etc. as per your unique business setting.
Predictive Data Model Uses Of Predictive Analytics Underwriting Clipart PDF

Budget And Financial Snapshot Ppt PowerPoint Presentation Example
This is a budget and financial snapshot ppt powerpoint presentation example. This is a two stage process. The stages in this process are sales, operating income, net income.
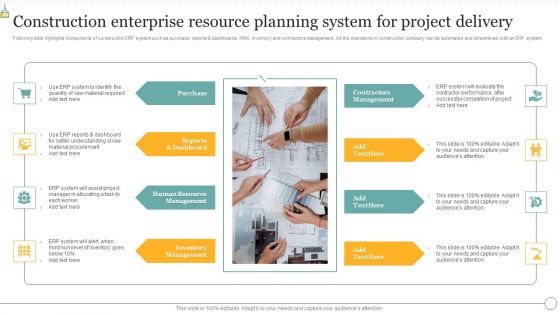
Construction Enterprise Resource Planning System For Project Delivery Template PDF
Following slide highlights components of construction ERP system such as purchase, reports and dashboards, HRM, inventory and contractors management. All the operations in construction company can be automated and streamlined with an ERP system. Persuade your audience using this Construction Enterprise Resource Planning System For Project Delivery Template PDF. This PPT design covers eight stages, thus making it a great tool to use. It also caters to a variety of topics including Purchase, Contractors Management, Inventory Management. Download this PPT design now to present a convincing pitch that not only emphasizes the topic but also showcases your presentation skills.
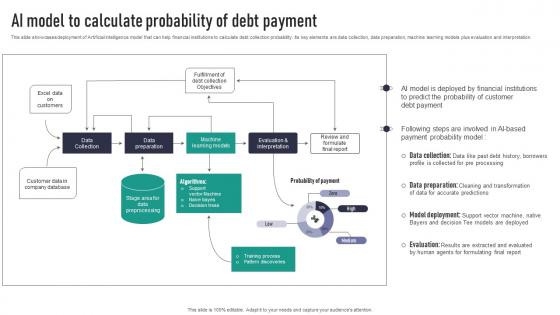
AI Model To Calculate Probability Of Debt Payment Rules Pdf
This slide showcases deployment of Artificial intelligence model that can help financial institutions to calculate debt collection probability. Its key elements are data collection, data preparation, machine learning models plus evaluation and interpretation. Crafting an eye-catching presentation has never been more straightforward. Let your presentation shine with this tasteful yet straightforward AI Model To Calculate Probability Of Debt Payment Rules Pdf template. It offers a minimalistic and classy look that is great for making a statement. The colors have been employed intelligently to add a bit of playfulness while still remaining professional. Construct the ideal AI Model To Calculate Probability Of Debt Payment Rules Pdf that effortlessly grabs the attention of your audience Begin now and be certain to wow your customers
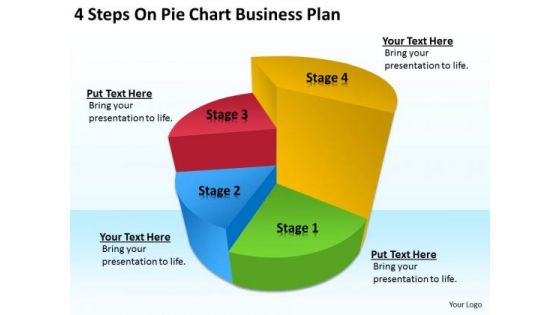
4 Steps On Pie Chart Business Plan Sample PowerPoint Templates
We present our 4 steps on pie chart business plan sample PowerPoint templates.Use our Flow Charts PowerPoint Templates because Your success is our commitment. Our PowerPoint Templates and Slides will ensure you reach your goal. Use our Process and Flows PowerPoint Templates because Our PowerPoint Templates and Slides will let you Hit the target. Go the full distance with ease and elan. Present our Marketing PowerPoint Templates because you can Set pulses racing with our PowerPoint Templates and Slides. They will raise the expectations of your team. Download our Success PowerPoint Templates because Our PowerPoint Templates and Slides help you meet the demand of the Market. Just browse and pick the slides that appeal to your intuitive senses. Download our Business PowerPoint Templates because Our PowerPoint Templates and Slides will let you Illuminate the road ahead to Pinpoint the important landmarks along the way.Use these PowerPoint slides for presentations relating to Chart, pie, bar, business, percent, forecasting, economy, piechart, white, achievement, future, sign, symbol, chartgraph, diagram, styles, finance, data, stock,report, marketing, analyzing, shape, graph, modern, economic, up, stair, money, solution, design, growth, colorful, progress, profit, inspiration,background, investment, successful, growthbusiness, prosperity, improvement, financial, concepts, structure, ideas. The prominent colors used in the PowerPoint template are Red, Yellow, Blue.
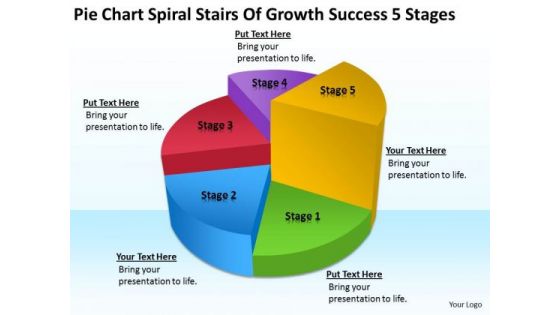
Spiral Stairs Of Growth Success 5 Stages Small Business Plans For Dummies PowerPoint Templates
We present our spiral stairs of growth success 5 stages small business plans for dummies PowerPoint templates.Download and present our Flow Charts PowerPoint Templates because Our PowerPoint Templates and Slides come in all colours, shades and hues. They help highlight every nuance of your views. Present our Process and Flows PowerPoint Templates because You are an avid believer in ethical practices. Highlight the benefits that accrue with our PowerPoint Templates and Slides. Present our Marketing PowerPoint Templates because Our PowerPoint Templates and Slides team portray an attitude of elegance. Personify this quality by using them regularly. Present our Success PowerPoint Templates because Our PowerPoint Templates and Slides will let you Leave a lasting impression to your audiences. They possess an inherent longstanding recall factor. Download and present our Business PowerPoint Templates because Our PowerPoint Templates and Slides will provide weight to your words. They will bring out the depth of your thought process.Use these PowerPoint slides for presentations relating to Chart, pie, bar, business, percent, forecasting, economy, piechart, white, achievement, future, sign, symbol, chartgraph, diagram, styles, finance, data, stock,report, marketing, analyzing, shape, graph, modern, economic, up, stair, money, solution, design, growth, colorful, progress, profit, inspiration,background, investment, successful, growthbusiness, prosperity, improvement, financial, concepts, structure, ideas. The prominent colors used in the PowerPoint template are Red, Yellow, Blue.

Colorful 6 Steps For Business Development Plan PowerPoint Templates
We present our colorful 6 steps for business development plan PowerPoint templates.Present our Flow Charts PowerPoint Templates because You aspire to touch the sky with glory. Let our PowerPoint Templates and Slides provide the fuel for your ascent. Download and present our Process and Flows PowerPoint Templates because Our PowerPoint Templates and Slides will help you be quick off the draw. Just enter your specific text and see your points hit home. Use our Marketing PowerPoint Templates because It is Aesthetically crafted by artistic young minds. Our PowerPoint Templates and Slides are designed to display your dexterity. Download our Success PowerPoint Templates because our PowerPoint Templates and Slides are the string of your bow. Fire of your ideas and conquer the podium. Use our Business PowerPoint Templates because You can Connect the dots. Fan expectations as the whole picture emerges.Use these PowerPoint slides for presentations relating to Chart, pie, bar, business, percent, forecasting, economy, piechart, white, achievement, future, sign, symbol, chartgraph, diagram, styles, finance, data, stock,report, marketing, analyzing, shape, graph, modern, economic, up, stair, money, solution, design, growth, colorful, progress, profit, inspiration,background, investment, successful, growthbusiness, prosperity, improvement, financial, concepts, structure, ideas. The prominent colors used in the PowerPoint template are Purple, Red, Blue.
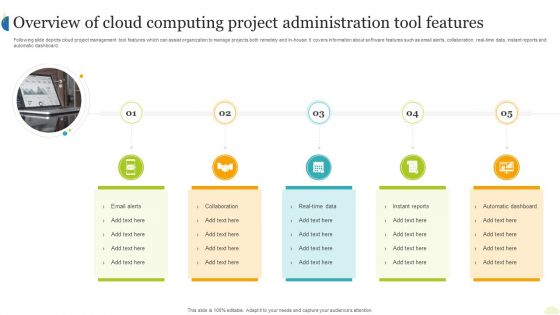
Overview Of Cloud Computing Project Administration Tool Features Ppt Portfolio Guidelines PDF
Following slide depicts cloud project management tool features which can assist organization to manage projects both remotely and in-house. It covers information about software features such as email alerts, collaboration, real-time data, instant reports and automatic dashboard. Persuade your audience using this Overview Of Cloud Computing Project Administration Tool Features Ppt Portfolio Guidelines PDF. This PPT design covers five stages, thus making it a great tool to use. It also caters to a variety of topics including Email Alerts, Collaboration, Real Time Data, Instant Reports. Download this PPT design now to present a convincing pitch that not only emphasizes the topic but also showcases your presentation skills.

Project Conclusion Report Deadline Milestones Ppt PowerPoint Presentation Pictures Layouts
This is a project conclusion report deadline milestones ppt powerpoint presentation pictures layouts. This is a five stage process. The stages in this process are project name, table, cost, data, management.

Project Conclusion Report Open Issues Ppt PowerPoint Presentation Background Designs
This is a project conclusion report open issues ppt powerpoint presentation background designs. This is a three stage process. The stages in this process are project name, table, cost, data, management.
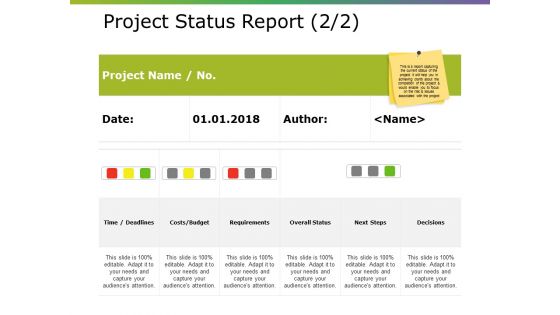
Project Status Report Template Ppt PowerPoint Presentation Layouts Background
This is a project status report template ppt powerpoint presentation layouts background. This is a four stage process. The stages in this process are project name, table, cost, data, management.
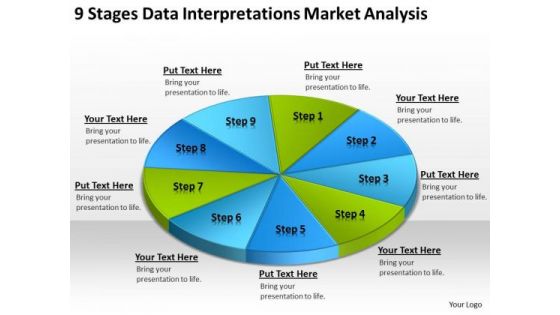
Data Interpretations Market Analysis Templates For Business Plan PowerPoint
We present our data interpretations market analysis templates for business plan PowerPoint.Present our Circle Charts PowerPoint Templates because Our PowerPoint Templates and Slides come in all colours, shades and hues. They help highlight every nuance of your views. Use our Business PowerPoint Templates because Our PowerPoint Templates and Slides will let you Hit the right notes. Watch your audience start singing to your tune. Download our Shapes PowerPoint Templates because Our PowerPoint Templates and Slides will fulfill your every need. Use them and effectively satisfy the desires of your audience. Present our Signs PowerPoint Templates because Our PowerPoint Templates and Slides will provide you a launch platform. Give a lift off to your ideas and send them into orbit. Use our Metaphors-Visual Concepts PowerPoint Templates because You have a driving passion to excel in your field. Our PowerPoint Templates and Slides will prove ideal vehicles for your ideas.Use these PowerPoint slides for presentations relating to business, chart, circle, circular, diagram, economy, finance, framework, graph, isolated, percentage, pie chart, results, scheme, statistics, stats, strategy, success. The prominent colors used in the PowerPoint template are Blue, Green, Blue light.
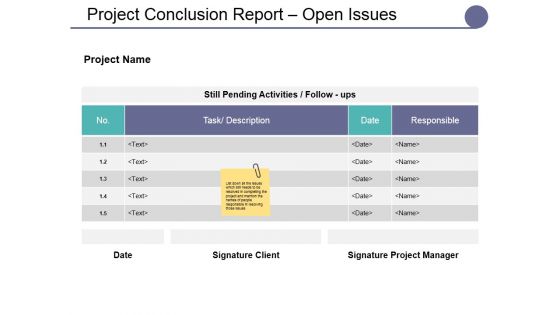
Project Conclusion Report Open Issues Ppt PowerPoint Presentation Styles Background Images
This is a project conclusion report open issues ppt powerpoint presentation styles background images. This is a four stage process. The stages in this process are business, marketing, table, compare, analysis.

Overview Of Diagnostic Data Analytics Technique Internet Of Things Analysis Introduction Pdf
This slide discusses an overview of diagnostic data analytics technique. The purpose of this slide is to provide an explanation of the diagnostic data analytics technique and its general approach for analyzing data to identify the root causes of problems or issues. Are you searching for a Overview Of Diagnostic Data Analytics Technique Internet Of Things Analysis Introduction Pdf that is uncluttered, straightforward, and original It is easy to edit, and you can change the colors to suit your personal or business branding. For a presentation that expresses how much effort you have put in, this template is ideal With all of its features, including tables, diagrams, statistics, and lists, it is perfect for a business plan presentation. Make your ideas more appealing with these professional slides. Download Overview Of Diagnostic Data Analytics Technique Internet Of Things Analysis Introduction Pdf from Slidegeeks today.

Project Estimating Team Building Ppt PowerPoint Presentation File Design Ideas
This is a project estimating team building ppt powerpoint presentation file design ideas. This is a five stage process. The stages in this process are project, estimating, team, building.

Diagram Free Business PowerPoint Templates Bar Graph Online Plan Slides
We present our diagram free business powerpoint templates bar graph online plan Slides.Download our Marketing PowerPoint Templates because Our PowerPoint Templates and Slides provide you with a vast range of viable options. Select the appropriate ones and just fill in your text. Download our Finance PowerPoint Templates because Our PowerPoint Templates and Slides team portray an attitude of elegance. Personify this quality by using them regularly. Use our Spheres PowerPoint Templates because Our PowerPoint Templates and Slides are Clear and concise. Use them and dispel any doubts your team may have. Download and present our Shapes PowerPoint Templates because Our PowerPoint Templates and Slides are created with admirable insight. Use them and give your group a sense of your logical mind. Download our Business PowerPoint Templates because Our PowerPoint Templates and Slides are conceived by a dedicated team. Use them and give form to your wondrous ideas.Use these PowerPoint slides for presentations relating to Graph, chart, bar, business, arrow, growth, profit, progress, diagram, vector, success, forecasting, achievement, business, sign, symbol, finance, data, goal, report, marketing, analyzing, abstract, illustration, economic, sale, investment, improvement, statistic, financial. The prominent colors used in the PowerPoint template are Gray, Blue, Black.

Key Values For Project Teams Integration Ppt PowerPoint Presentation File Files PDF
This slide shows tools for effective collaboration to help team members communicate, share data and coordinate easily. It includes document sharing, project planning, workload visualization and tracking projects. Showcasing this set of slides titled Key Values For Project Teams Integration Ppt PowerPoint Presentation File Files PDF. The topics addressed in these templates are Project Planning, Workload Visualization, Project Dashboards. All the content presented in this PPT design is completely editable. Download it and make adjustments in color, background, font etc. as per your unique business setting.

Project Status Report Ppt PowerPoint Presentation Portfolio Structure
This is a project status report ppt powerpoint presentation portfolio structure. This is a three stage process. The stages in this process are project path, key risks, project approval, planning, design.
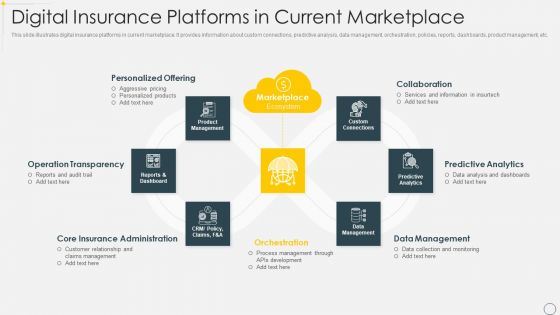
Digital Insurance Platforms In Current Marketplace Slides PDF
This slide illustrates digital insurance platforms in current marketplace. It provides information about custom connections, predictive analysis, data management, orchestration, policies, reports, dashboards, product management, etc. Persuade your audience using this Digital Insurance Platforms In Current Marketplace Slides PDF. This PPT design covers seven stages, thus making it a great tool to use. It also caters to a variety of topics including Operation Transparency, Personalized Offering, Data Management. Download this PPT design now to present a convincing pitch that not only emphasizes the topic but also showcases your presentation skills.

Multiphase Pathway For BI Project Execution BI Transformation Toolset Template PDF
The following slide covers the business intelligence suite implementation timeline to leverage it for data-driven results. It includes phases such as create the BI strategy, develop the roadmap, execute the project. This is a Multiphase Pathway For BI Project Execution BI Transformation Toolset Template PDF template with various stages. Focus and dispense information on five stages using this creative set, that comes with editable features. It contains large content boxes to add your information on topics like Strategy, Project, Dashboards, Execute, Develop. You can also showcase facts, figures, and other relevant content using this PPT layout. Grab it now.
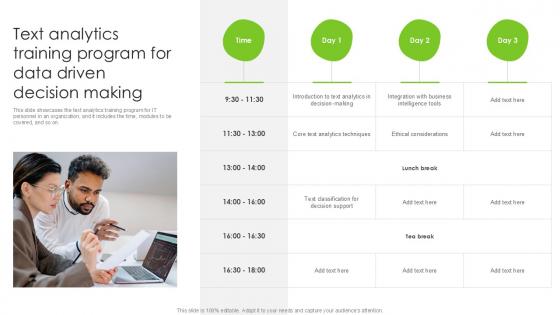
Text Analytics Training Program For Data Driven Decision Making PPT Template SS
This slide showcases the text analytics training program for IT personnel in an organization, and it includes the time, modules to be covered, and so on. Are you searching for a Text Analytics Training Program For Data Driven Decision Making PPT Template SS that is uncluttered, straightforward, and original Its easy to edit, and you can change the colors to suit your personal or business branding. For a presentation that expresses how much effort you have put in, this template is ideal With all of its features, including tables, diagrams, statistics, and lists, its perfect for a business plan presentation. Make your ideas more appealing with these professional slides. Download Text Analytics Training Program For Data Driven Decision Making PPT Template SS from Slidegeeks today.

Trend Line Technical Analysis Powerpoint Themes
This is a trend line technical analysis powerpoint themes. This is a five stage process. The stages in this process are complex systems, statistical modeling, uncertainty, lateral thinking, mathematical analysis.
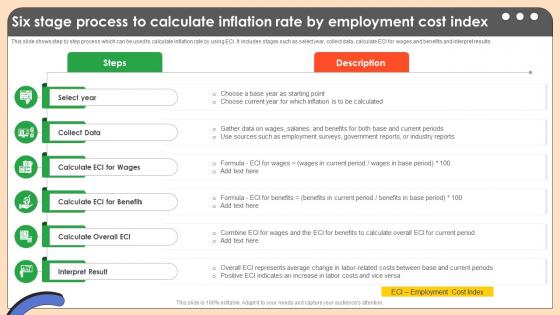
Six Stage Process To Calculate Inflation Rate Comprehensive Guide On Inflation Control CM SS V
This slide shows step by step process which can be used to calculate inflation rate by using ECI. It includes stages such as select year, collect data, calculate ECI for wages and benefits and interpret results. Do you have to make sure that everyone on your team knows about any specific topic I yes, then you should give Six Stage Process To Calculate Inflation Rate Comprehensive Guide On Inflation Control CM SS V a try. Our experts have put a lot of knowledge and effort into creating this impeccable Six Stage Process To Calculate Inflation Rate Comprehensive Guide On Inflation Control CM SS V. You can use this template for your upcoming presentations, as the slides are perfect to represent even the tiniest detail. You can download these templates from the Slidegeeks website and these are easy to edit. So grab these today

Big Data Analytics Market Statistics Port Terminal Industry Ppt Template
The slide examines the attributes on the basis of technology used in the port industry. The purpose of this slide is to make readers aware about the big data analytics market in the port sector. Boost your pitch with our creative Big Data Analytics Market Statistics Port Terminal Industry Ppt Template. Deliver an awe inspiring pitch that will mesmerize everyone. Using these presentation templates you will surely catch everyones attention. You can browse the ppts collection on our website. We have researchers who are experts at creating the right content for the templates. So you do not have to invest time in any additional work. Just grab the template now and use them.

Essential Phases To Simulate Data For Analysis Data Analytics SS V
This slide outlines phases to simulate data aimed at helping businesses understand and solve complex problems. It covers various steps such as form hypothesis, generate random samples and create histogram.Here you can discover an assortment of the finest PowerPoint and Google Slides templates. With these templates, you can create presentations for a variety of purposes while simultaneously providing your audience with an eye-catching visual experience. Download Essential Phases To Simulate Data For Analysis Data Analytics SS V to deliver an impeccable presentation. These templates will make your job of preparing presentations much quicker, yet still, maintain a high level of quality. Slidegeeks has experienced researchers who prepare these templates and write high-quality content for you. Later on, you can personalize the content by editing the Essential Phases To Simulate Data For Analysis Data Analytics SS V.
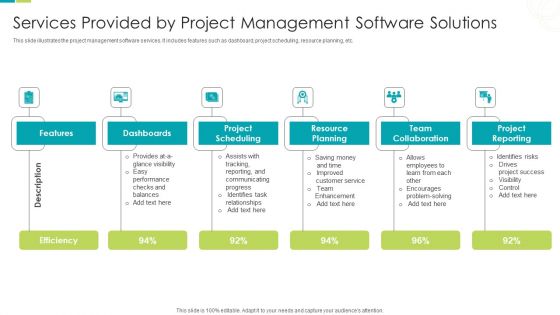
Services Provided By Project Management Software Solutions Ppt PowerPoint Presentation Slides Samples PDF
This slide illustrates the project management software services. It includes features such as dashboard, project scheduling, resource planning, etc. Persuade your audience using this Services Provided By Project Management Software Solutions Ppt PowerPoint Presentation Slides Samples PDF. This PPT design covers six stages, thus making it a great tool to use. It also caters to a variety of topics including Project Scheduling, Resource Planning, Team Collaboration. Download this PPT design now to present a convincing pitch that not only emphasizes the topic but also showcases your presentation skills.

How To Implement Cloud Collaboration Integrating Cloud Project Software With Mobile Devices Inspiration PDF
This slide illustrates integrating cloud project management software with smartphones and devices. It provides information about android, iOS, cost, login, size, logging, to-do list, gantt chart, chat, dashboard, etc. Deliver and pitch your topic in the best possible manner with this How To Implement Cloud Collaboration Integrating Cloud Project Software With Mobile Devices Inspiration PDF. Use them to share invaluable insights on Our Organization, Integrating Cloud, Project Management and impress your audience. This template can be altered and modified as per your expectations. So, grab it now.

Steps To Calculate Inflation Using Producer Comprehensive Guide On Inflation Control CM SS V
This slide shows step by step process which can be used to calculate inflation rate by using producer price index. It includes stages such as select year, determine goods, gather price data, calculate price index, etc. Present like a pro with Steps To Calculate Inflation Using Producer Comprehensive Guide On Inflation Control CM SS V. Create beautiful presentations together with your team, using our easy-to-use presentation slides. Share your ideas in real-time and make changes on the fly by downloading our templates. So whether you are in the office, on the go, or in a remote location, you can stay in sync with your team and present your ideas with confidence. With Slidegeeks presentation got a whole lot easier. Grab these presentations today.
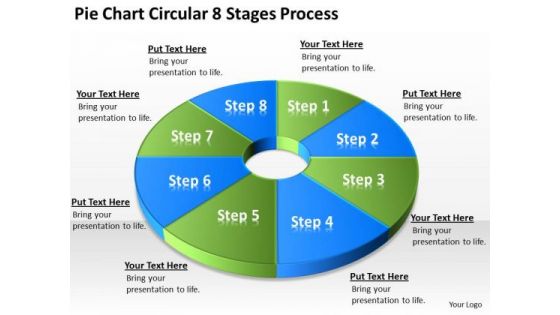
Pie Chart Circular 8 Stages Process Cleaning Service Business Plan PowerPoint Slides
We present our pie chart circular 8 stages process cleaning service business plan PowerPoint Slides.Use our Circle Charts PowerPoint Templates because You can Stir your ideas in the cauldron of our PowerPoint Templates and Slides. Cast a magic spell on your audience. Download and present our Signs PowerPoint Templates because It will Strengthen your hand with your thoughts. They have all the aces you need to win the day. Present our Shapes PowerPoint Templates because Our PowerPoint Templates and Slides will provide you a launch platform. Give a lift off to your ideas and send them into orbit. Download our Process and Flows PowerPoint Templates because Our PowerPoint Templates and Slides will provide weight to your words. They will bring out the depth of your thought process. Use our Business PowerPoint Templates because Our PowerPoint Templates and Slides will let Your superior ideas hit the target always and everytime.Use these PowerPoint slides for presentations relating to sign, overview, chart, market, statistics, sales, forecasting, slice, economy, display, corporate, business, concept, presentation, symbol, diagram, percentage, graphic, finance, data, bank, report, marketing, analyzing, trading, accounting, management, graph, icon, earnings, piece, circular, strategy, growth, company, control, competition, progress, account, profit, part, information, investment, banking, index, financial, results, portion, performance, exchange. The prominent colors used in the PowerPoint template are Green, Blue, White.

Table Of Contents For Data Analytics Company Outline Formats PDF
Take your projects to the next level with our ultimate collection of Table Of Contents For Data Analytics Company Outline Formats PDF Slidegeeks has designed a range of layouts that are perfect for representing task or activity duration, keeping track of all your deadlines at a glance. Tailor these designs to your exact needs and give them a truly corporate look with your own brand colors they will make your projects stand out from the rest
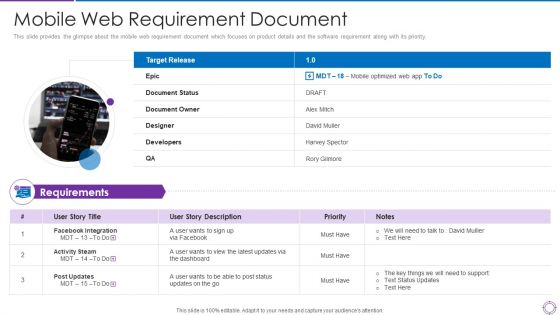
Project Administration Planning Mobile Web Requirement Document Ppt PowerPoint Presentation File Ideas PDF
This slide provides the glimpse about the mobile web requirement document which focuses on product details and the software requirement along with its priority. Presenting project administration planning mobile web requirement document ppt powerpoint presentation file ideas pdf to provide visual cues and insights. Share and navigate important information on one stages that need your due attention. This template can be used to pitch topics like developers, dashboard, designer, target. In addtion, this PPT design contains high resolution images, graphics, etc, that are easily editable and available for immediate download.

 Home
Home