Financial Snapshot
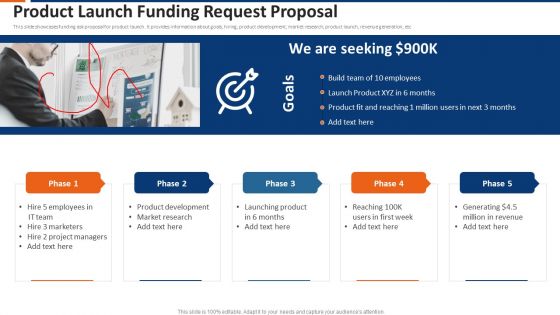
Product Launch Funding Request Proposal Ppt Pictures Shapes PDF
This slide showcases funding ask proposal for product launch. It provides information about goals, hiring, product development, market research, product launch, revenue generation, etc. Persuade your audience using this product launch funding request proposal ppt pictures shapes pdf. This PPT design covers five stages, thus making it a great tool to use. It also caters to a variety of topics including employees, it team, product development, market research. Download this PPT design now to present a convincing pitch that not only emphasizes the topic but also showcases your presentation skills.
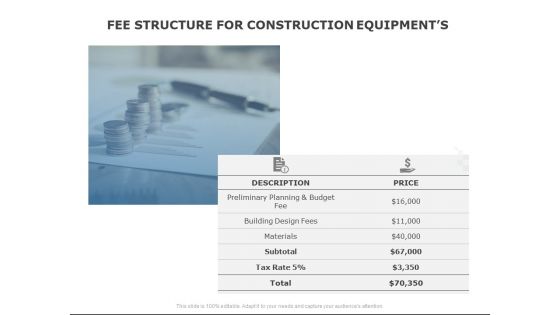
Fee Structure For Construction Equipments Ppt PowerPoint Presentation Pictures Inspiration
Presenting this set of slides with name fee structure for construction equipments ppt powerpoint presentation pictures inspiration. This is a two stage process. The stages in this process are construction, equipments, planning, budget, materials. This is a completely editable PowerPoint presentation and is available for immediate download. Download now and impress your audience.

Price Architecture Cost Sheet Ratio Cont Ppt PowerPoint Presentation Portfolio Guidelines PDF
These four key performance indicator calculates a gross profit margin. Presenting price architecture cost sheet ratio cont ppt powerpoint presentation portfolio guidelines pdf to provide visual cues and insights. Share and navigate important information on four stages that need your due attention. This template can be used to pitch topics like gross profit margin, direct material cost per unit, direct labor cost per unit, fixed overhead cost per unit, sales volume, sales revenue. In addition, this PPT design contains high-resolution images, graphics, etc, that are easily editable and available for immediate download.

Stock Market Research Report Balance Sheet FY19 Tabular Form Investments Designs PDF
The purpose of the following slide is to display a tabular representation of the key performance indicators of the balance sheet for four quarters of FY 2019. These KPIs can be Current assets, Current Liability , Total Assets and Total Liabilities. This is a stock market research report balance sheet fy19 tabular form investments designs pdf template with various stages. Focus and dispense information on one stages using this creative set, that comes with editable features. It contains large content boxes to add your information on topics like non current investments, long term loans and advances, current investments, inventories, trade receivables. You can also showcase facts, figures, and other relevant content using this PPT layout. Grab it now.

Debt Retrieval Techniques Understanding Our Cash Flow Statements Kpi Fy 20 21 Ppt Infographic Template Background Images PDF
Purpose of the following slide is to show the major key performing indicators of the organization , these KPIs can be the operation activities, cash flow from financing activities, investing activities and the net decrease in cash flow This is a debt retrieval techniques understanding our cash flow statements kpi fy 20 21 ppt infographic template background images pdf template with various stages. Focus and dispense information on four stages using this creative set, that comes with editable features. It contains large content boxes to add your information on topics like cash flow from operations, cash flow from investing activities, cash flow from financing activities, change in cash and cash equivalents. You can also showcase facts, figures, and other relevant content using this PPT layout. Grab it now.
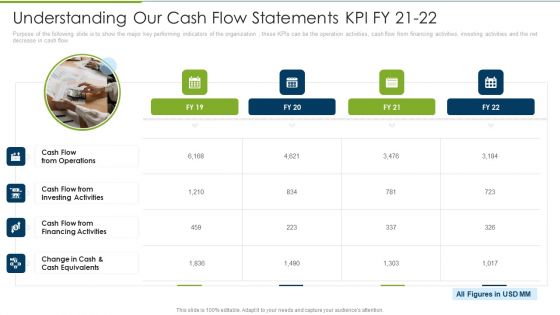
Understanding Our Cash Flow Statements KPI Fy 21 To 22 Debt Collection Improvement Plan Slides PDF
Purpose of the following slide is to show the major key performing indicators of the organization , these KPIs can be the operation activities, cash flow from financing activities, investing activities and the net decrease in cash flow. Presenting understanding our cash flow statements kpi fy 21 to 22 debt collection improvement plan slides pdf to provide visual cues and insights. Share and navigate important information on four stages that need your due attention. This template can be used to pitch topics like cash flow from operations, cash flow from investing activities, cash flow from financing activities, change in cash and cash equivalents. In addtion, this PPT design contains high resolution images, graphics, etc, that are easily editable and available for immediate download.
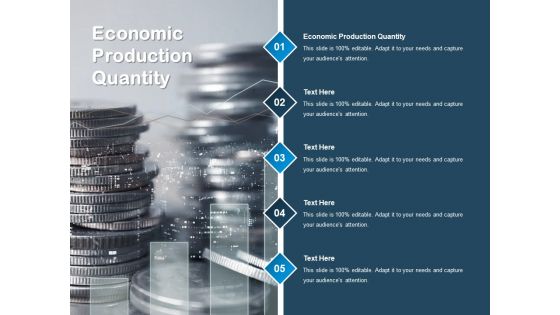
Economic Production Quantity Ppt PowerPoint Presentation Show Graphics Pictures Cpb Pdf
Presenting this set of slides with name economic production quantity ppt powerpoint presentation show graphics pictures cpb pdf. This is an editable Powerpoint five stages graphic that deals with topics like economic production quantity to help convey your message better graphically. This product is a premium product available for immediate download and is 100 percent editable in Powerpoint. Download this now and use it in your presentations to impress your audience.
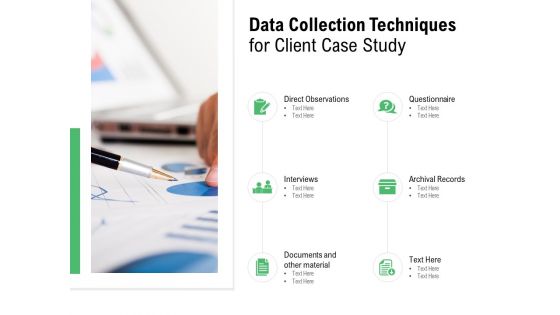
Data Collection Techniques For Client Case Study Observations Ppt PowerPoint Presentation Ideas Demonstration
Presenting this set of slides with name data collection techniques for client case study observations ppt powerpoint presentation ideas demonstration. This is a six stage process. The stages in this process are finance, marketing, management, investment, analysis. This is a completely editable PowerPoint presentation and is available for immediate download. Download now and impress your audience.
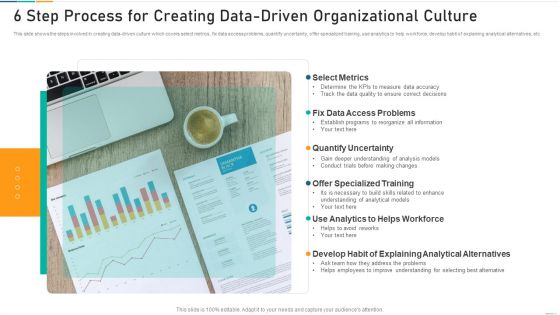
6 Step Process For Creating Data Driven Organizational Culture Background PDF
Presenting 6 step process for creating data driven organizational culture background pdf to dispense important information. This template comprises six stages. It also presents valuable insights into the topics including metrics, analysis, information. This is a completely customizable PowerPoint theme that can be put to use immediately. So, download it and address the topic impactfully.
Business Budget Costing Sheet Icon Ppt PowerPoint Presentation Pictures Icon PDF
Persuade your audience using this business budget costing sheet icon ppt powerpoint presentation pictures icon pdf. This PPT design covers three stages, thus making it a great tool to use. It also caters to a variety of topics including business budget costing sheet icon. Download this PPT design now to present a convincing pitch that not only emphasizes the topic but also showcases your presentation skills.
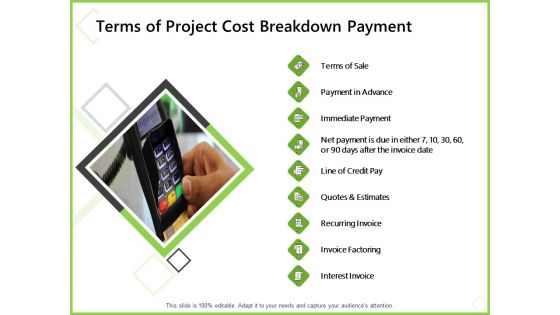
Budget Cost Project Plan Terms Of Project Cost Breakdown Payment Pictures PDF
This is a budget cost project plan terms of project cost breakdown payment pictures pdf template with various stages. Focus and dispense information on nine stages using this creative set, that comes with editable features. It contains large content boxes to add your information on topics like interest invoice, invoice factoring, recurring invoice, quotes and estimates, line of credit pay, payment in advance. You can also showcase facts, figures, and other relevant content using this PPT layout. Grab it now.

Tactical And Strategic Analysis Planning And Implementation Process Graphics PDF
This slide defines the template defining steps to conduct strategic analysis planning. It includes information related to the firm goals, data, strategy and evaluation. Persuade your audience using this Tactical And Strategic Analysis Planning And Implementation Process Graphics PDF. This PPT design covers four stages, thus making it a great tool to use. It also caters to a variety of topics including Evaluate And Control, Analyze Information, Goals And Objectives. Download this PPT design now to present a convincing pitch that not only emphasizes the topic but also showcases your presentation skills.
Decentralization App Development Use Case Money Management Andtransfer Icons PDF
This slide depicts the money management and transfer use case of decentralized apps its benefits have been evident in the growth of crypto tokens. Slidegeeks is here to make your presentations a breeze with Decentralization App Development Use Case Money Management Andtransfer Icons PDF With our easy to use and customizable templates, you can focus on delivering your ideas rather than worrying about formatting. With a variety of designs to choose from, you are sure to find one that suits your needs. And with animations and unique photos, illustrations, and fonts, you can make your presentation pop. So whether you are giving a sales pitch or presenting to the board, make sure to check out Slidegeeks first.
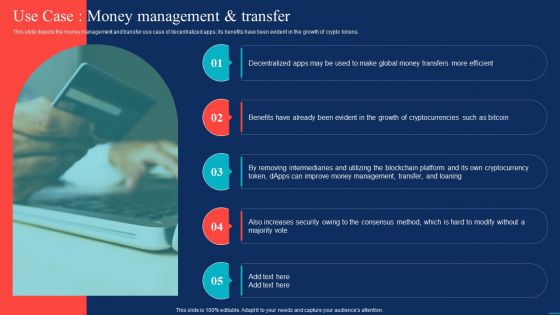
Decentralized Applications Use Case Money Management And Transfer Sample PDF
This slide depicts the money management and transfer use case of decentralized apps its benefits have been evident in the growth of crypto tokens. Slidegeeks is here to make your presentations a breeze with Decentralized Applications Use Case Money Management And Transfer Sample PDF With our easy to use and customizable templates, you can focus on delivering your ideas rather than worrying about formatting. With a variety of designs to choose from, you are sure to find one that suits your needs. And with animations and unique photos, illustrations, and fonts, you can make your presentation pop. So whether you are giving a sales pitch or presenting to the board, make sure to check out Slidegeeks first.

Raising Company Capital From Public Funding Sources Funding Requirement And Investment Terms Pictures PDF
The slide provides key points capital requirement, valuation and investment terms related to funding requirements of the company. Presenting raising company capital from public funding sources funding requirement and investment terms pictures pdf to provide visual cues and insights. Share and navigate important information on three stages that need your due attention. This template can be used to pitch topics like capital requirement, companys valuation, investment terms, convertible note, preferred equity, pre money valuation. In addition, this PPT design contains high-resolution images, graphics, etc, that are easily editable and available for immediate download.
Competitive Analysis Template 6 Scatter Chart Ppt PowerPoint Presentation Icon Example Topics
This is a competitive analysis template 6 scatter chart ppt powerpoint presentation icon example topics. This is a eight stage process. The stages in this process are users interface, data import, example, pricing, support, update, tutorials, easy to use.

Sales Kpi Target Powerpoint Slide Background Picture
This is a sales kpi target powerpoint slide background picture. This is a four stage process. The stages in this process are business, management, marketing, finance, strategy.

Clustered Column Ppt PowerPoint Presentation Picture
This is a clustered column ppt powerpoint presentation picture. This is a two stage process. The stages in this process are product, jan, feb, mar, apr.

Stacked Bar Ppt PowerPoint Presentation Pictures Background
This is a stacked bar ppt powerpoint presentation pictures background. This is a two stage process. The stages in this process are scatter bar, finance, analysis, marketing, business.

Line Chart Ppt PowerPoint Presentation Summary Picture
This is a line chart ppt powerpoint presentation summary picture. This is a two stage process. The stages in this process are business, marketing, line chart, management, product.
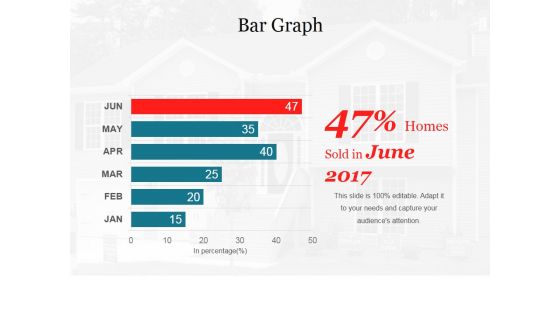
Bar Graph Ppt PowerPoint Presentation File Picture
This is a bar graph ppt powerpoint presentation file picture. This is a six stage process. The stages in this process are management, planning, marketing, business, strategy.

Combo Chart Ppt PowerPoint Presentation Pictures Background
This is a combo chart ppt powerpoint presentation pictures background. This is a eight stage process. The stages in this process are combo chart, growth, strategy, analysis, business.
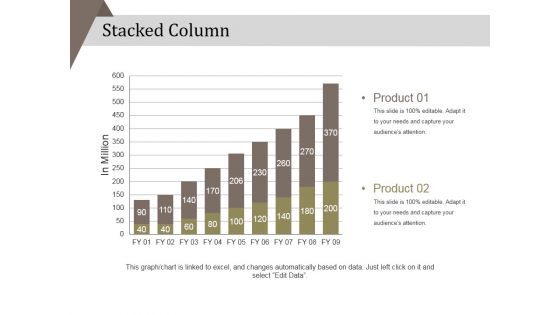
Stacked Column Ppt PowerPoint Presentation Ideas Pictures
This is stacked column ppt powerpoint presentation ideas pictures. This is a two stage process. The stages in this process are product, in million, strategy management, business, finance.
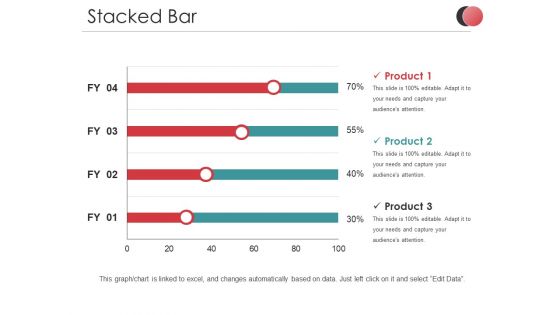
Stacked Bar Ppt PowerPoint Presentation Pictures Graphics
This is a stacked bar ppt powerpoint presentation pictures graphics. This is a three stage process. The stages in this process are product, percentage, business, marketing, finance.
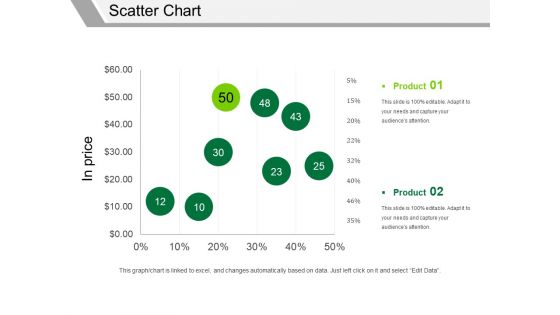
Scatter Chart Ppt PowerPoint Presentation Pictures Elements
This is a scatter chart ppt powerpoint presentation pictures elements. This is a two stage process. The stages in this process are in price, product, finance, business, marketing.
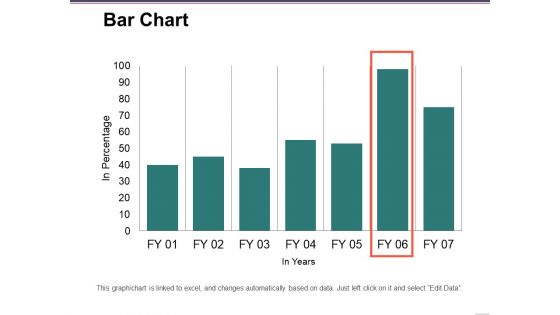
Bar Chart Ppt PowerPoint Presentation Pictures Inspiration
This is a bar chart ppt powerpoint presentation pictures inspiration. This is a seven stage process. The stages in this process are in percentage, business, marketing, finance, graph.

Stock Chart Ppt PowerPoint Presentation Summary Pictures
This is a stock chart ppt powerpoint presentation summary pictures. This is a five stage process. The stages in this process are high, volume, low, product, graph.
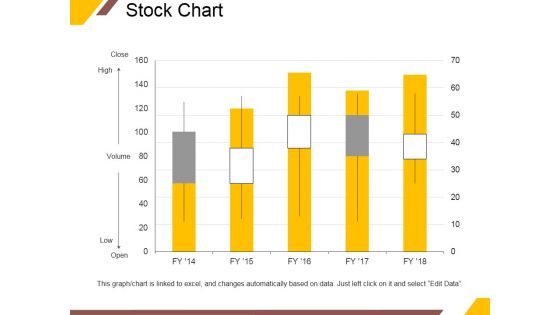
Stock Chart Ppt PowerPoint Presentation Professional Pictures
This is a stock chart ppt powerpoint presentation professional pictures. This is a five stage process. The stages in this process are close, high, volume, low, open.
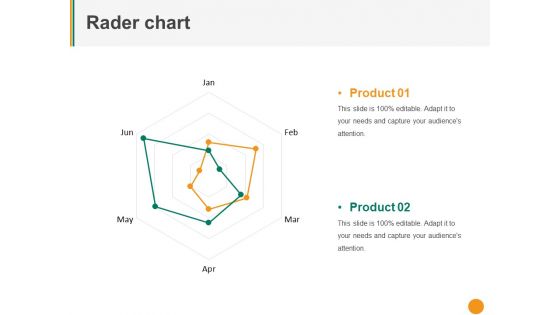
Rader Chart Ppt PowerPoint Presentation Professional Pictures
This is a rader chart ppt powerpoint presentation professional pictures. This is a two stage process. The stages in this process are product, finance, business, marketing.
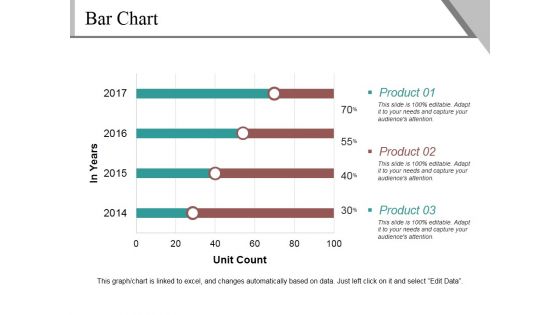
Bar Chart Ppt PowerPoint Presentation Summary Pictures
This is a bar chart ppt powerpoint presentation summary pictures. This is a four stage process. The stages in this process are product, unit count, finance, percentage, business.

Line Chart Ppt PowerPoint Presentation Pictures Portfolio
This is a line chart ppt powerpoint presentation pictures portfolio. This is a two stage process. The stages in this process are profit, business, marketing, finance, chart.
Radar Chart Ppt PowerPoint Presentation Icon Picture
This is a radar chart ppt powerpoint presentation icon picture. This is a two stage process. The stages in this process are chart, finance, marketing, business, strategy.

Clustered Column Ppt PowerPoint Presentation Pictures Objects
This is a clustered column ppt powerpoint presentation pictures objects. This is a two stage process. The stages in this process are profit, business, marketing, finance graph.

Column Chart Ppt PowerPoint Presentation Styles Picture
This is a column chart ppt powerpoint presentation styles picture. This is a five stage process. The stages in this process are years, business, marketing, graph, finance.

Clustered Bar Ppt PowerPoint Presentation Pictures Display
This is a clustered bar ppt powerpoint presentation pictures display. This is a two stage process. The stages in this process are clustered bar, finance, marketing, strategy, business.

Clustered Bar Ppt PowerPoint Presentation Pictures Demonstration
This is a clustered bar ppt powerpoint presentation pictures demonstration. This is a two stage process. The stages in this process are clustered bar, finance, marketing, analysis, business.

Experience Projects Ppt PowerPoint Presentation Pictures Example
This is a experience projects ppt powerpoint presentation pictures example. This is a four stage process. The stages in this process are finance, analysis, business, marketing, strategy.

Area Chart Ppt PowerPoint Presentation Show Picture
This is a area chart ppt powerpoint presentation show picture. This is a two stage process. The stages in this process are area chart, finance, marketing, strategy, business.
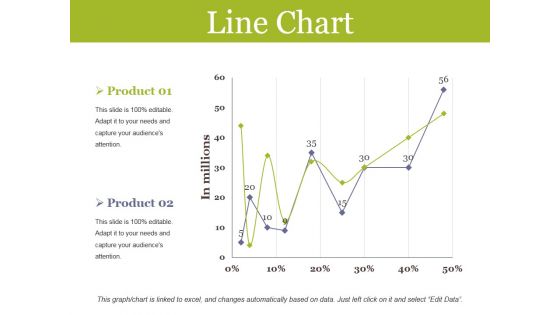
Line Chart Ppt PowerPoint Presentation Pictures Inspiration
This is a line chart ppt powerpoint presentation pictures inspiration. This is a two stage process. The stages in this process are line chart, finance, growth, analysis, business.
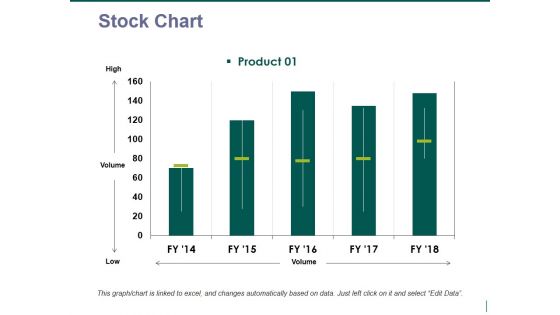
stock chart ppt powerpoint presentation pictures mockup
This is a stock chart ppt powerpoint presentation pictures mockup. This is a one stage process. The stages in this process are stock chart, high, volume, low.
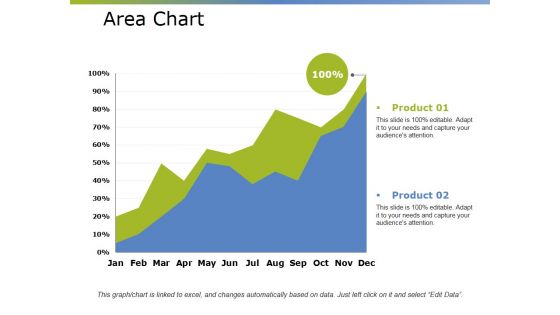
Area Chart Ppt PowerPoint Presentation Pictures Maker
This is a area chart ppt powerpoint presentation pictures maker. This is a two stage process. The stages in this process are finance, business, marketing, planning, strategy.
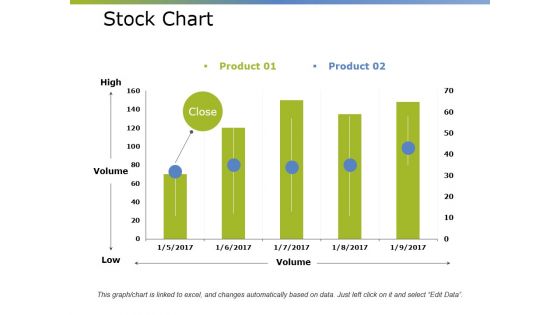
Stock Chart Ppt PowerPoint Presentation Pictures Files
This is a stock chart ppt powerpoint presentation pictures files. This is a five stage process. The stages in this process are business, marketing, planning, finance, strategy.

Stock Chart Ppt PowerPoint Presentation Pictures Model
This is a stock chart ppt powerpoint presentation pictures model. This is a two stage process. The stages in this process are business, high, volume, low, chart.

Stacked Bar Ppt PowerPoint Presentation Pictures Slides
This is a stacked bar ppt powerpoint presentation pictures slides. This is a two stage process. The stages in this process are business, marketing, graph, finance, strategy.
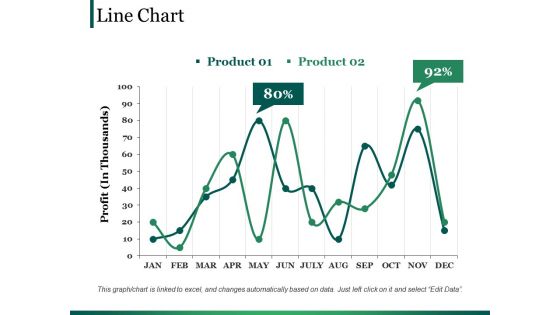
Line Chart Ppt PowerPoint Presentation Show Pictures
This is a line chart ppt powerpoint presentation show pictures. This is a two stage process. The stages in this process are business, marketing, line, finance, planning.

Profitability Ratios Ppt PowerPoint Presentation Model Picture
This is a profitability ratios ppt powerpoint presentation model picture. This is a two stage process. The stages in this process are business, marketing, bar, finance, planning.

Competitive Analysis Ppt PowerPoint Presentation Summary Picture
This is a competitive analysis ppt powerpoint presentation summary picture. This is a one stage process. The stages in this process are business, marketing, competitive analysis, finance, graph.
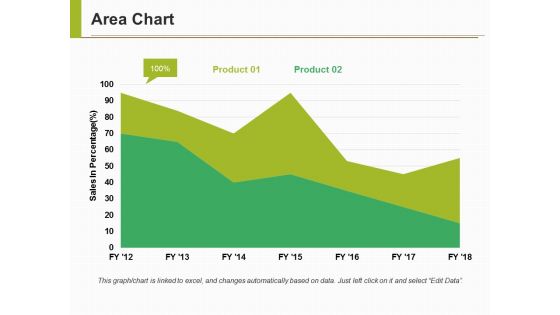
Area Chart Ppt PowerPoint Presentation Pictures Influencers
This is a area chart ppt powerpoint presentation pictures influencers. This is a two stage process. The stages in this process are business, marketing, strategy, finance, planning.
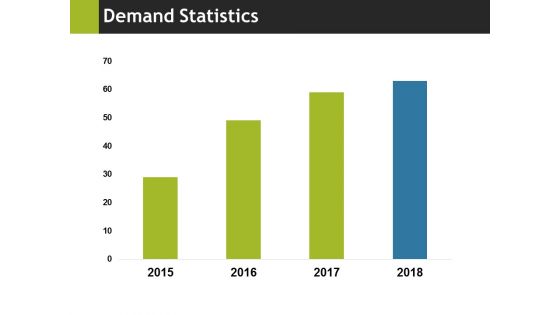
Demand Statistics Ppt PowerPoint Presentation Pictures Slides
This is a demand statistics ppt powerpoint presentation pictures slides. This is a four stage process. The stages in this process are business, marketing, years, finance, strategy.
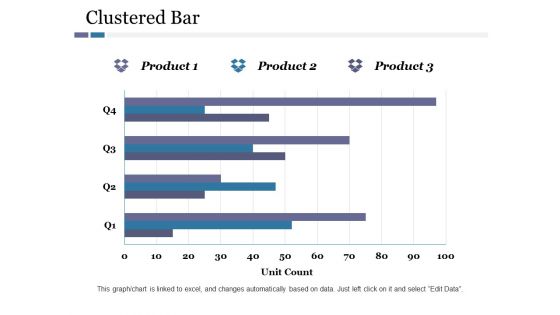
Clustered Bar Ppt PowerPoint Presentation Pictures Guidelines
This is a clustered bar ppt powerpoint presentation pictures guidelines. This is a three stage process. The stages in this process are clustered bar, finance, marketing, strategy, business.
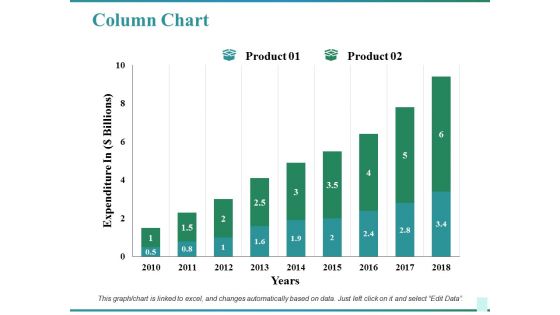
Column Chart Ppt PowerPoint Presentation Inspiration Picture
This is a column chart ppt powerpoint presentation inspiration picture. This is a two stage process. The stages in this process are business, marketing, years, expenditure in, chart.
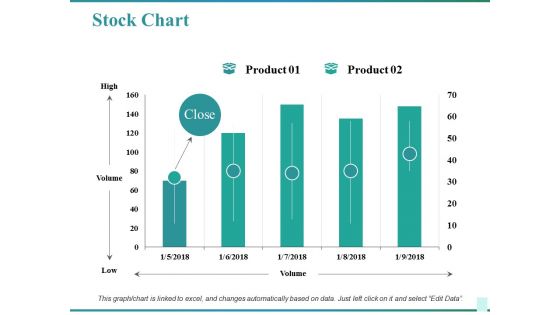
Stock Chart Ppt PowerPoint Presentation Pictures Microsoft
This is a stock chart ppt powerpoint presentation pictures microsoft. This is a two stage process. The stages in this process are business, high, volume, low, chart.
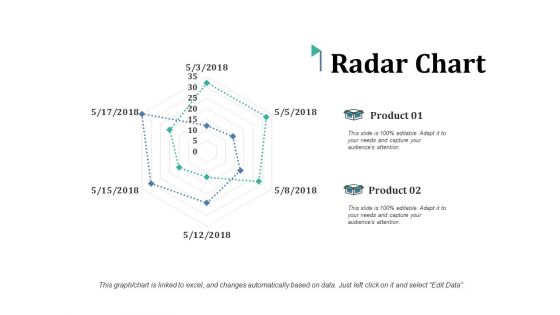
Radar Chart Ppt PowerPoint Presentation Pictures Smartart
This is a radar chart ppt powerpoint presentation pictures smartart. This is a two stage process. The stages in this process are radar chart, finance, marketing, analysis, management.

Brand Measurement Ppt PowerPoint Presentation Pictures Shapes
This is a brand measurement ppt powerpoint presentation pictures shapes. This is a two stage process. The stages in this process are finance, marketing, management, investment, analysis.

Clustered Column Ppt PowerPoint Presentation Infographics Picture
This is a clustered column ppt powerpoint presentation infographics picture. This is a two stage process. The stages in this process are finance, marketing, management, investment, analysis.
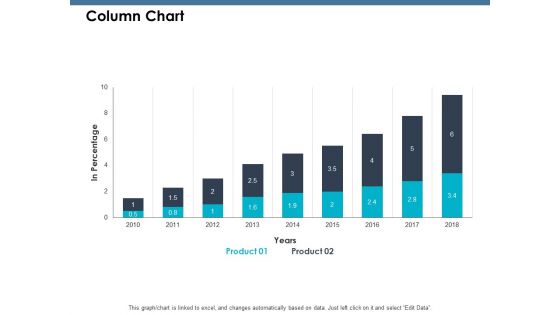
Column Chart Ppt PowerPoint Presentation Pictures Aids
This is a column chart ppt powerpoint presentation pictures aids. This is a two stage process. The stages in this process are Percentage, Product, Marketing, Management.
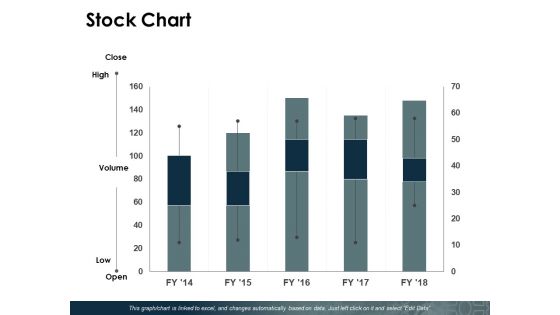
Stock Chart Ppt PowerPoint Presentation Show Pictures
This is a stock chart ppt powerpoint presentation show pictures. This is a five stage process. The stages in this process are product, percentage, management, marketing.

Line Chart Ppt PowerPoint Presentation Pictures Graphics
This is a line chart ppt powerpoint presentation pictures graphics. This is a two stage process. The stages in this process are finance, marketing, management, investment, analysis.
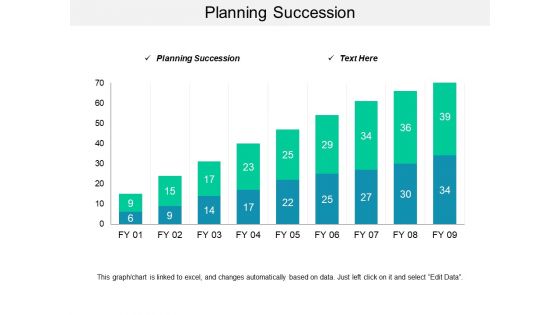
Planning Succession Ppt PowerPoint Presentation Pictures Microsoft
This is a planning succession ppt powerpoint presentation pictures microsoft. This is a two stage process. The stages in this process are planning succession.
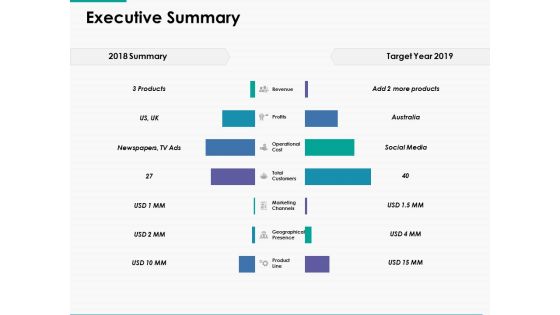
Executive Summary Ppt Powerpoint Presentation Pictures Ideas
This is a executive summary ppt powerpoint presentation pictures ideas. This is a two stage process. The stages in this process are finance, marketing, management, investment, analysis.

 Home
Home