Financial Snapshot

Yearly Business Performance Chart For Customer Profitability Analysis Ppt PowerPoint Presentation Ideas Picture
This is a yearly business performance chart for customer profitability analysis ppt powerpoint presentation ideas picture. This is a five stage process. The stages in this process are financial analysis, quantitative, statistical modelling.
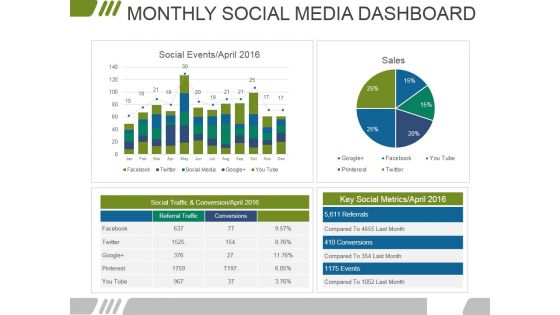
Monthly Social Media Dashboard Ppt PowerPoint Presentation Infographics Files
This is a monthly social media dashboard ppt powerpoint presentation infographics files. This is a four stage process. The stages in this process are marketing, business, financial, data analysis, management.
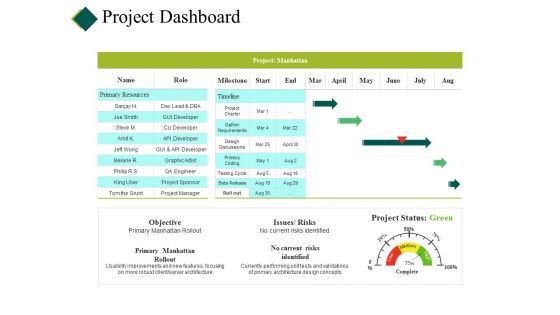
Project Dashboard Ppt PowerPoint Presentation Pictures Backgrounds
This is a project dashboard ppt powerpoint presentation pictures backgrounds. This is a four stage process. The stages in this process are cost, planning, table, project report, data management.

Crm Dashboard Current Lead Status Ppt PowerPoint Presentation Guide
This is a crm dashboard current lead status ppt powerpoint presentation guide. This is a six stage process. The stages in this process are business, marketing, success, presentation, financial.

Monthly Social Media Dashboard Ppt PowerPoint Presentation Pictures Guide
This is a monthly social media dashboard ppt powerpoint presentation pictures guide. This is a two stage process. The stages in this process are social traffic and conversions april, key social metrics april, facebook, twitter, google.
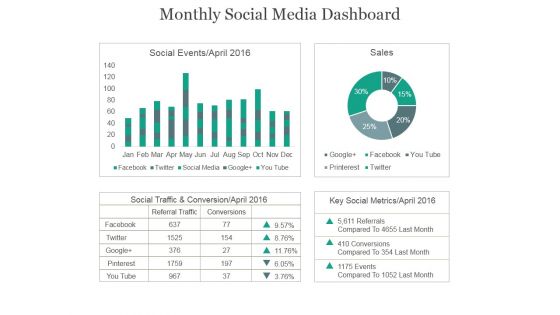
Monthly Social Media Dashboard Ppt PowerPoint Presentation Example 2015
This is a monthly social media dashboard ppt powerpoint presentation example 2015. This is a four stage process. The stages in this process are social events, sales, social traffic, conservation, key social metrics.
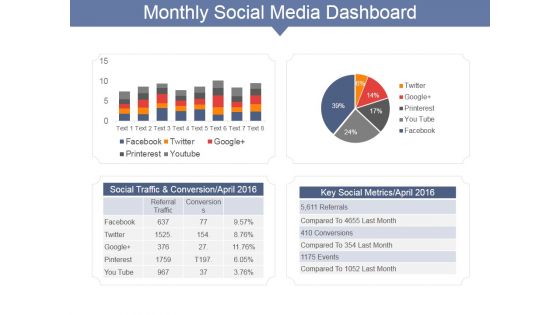
Monthly Social Media Dashboard Ppt PowerPoint Presentation Gallery Show
This is a monthly social media dashboard ppt powerpoint presentation gallery show. This is a two stage process. The stages in this process are social traffic and conversion april, key social metrics april, facebook, twitter.
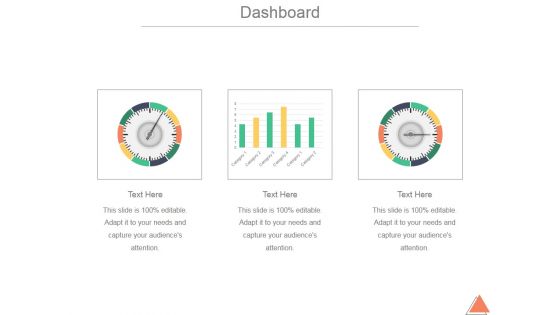
Dashboard Ppt PowerPoint Presentation Infographics
This is a dashboard ppt powerpoint presentation infographics. This is a three stage process. The stages in this process are business, marketing, dashboard, analysis, finance.
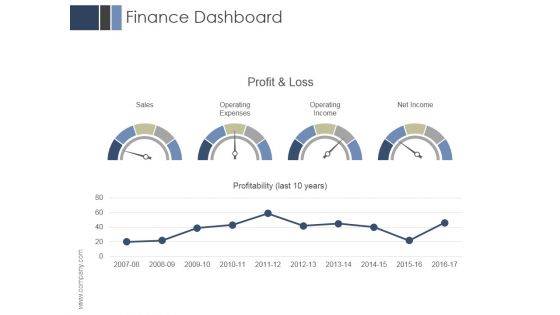
Finance Dashboard Ppt PowerPoint Presentation Design Ideas
This is a finance dashboard ppt powerpoint presentation design ideas. This is a two stage process. The stages in this process are sales, operating expenses, operating income, net income.

Sales Dashboard Template 1 Ppt PowerPoint Presentation Layouts
This is a sales dashboard template 1 ppt powerpoint presentation layouts. This is a three stage process. The stages in this process are sales and percent growth of product, sales of last weeks, percent growth.
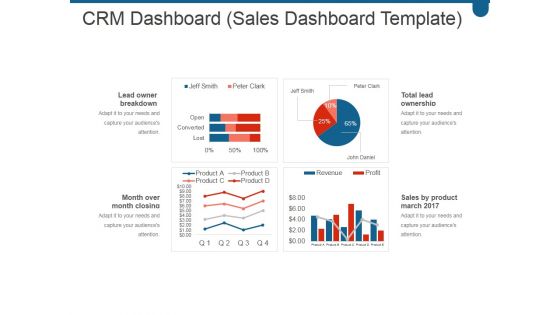
Crm Dashboard Sales Dashboard Template Ppt PowerPoint Presentation Microsoft
This is a crm dashboard sales dashboard template ppt powerpoint presentation microsoft. This is a four stage process. The stages in this process are lead owner breakdown, month over month closing trend, total lead ownership, sales by product march 2017.
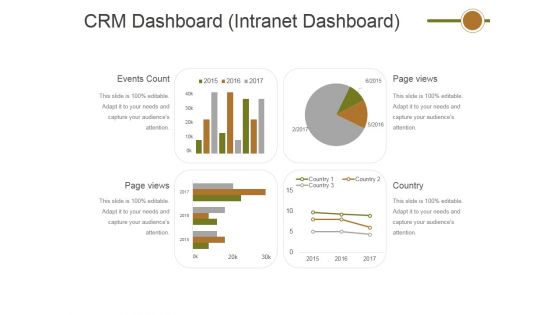
Crm Dashboard Intranet Dashboard Ppt PowerPoint Presentation Outline Professional
This is a crm dashboard intranet dashboard ppt powerpoint presentation outline professional. This is a four stage process. The stages in this process are events count, page views, page views, country.
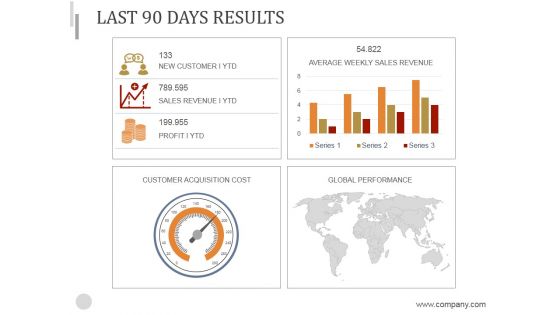
Last 90 Days Results Ppt PowerPoint Presentation Background Image
This is a last 90 days results ppt powerpoint presentation background image. This is a four stage process. The stages in this process are customer acquisition cost, global performance, average weekly sales revenue.

Revenue Dashboard Ppt PowerPoint Presentation Sample
This is a revenue dashboard ppt powerpoint presentation sample. This is a five stage process. The stages in this process are trends of sales cycle times, industries contribution, revenue trends, deal drop off by stage.

Current Status Of Product Ppt PowerPoint Presentation Designs Download
This is a current status of product ppt powerpoint presentation designs download. This is a three stage process. The stages in this process are speedometer, dashboard, business, marketing, finance.

Milestones For The Next Reporting Period Template Ppt PowerPoint Presentation Background Images
This is a milestones for the next reporting period template ppt powerpoint presentation background images. This is a six stage process. The stages in this process are jan, feb, mar, apr, may, jun.
Website Performance Review Ppt PowerPoint Presentation Icon Deck
This is a website performance review ppt powerpoint presentation icon deck. This is a three stage process. The stages in this process are conversion rate, average visit value goal, visits.

Sales Performance Dashboard Ppt PowerPoint Presentation Show
This is a sales performance dashboard ppt powerpoint presentation show. This is a four stage process. The stages in this process are lead sources revenue share, total sales by month, opportunities total sales by probability, win loss ratio.

Marketing Dashboard Ppt PowerPoint Presentation Templates
This is a marketing dashboard ppt powerpoint presentation templates. This is a two stage process. The stages in this process are business, marketing, management, finance, dashboard.

Data Analytics Ppt PowerPoint Presentation Graphics
This is a data analytics ppt powerpoint presentation graphics. This is a five stage process. The stages in this process are data analysis, business, marketing, success, graph.

Data Analytics Ppt PowerPoint Presentation Themes
This is a data analytics ppt powerpoint presentation themes. This is a five stage process. The stages in this process are business, marketing, presentation, data analyst, management.
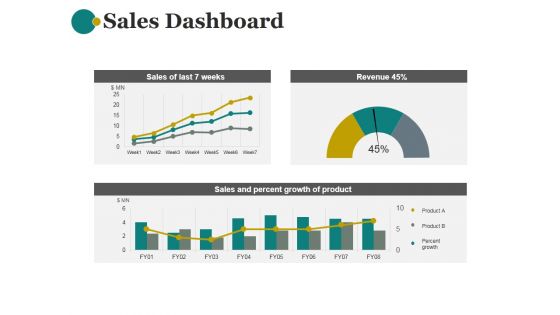
Sales Dashboard Template 1 Ppt PowerPoint Presentation Show
This is a sales dashboard template 1 ppt powerpoint presentation show. This is a three stage process. The stages in this process are sales of last 7 weeks, revenue, sales and percent growth of product.
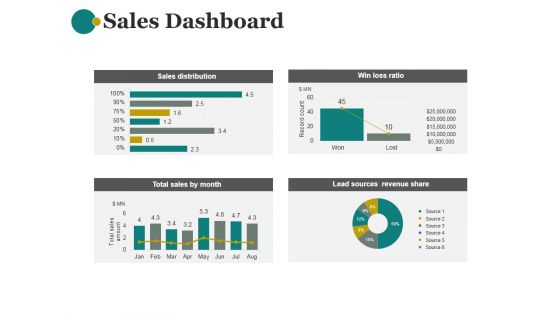
Sales Dashboard Template 2 Ppt PowerPoint Presentation Examples
This is a sales dashboard template 2 ppt powerpoint presentation examples. This is a four stage process. The stages in this process are sales distribution, win loss ratio, lead sources revenue share, total sales by month.

Sales Performance Dashboard Ppt PowerPoint Presentation Example 2015
This is a sales performance dashboard ppt powerpoint presentation example 2015. This is a four stage process. The stages in this process are business, marketing, management, finance, dashboard.

Company Sales And Performance Dashboard Ppt PowerPoint Presentation Slides Grid
This is a company sales and performance dashboard ppt powerpoint presentation slides grid. This is a four stage process. The stages in this process are business, strategy, marketing, finance, analysis.

Crm Dashboard Top Customer Ppt PowerPoint Presentation Ideas
This is a crm dashboard top customer ppt powerpoint presentation ideas. This is a five stage process. The stages in this process are customer.

Crm Sales Rep Dashboard Ppt PowerPoint Presentation Clipart
This is a crm sales rep dashboard ppt powerpoint presentation clipart. This is a three stage process. The stages in this process are identity, qualification, develop, proposal, negotiation.

Email Activity Dashboard Ppt Powerpoint Presentation Styles Summary
This is a email activity dashboard ppt powerpoint presentation styles summary. This is a three stage process. The stages in this process are sent, opens, clicks, visits, unsubscribed, bounced, qualifying campaign.
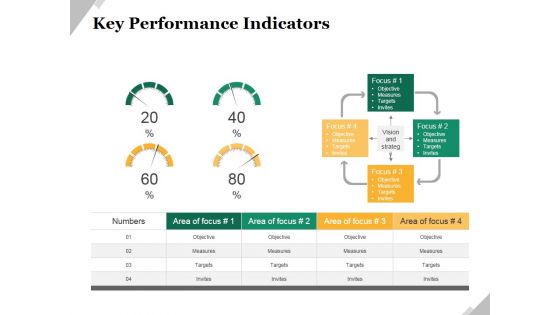
Key Performance Indicators Template 2 Ppt PowerPoint Presentation Model Example
This is a key performance indicators template 2 ppt powerpoint presentation model example. This is a four stage process. The stages in this process are objective, measures, targets, invites, indicators.

Key Performance Indicators Template 2 Ppt PowerPoint Presentation Layouts Portfolio
This is a key performance indicators template 2 ppt powerpoint presentation layouts portfolio. This is a four stage process. The stages in this process are objective, measures, targets, invites.
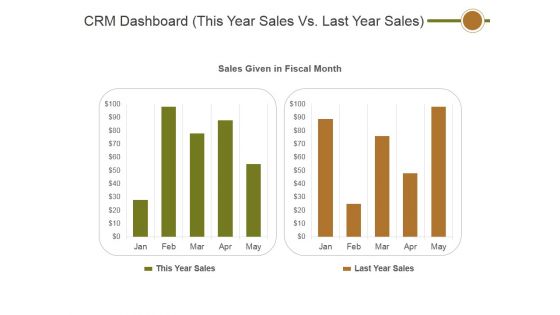
Crm Dashboard This Year Sales Vs Last Year Sales Ppt PowerPoint Presentation Layouts Outline
This is a crm dashboard this year sales vs last year sales ppt powerpoint presentation layouts outline. This is a two stage process. The stages in this process are sales given in fiscal month, this year sales, last year sales.

Cash Flow Statement Kpis Template Ppt PowerPoint Presentation Pictures Diagrams
This is a cash flow statement kpis template ppt powerpoint presentation pictures diagrams. This is a four stage process. The stages in this process are operations, financing activities, investing activities, net increase in cash.

Balance Sheet Kpis Ppt PowerPoint Presentation Professional
This is a balance sheet kpis ppt powerpoint presentation professional. This is a four stage process. The stages in this process are current assets, current liabilities, total assets, total liabilities.
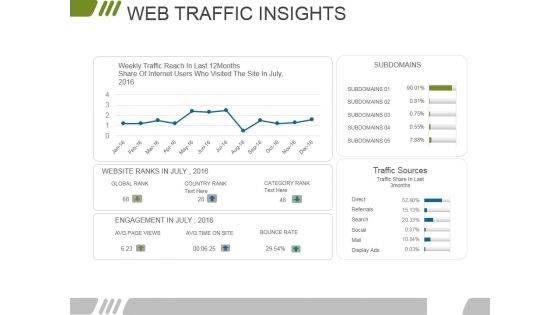
Web Traffic Insights Ppt PowerPoint Presentation Pictures Portrait
This is a web traffic insights ppt powerpoint presentation pictures portrait. This is a four stage process. The stages in this process are subdomains, traffic sources, category rank, country rank, global rank.
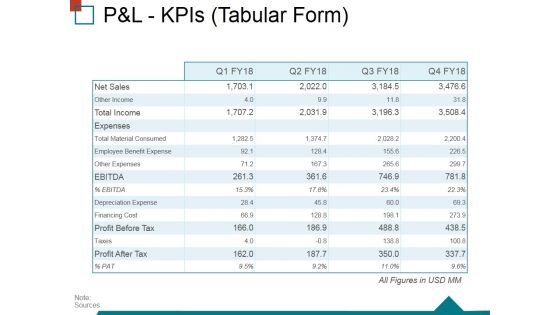
Pandl Kpis Tabular Form Ppt PowerPoint Presentation Ideas Structure
This is a pandl kpis tabular form ppt powerpoint presentation ideas structure. This is a four stage process. The stages in this process are operating profit, revenue, cogs, net profit.
Project Health Card Ppt PowerPoint Presentation Icon Grid
This is a project health card ppt powerpoint presentation icon grid. This is a six stage process. The stages in this process are cost, planning, table, project report, data management.

Data Collection And Analysis Control Chart Ppt PowerPoint Presentation Visuals
This is a data collection and analysis control chart ppt powerpoint presentation visuals. This is a ten stage process. The stages in this process are upper limit, centerline, lower limit, plotted points.
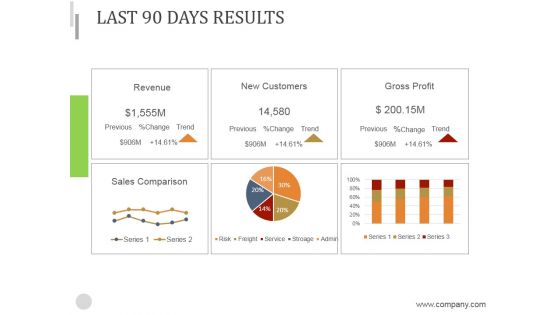
Last 90 Days Results Ppt PowerPoint Presentation Introduction
This is a last 90 days results ppt powerpoint presentation introduction. This is a six stage process. The stages in this process are revenue, new customers, gross profit, sales comparison.
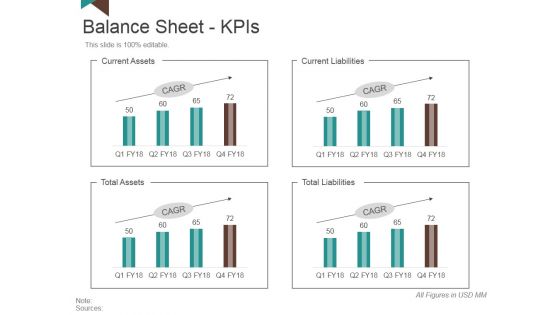
Balance Sheet Kpis Template 3 Ppt PowerPoint Presentation Slides Brochure
This is a balance sheet kpis template 3 ppt powerpoint presentation slides brochure. This is a four stage process. The stages in this process are current assets, current liabilities, total liabilities, total assets.
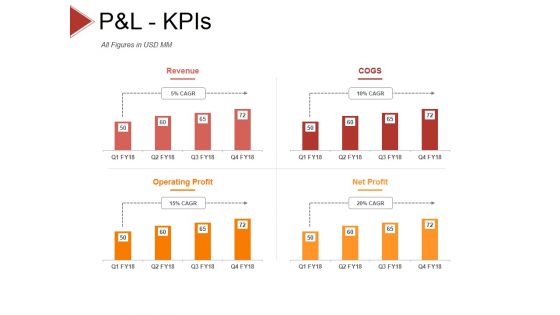
P And L Kpis Template 2 Ppt PowerPoint Presentation Styles Objects
This is a p and l kpis template 2 ppt powerpoint presentation styles objects. This is a four stage process. The stages in this process are revenue, cogs, operating profit, net profit.
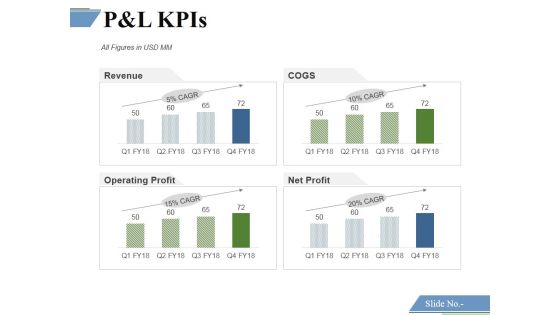
P And L Kpis Template 1 Ppt PowerPoint Presentation Model Inspiration
This is a p and l kpis template 1 ppt powerpoint presentation model inspiration. This is a four stage process. The stages in this process are revenue, cogs, operating profit, net profit.
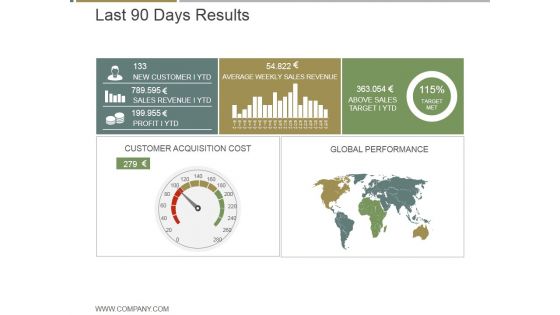
Last 90 Days Results Ppt PowerPoint Presentation Graphics
This is a last 90 days results ppt powerpoint presentation graphics. This is a five stage process. The stages in this process are new customer ytd, average weekly sales revenue, above sales target i ytd, customer acquisition cost, global performance.

How Much Money We Need Ppt PowerPoint Presentation Outline
This is a how much money we need ppt powerpoint presentation outline. This is a three stage process. The stages in this process are business, marketing, management, production, sales.

data collection and analysis control chart ppt powerpoint presentation styles
This is a data collection and analysis control chart ppt powerpoint presentation styles. This is a one stage process. The stages in this process are upper limit, centerline, plotted points, lower limit, point labels.

Product Roadmap Ppt PowerPoint Presentation Inspiration
This is a product roadmap ppt powerpoint presentation inspiration. This is a four stage process. The stages in this process are roadmap, finance, strategy, success, management.

Cash Flow Statement Kpis Tabular Form Ppt PowerPoint Presentation Gallery Good
This is a cash flow statement kpis tabular form ppt powerpoint presentation gallery good. This is a four stage process. The stages in this process are operations, financing activities, investing activities, net increase in cash.
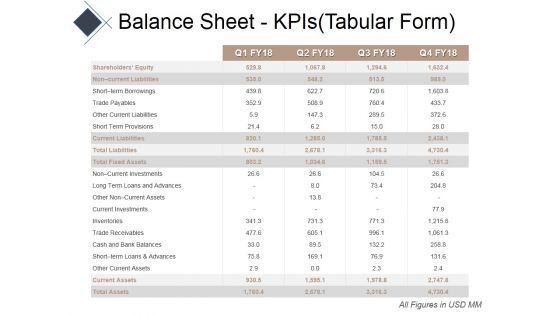
Balance Sheet Kpis Tabular Form Ppt PowerPoint Presentation Show Example Introduction
This is a balance sheet kpis tabular form ppt powerpoint presentation show example introduction. This is a four stage process. The stages in this process are current assets, current liabilities, total assets, total liabilities.
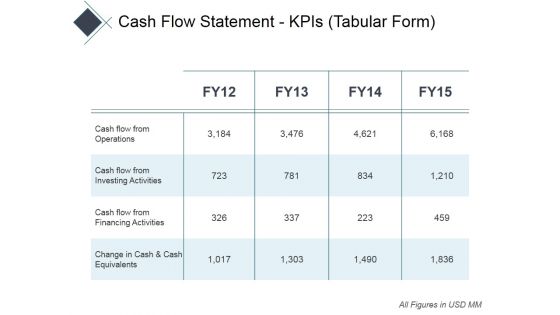
Cash Flow Statement Kpis Tabular Form Ppt PowerPoint Presentation Infographics Professional
This is a cash flow statement kpis tabular form ppt powerpoint presentation infographics professional. This is a four stage process. The stages in this process are operations, financing activities, investing activities, net increase in cash.
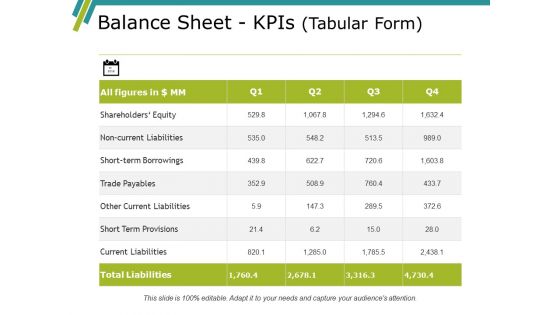
Balance Sheet Kpis Template 1 Ppt PowerPoint Presentation Professional Graphics Download
This is a balance sheet kpis template 1 ppt powerpoint presentation professional graphics download. This is a four stage process. The stages in this process are current assets, current liabilities, total assets, total liabilities.
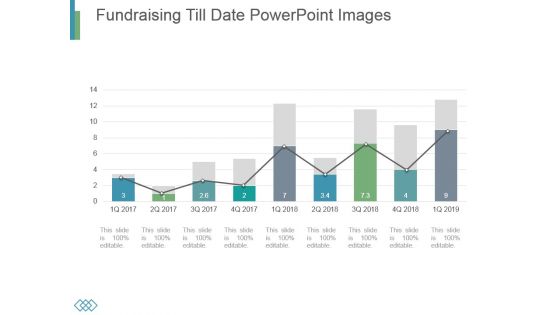
Fundraising Till Date Powerpoint Images
This is a fundraising till date powerpoint images. This is a nine stage process. The stages in this process are business, marketing, growth, timeline, management.
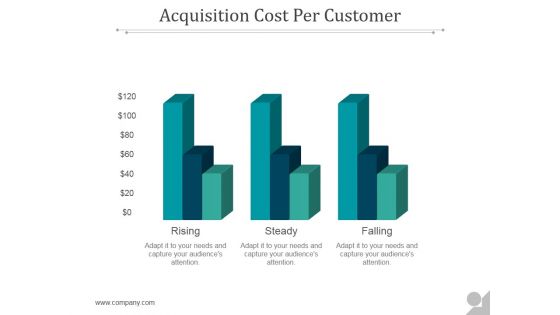
Acquisition Cost Per Customer Ppt PowerPoint Presentation Example 2015
This is a acquisition cost per customer ppt powerpoint presentation example 2015. This is a three stage process. The stages in this process are rising, steady, falling.

Adoption Curve Ppt PowerPoint Presentation Designs
This is a adoption curve ppt powerpoint presentation designs. This is a five stage process. The stages in this process are innovators, early adopters, early majority, late majority, laggards.
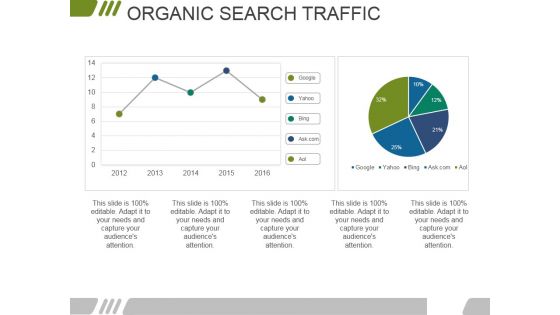
Organic Search Traffic Ppt PowerPoint Presentation Model Slideshow
This is a organic search traffic ppt powerpoint presentation model slideshow. This is a two stage process. The stages in this process are business, marketing, finance, management, organic.
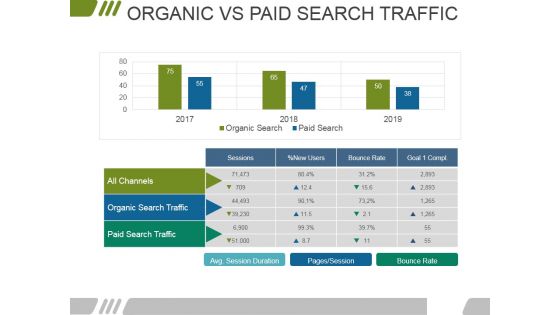
Organic Vs Paid Search Traffic Ppt PowerPoint Presentation Summary Visuals
This is a organic vs paid search traffic ppt powerpoint presentation summary visuals. This is a two stage process. The stages in this process are all channels, organic search traffic, paid search traffic, sessions, bounce rate.
Website Performance Review Template 1 Ppt PowerPoint Presentation Slides Icons
This is a website performance review template 1 ppt powerpoint presentation slides icons. This is a three stage process. The stages in this process are online transaction, conversion rate, traffic source, site consumption time, organic branded.
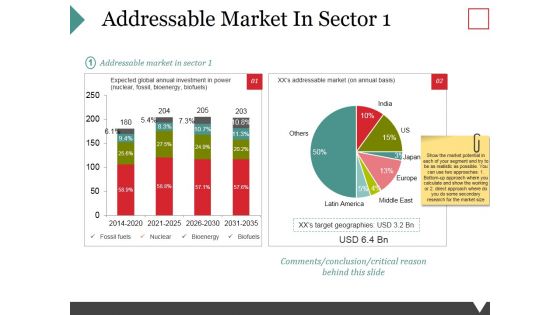
Addressable Market In Sector 1 Ppt PowerPoint Presentation Outline Shapes
This is a addressable market in sector 1 ppt powerpoint presentation outline shapes. This is a two stage process. The stages in this process are fossil fuels, nuclear, bioenergy, biofuels.

Project Work Plan Project Execution Plan Template Ppt PowerPoint Presentation Styles
This is a project work plan project execution plan template ppt powerpoint presentation styles. This is a seven stage process. The stages in this process are project, management, business, marketing, success.

Data Collection And Analysis Control Chart Ppt PowerPoint Presentation Model Backgrounds
This is a data collection and analysis control chart ppt powerpoint presentation model backgrounds. This is a two stage process. The stages in this process are business, marketing, strategy, finance, analysis.

Data Collection Histograms Ppt PowerPoint Presentation Design Templates
This is a data collection histograms ppt powerpoint presentation design templates. This is a five stage process. The stages in this process are histogram, business, marketing, analysis, chart.

Big Data Database Comparison Ppt PowerPoint Presentation Outline
This is a big data database comparison ppt powerpoint presentation outline. This is a four stage process. The stages in this process are business, finance, management, percentage, growth.

 Home
Home