Financial Performance

Company Growth Performance With Revenue Projections Ppt Outline Brochure PDF
This slide Provides the Business evolution performance like units opened, distribution network and net revenue projections. Presenting company growth performance with revenue projections ppt outline brochure pdf to provide visual cues and insights. Share and navigate important information on three stages that need your due attention. This template can be used to pitch topics like units opened, strong distribution network, company growth performance with revenue projections. In addtion, this PPT design contains high resolution images, graphics, etc, that are easily editable and available for immediate download.
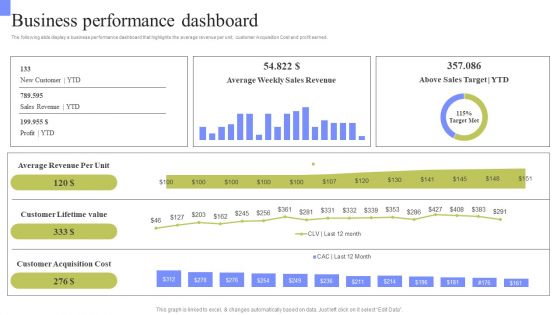
Periodic Revenue Model Business Performance Dashboard Rules PDF
The following slide display a business performance dashboard that highlights the average revenue per unit, customer Acquisition Cost and profit earned. This Periodic Revenue Model Business Performance Dashboard Rules PDF from Slidegeeks makes it easy to present information on your topic with precision. It provides customization options, so you can make changes to the colors, design, graphics, or any other component to create a unique layout. It is also available for immediate download, so you can begin using it right away. Slidegeeks has done good research to ensure that you have everything you need to make your presentation stand out. Make a name out there for a brilliant performance.
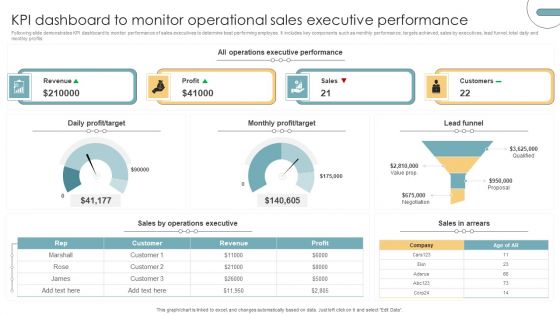
KPI Dashboard To Monitor Operational Sales Executive Performance Portrait PDF
Following slide demonstrates KPI dashboard to monitor performance of sales executives to determine best performing employee. It includes key components such as monthly performance, targets achieved, sales by executives, lead funnel, total daily and monthly profits. Pitch your topic with ease and precision using this KPI Dashboard To Monitor Operational Sales Executive Performance Portrait PDF. This layout presents information on Revenue, Profit, Sales, Customers. It is also available for immediate download and adjustment. So, changes can be made in the color, design, graphics or any other component to create a unique layout.
Optimizing Human Capital Alignment Analyzing Multiple Performance Improvement Icons PDF
This slide provides glimpse about multiple strategies that will help our company to improve workforce performance. It includes virtual coaching, talent handling system, employee feedback system, etc. Presenting this PowerPoint presentation, titled Optimizing Human Capital Alignment Analyzing Multiple Performance Improvement Icons PDF, with topics curated by our researchers after extensive research. This editable presentation is available for immediate download and provides attractive features when used. Download now and captivate your audience. Presenting this Optimizing Human Capital Alignment Analyzing Multiple Performance Improvement Icons PDF. Our researchers have carefully researched and created these slides with all aspects taken into consideration. This is a completely customizable Optimizing Human Capital Alignment Analyzing Multiple Performance Improvement Icons PDF that is available for immediate downloading. Download now and make an impact on your audience. Highlight the attractive features available with our PPTs.

Revenue And Employee Key Performance Indicators Background PDF
The following slide highlights the revenue and staff key performance Indicators illustrating key headings which includes revenue centres, employee vs profitability, billable hours, average rate per hour and profitable employees Deliver an awe inspiring pitch with this creative Revenue And Employee Key Performance Indicators Background PDF bundle. Topics like Revenue Centres, Employee Profitability, Profitable Employee can be discussed with this completely editable template. It is available for immediate download depending on the needs and requirements of the user.
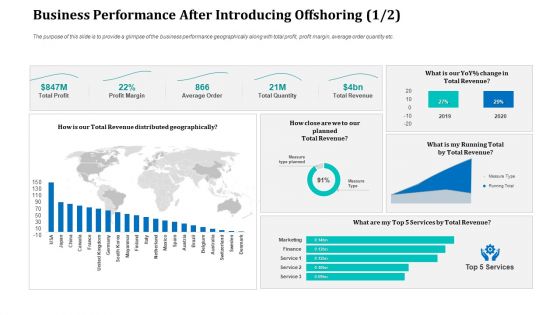
Business Performance After Introducing Offshoring Revenue Microsoft PDF
The purpose of this slide is to provide a glimpse of the business performance geographically along with total profit, profit margin, average order quantity etc. Deliver an awe inspiring pitch with this creative business performance after introducing offshoring revenue microsoft pdf bundle. Topics like planned, revenue, quantity, average can be discussed with this completely editable template. It is available for immediate download depending on the needs and requirements of the user.
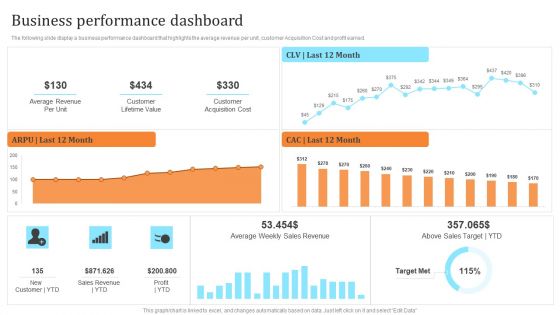
Membership Based Revenue Plan Business Performance Dashboard Ideas PDF
The following slide display a business performance dashboard that highlights the average revenue per unit, customer Acquisition Cost and profit earned. There are so many reasons you need a Membership Based Revenue Plan Business Performance Dashboard Ideas PDF. The first reason is you cant spend time making everything from scratch, Thus, Slidegeeks has made presentation templates for you too. You can easily download these templates from our website easily.

Rebranding Performance Metrics Ppt PowerPoint Presentation Infographics Layout PDF
The purpose of this slide is to provide a glimpse of the rebranding performance metrics.Deliver an awe inspiring pitch with this creative rebranding performance metrics ppt powerpoint presentation infographics layout pdf bundle. Topics like league table top performing, production, sales revenue, website visitors, target can be discussed with this completely editable template. It is available for immediate download depending on the needs and requirements of the user.
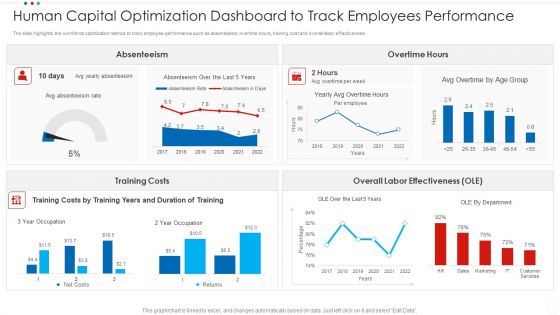
Human Capital Optimization Dashboard To Track Employees Performance Inspiration PDF
The slide highlights the workforce optimization metrics to track employee performance such as absenteeism, overtime hours, training cost and overall labor effectiveness. Pitch your topic with ease and precision using this human capital optimization dashboard to track employees performance inspiration pdf. This layout presents information on training costs, overtime hours, absenteeism. It is also available for immediate download and adjustment. So, changes can be made in the color, design, graphics or any other component to create a unique layout.
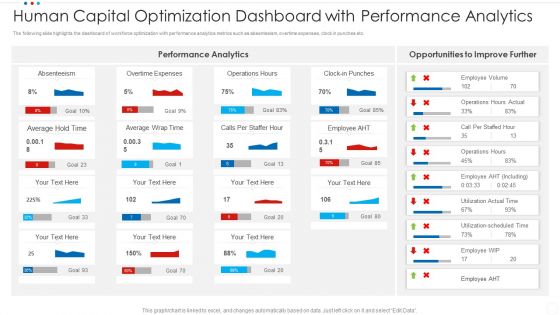
Human Capital Optimization Dashboard With Performance Analytics Infographics PDF
The following slide highlights the dashboard of workforce optimization with performance analytics metrics such as absenteeism, overtime expenses, clock in punches etc. Showcasing this set of slides titled human capital optimization dashboard with performance analytics infographics pdf. The topics addressed in these templates are average, overtime expenses, absenteeism. All the content presented in this PPT design is completely editable. Download it and make adjustments in color, background, font etc. as per your unique business setting.
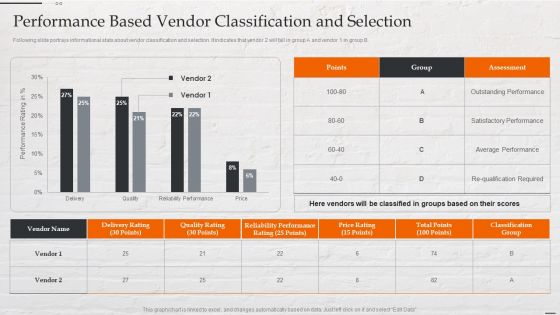
Capital Investment Options Performance Based Vendor Classification Introduction PDF
Following slide portrays informational stats about vendor classification and selection. It indicates that vendor 2 will fall in group A and vendor 1 in group B. Deliver and pitch your topic in the best possible manner with this Capital Investment Options Performance Based Vendor Classification Introduction PDF. Use them to share invaluable insights on Reliability Performance Rating, Quality Rating, Delivery Rating and impress your audience. This template can be altered and modified as per your expectations. So, grab it now.
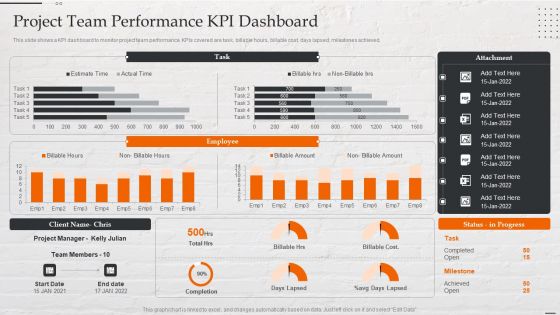
Capital Investment Options Project Team Performance Kpi Dashboard Topics PDF
This slide shows a KPI dashboard to monitor project team performance. KPIs covered are task, billable hours, billable cost, days lapsed, milestones achieved. Deliver and pitch your topic in the best possible manner with this Capital Investment Options Project Team Performance Kpi Dashboard Topics PDF. Use them to share invaluable insights on Team Members, Project Manager, Employee and impress your audience. This template can be altered and modified as per your expectations. So, grab it now.
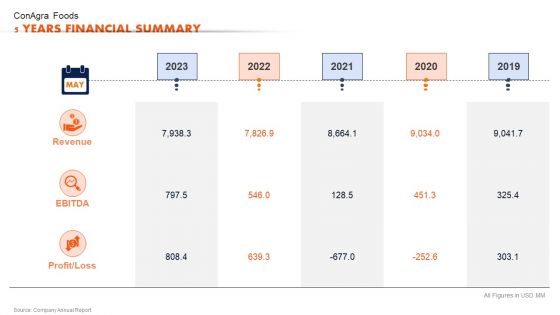
Ready To Eat Food Market Analysis Conagra Foods 5 Years Financial Summary Portrait PDF
From laying roadmaps to briefing everything in detail, our templates are perfect for you. You can set the stage with your presentation slides. All you have to do is download these easy to edit and customizable templates. Ready To Eat Food Market Analysis Conagra Foods 5 Years Financial Summary Portrait PDF will help you deliver an outstanding performance that everyone would remember and praise you for. Do download this presentation today.

Key Functions Of Investment Banks In Financial Understanding Investment Banking Framework Fin SS V
This slide shows a variety of crucial functions within the financial industry which are performed by investment banks to provide assistance to individuals or firms. It includes functions such as advisory services, IPOs, mergers and acquisition, etc. Retrieve professionally designed Key Functions Of Investment Banks In Financial Understanding Investment Banking Framework Fin SS V to effectively convey your message and captivate your listeners. Save time by selecting pre-made slideshows that are appropriate for various topics, from business to educational purposes. These themes come in many different styles, from creative to corporate, and all of them are easily adjustable and can be edited quickly. Access them as PowerPoint templates or as Google Slides themes. You do not have to go on a hunt for the perfect presentation because Slidegeeks got you covered from everywhere.

Impact Analysis Of Vendors Performance Improvement Contd Rules PDF
The following slide showcases impact analysis of vendors performance improvement. It provides information about willingness, top management, relations, information sharing, empathy, operations, monetary assistance, etc. Deliver and pitch your topic in the best possible manner with this Impact Analysis Of Vendors Performance Improvement Contd Rules PDF. Use them to share invaluable insights on Improvement Witnessed, Strategic Assistance Areas Relations and impress your audience. This template can be altered and modified as per your expectations. So, grab it now.
Executive Dashboards For Tracking Key Performance Icons PDF
This slide represents the dashboard for the CEO to track the companys performance. It includes key performance indicators such as no. of deals, open deals, revenue, expected revenue and win percentage. Showcasing this set of slides titled Executive Dashboards For Tracking Key Performance Icons PDF. The topics addressed in these templates are Pen Deals, Revenue, Expected Revenue. All the content presented in this PPT design is completely editable. Download it and make adjustments in color, background, font etc. as per your unique business setting.
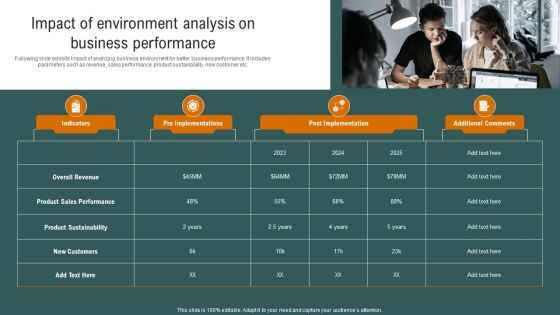
Impact Of Environment Analysis On Business Performance Topics PDF
Developing Significant Business Product And Customer Performance Tracking Clipart PDF
This slide provides information regarding dashboard utilized by firm to monitor performance of products offered and customer associated. The performance is tracked through revenues generated, new customer acquired, customer satisfaction, sales comparison, etc. Deliver and pitch your topic in the best possible manner with this Developing Significant Business Product And Customer Performance Tracking Clipart PDF. Use them to share invaluable insights on Revenue, New Customer, Revenue and impress your audience. This template can be altered and modified as per your expectations. So, grab it now.

Supplier Performance Dashboard With Compensation Status Themes PDF
This slide showcases payment performance dashboard that can help organization to analyze the outstanding amount by different vendors and impose necessary restrictions in case of any delay. Its key components are amount paid early, total money paid, paid on time and paid late. Pitch your topic with ease and precision using this supplier performance dashboard with compensation status themes pdf. This layout presents information on supplier performance dashboard with compensation status. It is also available for immediate download and adjustment. So, changes can be made in the color, design, graphics or any other component to create a unique layout.
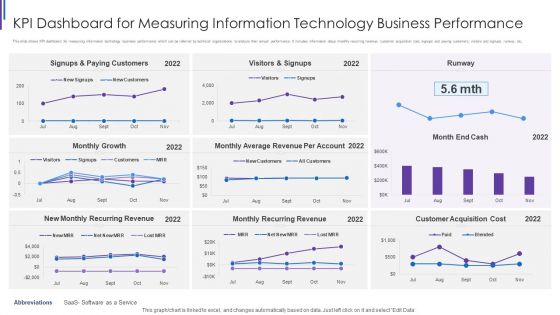
KPI Dashboard For Measuring Information Technology Business Performance Designs PDF
This slide shows KPI dashboard for measuring information technology business performance which can be referred by technical organizations to analyze their annual performance. It includes information about monthly recurring revenue, customer acquisition cost, signups and paying customers, visitors and signups, runway, etc. Showcasing this set of slides titled KPI Dashboard For Measuring Information Technology Business Performance Designs PDF. The topics addressed in these templates are Signups And Paying, Customers Monthly Growth, Visitors And Signups, Monthly Average Revenue. All the content presented in this PPT design is completely editable. Download it and make adjustments in color, background, font etc. as per your unique business setting.
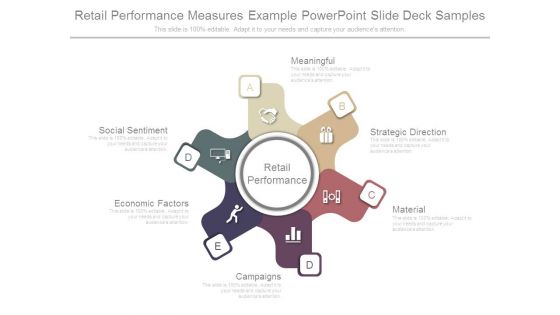
Retail Performance Measures Example Powerpoint Slide Deck Samples
This is a retail performance measures example powerpoint slide deck samples. This is a six stage process. The stages in this process are meaningful, strategic direction, material, campaigns, economic factors, social sentiment.

Performance Measurement KPI Dashboard For Fintech Firm Topics PDF
Following slide portrays performance measurement dashboard for FinTech companies with KPIs namely available cash, cash flow, ROA, working capital ratio, days sales outstanding and days payable outstanding. Create an editable Performance Measurement KPI Dashboard For Fintech Firm Topics PDF that communicates your idea and engages your audience. Whether you are presenting a business or an educational presentation, pre designed presentation templates help save time. Performance Measurement KPI Dashboard For Fintech Firm Topics PDF is highly customizable and very easy to edit, covering many different styles from creative to business presentations. Slidegeeks has creative team members who have crafted amazing templates. So, go and get them without any delay.

Product Feedback Survey With Performance Attributes Microsoft PDF
This slide covers product survey with performance attributes which includes overall quality, value for money, purchase experience, usage experience and post sales experience.Presenting Product Feedback Survey With Performance Attributes Microsoft PDF to dispense important information. This template comprises two stages. It also presents valuable insights into the topics including Purchase Experience, Somewhat Satisfactory, Very Satisfactory This is a completely customizable PowerPoint theme that can be put to use immediately. So, download it and address the topic impactfully.
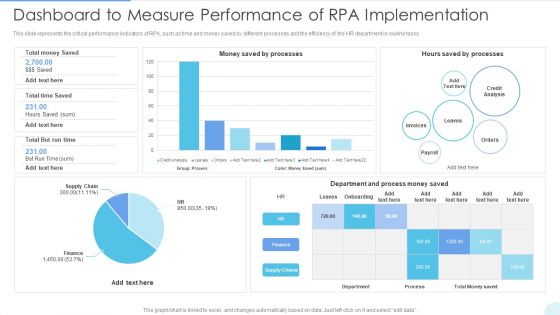
Dashboard To Measure Performance Of RPA Implementation Mockup PDF
This slide represents the critical performance indicators of RPA, such as time and money saved by different processes and the efficiency of the HR department in routine tasks. Deliver and pitch your topic in the best possible manner with this Dashboard To Measure Performance Of RPA Implementation Mockup PDF. Use them to share invaluable insights on Credit Analysis, Department And Process and impress your audience. This template can be altered and modified as per your expectations. So, grab it now.
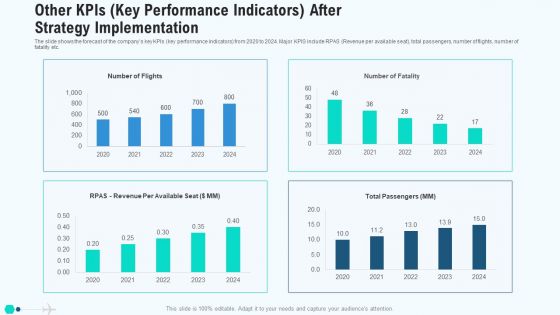
Other Kpis Key Performance Indicators After Strategy Implementation Mockup PDF
The slide shows the forecast of the companys key KPIs key performance indicators from 2020 to 2024. Major KPIS include RPAS Revenue per available seat, total passengers, number of flights, number of fatality etc. Deliver and pitch your topic in the best possible manner with this other kpis key performance indicators after strategy implementation mockup pdf. Use them to share invaluable insights on other kpis key performance indicators after strategy implementation and impress your audience. This template can be altered and modified as per your expectations. So, grab it now.
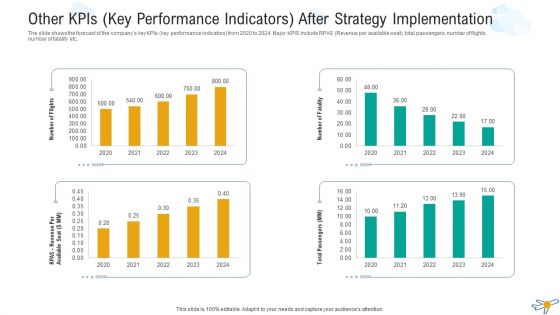
Other Kpis Key Performance Indicators After Strategy Implementation Microsoft PDF
The slide shows the forecast of the companys key KPIs key performance indicators from 2020 to 2024. Major KPIS include RPAS Revenue per available seat, total passengers, number of flights, number of fatality etc. Deliver and pitch your topic in the best possible manner with this other kpis key performance indicators after strategy implementation microsoft pdf. Use them to share invaluable insights on other kpis key performance indicators after strategy implementation and impress your audience. This template can be altered and modified as per your expectations. So, grab it now.
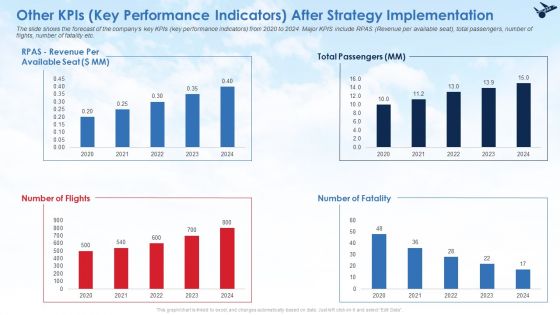
Other Kpis Key Performance Indicators After Strategy Implementation Infographics PDF
The slide shows the forecast of the companys key KPIs key performance indicators from 2020 to 2024. Major KPIS include RPAS Revenue per available seat, total passengers, number of flights, number of fatality etc. Deliver and pitch your topic in the best possible manner with this other kpis key performance indicators after strategy implementation infographics pdf. Use them to share invaluable insights on other kpis key performance indicators after strategy implementation and impress your audience. This template can be altered and modified as per your expectations. So, grab it now.

Marketing Analytics Dashboard To Analyze Ads Campaign Performance Microsoft PDF
The purpose of this slide is to showcase marketing analytics dashboard. Company can analyze the performance of ads campaign through metrics such as total amount spent, total link clicks, conversions, revenue generated etc. Showcasing this set of slides titled Marketing Analytics Dashboard To Analyze Ads Campaign Performance Microsoft PDF. The topics addressed in these templates are Marketing Analytics Dashboard To Analyze Ads Campaign Performance. All the content presented in this PPT design is completely editable. Download it and make adjustments in color, background, font etc. as per your unique business setting.

Ecommerce Operations Management Metrics To Measure Performance Professional PDF
This slide showcases essential metrics of e-commerce to make informed decisions. Major key performance indicators covered are website traffic, shopping cart abandonment rate, revenue per visitor and on time delivery rate. Presenting Ecommerce Operations Management Metrics To Measure Performance Professional PDF to dispense important information. This template comprises one stage. It also presents valuable insights into the topics including Abandonment Rate, Industry Benchmark, Performance. This is a completely customizable PowerPoint theme that can be put to use immediately. So, download it and address the topic impactfully.
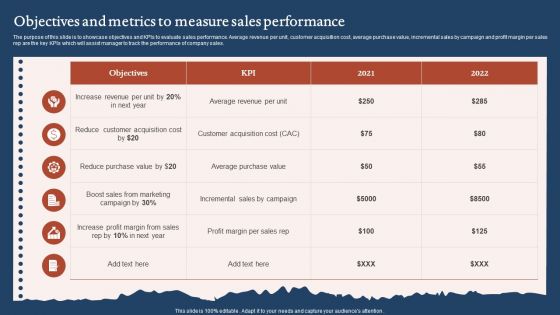
Objectives And Metrics To Measure Sales Performance Sample PDF
The purpose of this slide is to showcase objectives and KPIs to evaluate sales performance. Average revenue per unit, customer acquisition cost, average purchase value, incremental sales by campaign and profit margin per sales rep are the key KPIs which will assist manager to track the performance of company sales. Showcasing this set of slides titled Objectives And Metrics To Measure Sales Performance Sample PDF. The topics addressed in these templates are Reduce Purchase Value, Increase Profit Margin, Customer Acquisition Cost. All the content presented in this PPT design is completely editable. Download it and make adjustments in color, background, font etc. as per your unique business setting.

Business Review With Kpis Purpose And Current Performance Inspiration PDF
The following slide shows key performance indicators measured by firms to review the performance of organization. It KPIs includes customer conversion rate, client retention rate, profit margin and revenue growth. Showcasing this set of slides titled Business Review With Kpis Purpose And Current Performance Inspiration PDF. The topics addressed in these templates are Customer Conversion Rate, Client Retention Rate, Profit Margin. All the content presented in this PPT design is completely editable. Download it and make adjustments in color, background, font etc. as per your unique business setting.
Software Tool Leading And Lagging Performance Tracking Indicators Diagrams PDF
This slide showcase the lagging and leading performance indicators after the implementation of a software tool. It includes customer integration data, email campaign revenue generated,session time, email deliverability, email click rates etc. Persuade your audience using this Software Tool Leading And Lagging Performance Tracking Indicators Diagrams PDF. This PPT design covers Two stages, thus making it a great tool to use. It also caters to a variety of topics including Software Tool Leading, Lagging Performance, Tracking Indicators. Download this PPT design now to present a convincing pitch that not only emphasizes the topic but also showcases your presentation skills.
Product Management Team Performance Tracking KPI Dashboard Pictures PDF
This slide provides performance tracking dashboard for product development project team. It provides information regarding hours spent on project, deadlines, employee responsible, new leads and revenue generated. Pitch your topic with ease and precision using this Product Management Team Performance Tracking KPI Dashboard Pictures PDF. This layout presents information on Tracking KPI Dashboard, Product Management Team Performance. It is also available for immediate download and adjustment. So, changes can be made in the color, design, graphics or any other component to create a unique layout.

Organizations Key Performance Indicators To Measure Progress One Pager Documents
This one page covers about key performance indicators to measure progress through various KPIs that includes revenue growth, comparable sales growth and adjusted operating profit growth. Presenting you a fantastic Organizations Key Performance Indicators To Measure Progress One Pager Documents. This piece is crafted on hours of research and professional design efforts to ensure you have the best resource. It is completely editable and its design allow you to rehash its elements to suit your needs. Get this Organizations Key Performance Indicators To Measure Progress One Pager Documents A4 One-pager now.
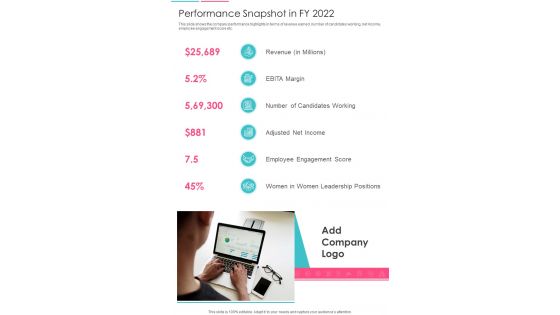
Performance Snapshot In FY 2022 One Pager Documents
This slide shows the company performance highlights in terms of revenue earned, number of candidates working, net income, employee engagement score etc. Presenting you an exemplary Performance Snapshot In FY 2022 One Pager Documents. Our one-pager comprises all the must-have essentials of an inclusive document. You can edit it with ease, as its layout is completely editable. With such freedom, you can tweak its design and other elements to your requirements. Download this Performance Snapshot In FY 2022 One Pager Documents brilliant piece now.
Optimize Brand Valuation Product Branding Performance Tracking Dashboard Background PDF
This slide provides information regarding product branding performance tracking dashboard in terms of revenues, new customers, customer satisfaction rate. Create an editable Optimize Brand Valuation Product Branding Performance Tracking Dashboard Background PDF that communicates your idea and engages your audience. Whether you are presenting a business or an educational presentation, pre-designed presentation templates help save time. Optimize Brand Valuation Product Branding Performance Tracking Dashboard Background PDF is highly customizable and very easy to edit, covering many different styles from creative to business presentations. Slidegeeks has creative team members who have crafted amazing templates. So, go and get them without any delay.
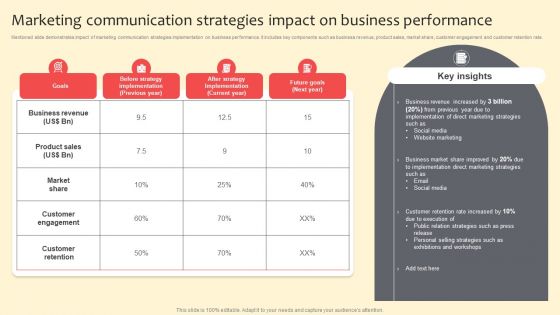
Marketing Communication Strategies Impact On Business Performance Download PDF
Mentioned slide demonstrates impact of marketing communication strategies implementation on business performance. It includes key components such as business revenue, product sales, market share, customer engagement and customer retention rate. From laying roadmaps to briefing everything in detail, our templates are perfect for you. You can set the stage with your presentation slides. All you have to do is download these easy to edit and customizable templates. Marketing Communication Strategies Impact On Business Performance Download PDF will help you deliver an outstanding performance that everyone would remember and praise you for. Do download this presentation today.

Consumption Based Pricing Model Business Performance Dashboard Demonstration PDF
The following slide display a business performance dashboard that highlights the average revenue per unit, customer acquisition cost and profit earned. Crafting an eye catching presentation has never been more straightforward. Let your presentation shine with this tasteful yet straightforward Consumption Based Pricing Model Business Performance Dashboard Demonstration PDF template. It offers a minimalistic and classy look that is great for making a statement. The colors have been employed intelligently to add a bit of playfulness while still remaining professional. Construct the ideal Consumption Based Pricing Model Business Performance Dashboard Demonstration PDF that effortlessly grabs the attention of your audience. Begin now and be certain to wow your customers.

Recurring Income Generation Model Business Performance Dashboard Clipart PDF
The following slide display a business performance dashboard that highlights the average revenue per unit, customer Acquisition Cost and profit earned. Crafting an eye catching presentation has never been more straightforward. Let your presentation shine with this tasteful yet straightforward Recurring Income Generation Model Business Performance Dashboard Clipart PDF template. It offers a minimalistic and classy look that is great for making a statement. The colors have been employed intelligently to add a bit of playfulness while still remaining professional. Construct the ideal Recurring Income Generation Model Business Performance Dashboard Clipart PDF that effortlessly grabs the attention of your audience. Begin now and be certain to wow your customers.

Overview Of Organizational Current Performance Issues Demonstration PDF
The following slide covers graph depicting current employee performance issues in the company to analyze improvement opportunities. It mainly includes elements such as productivity rate, sales revenue growth, work quality, staff morale, hiring cost etc. From laying roadmaps to briefing everything in detail, our templates are perfect for you. You can set the stage with your presentation slides. All you have to do is download these easy to edit and customizable templates. Overview Of Organizational Current Performance Issues Demonstration PDF will help you deliver an outstanding performance that everyone would remember and praise you for. Do download this presentation today.
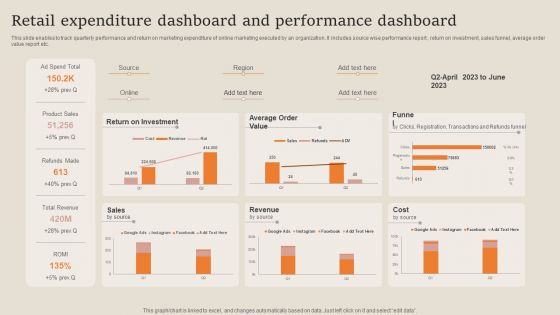
Retail Expenditure Dashboard And Performance Dashboard Formats PDF
This slide enables to track quarterly performance and return on marketing expenditure of online marketing executed by an organization. It includes source wise performance report , return on investment, sales funnel, average order value report etc. Pitch your topic with ease and precision using this Retail Expenditure Dashboard And Performance Dashboard Formats PDF. This layout presents information on Return On Investment, Product Sales, Revenue. It is also available for immediate download and adjustment. So, changes can be made in the color, design, graphics or any other component to create a unique layout.
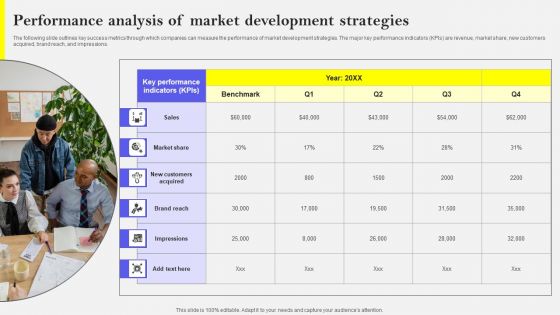
Performance Analysis Of Market Development Strategies Information PDF
The following slide outlines key success metrics through which companies can measure the performance of market development strategies. The major key performance indicators KPIs are revenue, market share, new customers acquired, brand reach, and impressions. Find a pre-designed and impeccable Performance Analysis Of Market Development Strategies Information PDF. The templates can ace your presentation without additional effort. You can download these easy-to-edit presentation templates to make your presentation stand out from others. So, what are you waiting for Download the template from Slidegeeks today and give a unique touch to your presentation.
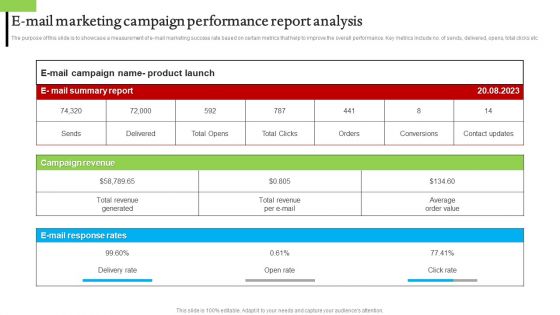
E Mail Marketing Campaign Performance Report Analysis Designs PDF
The purpose of this slide is to showcase a measurement of e-mail marketing success rate based on certain metrics that help to improve the overall performance. Key metrics include no. of sends, delivered, opens, total clicks etc. Pitch your topic with ease and precision using this E Mail Marketing Campaign Performance Report Analysis Designs PDF. This layout presents information on Campaign Revenue, Product Launch, Performance Report Analysis. It is also available for immediate download and adjustment. So, changes can be made in the color, design, graphics or any other component to create a unique layout.
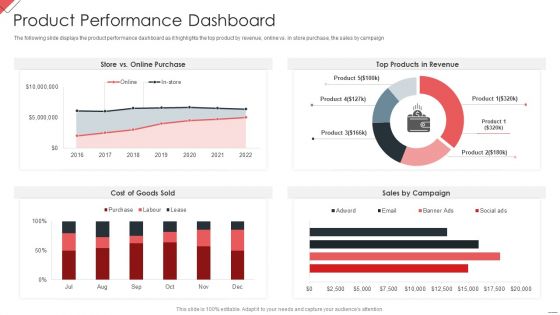
New Commodity Market Viability Review Product Performance Dashboard Infographics PDF
The following slide displays the product performance dashboard as it highlights the top product by revenue, online vs. in store purchase, the sales by campaign Deliver an awe inspiring pitch with this creative New Commodity Market Viability Review Product Performance Dashboard Infographics PDF bundle. Topics like Online Purchase, Products Revenue, Sales Campaign can be discussed with this completely editable template. It is available for immediate download depending on the needs and requirements of the user.

Measuring Content Marketing Performance Ppt PowerPoint Presentation Design Ideas
This is a measuring content marketing performance ppt powerpoint presentation design ideas. This is a eight stage process. The stages in this process are conversion rate, quality of leads, website traffic, number of leads, sales revenue, subscriber list growth.
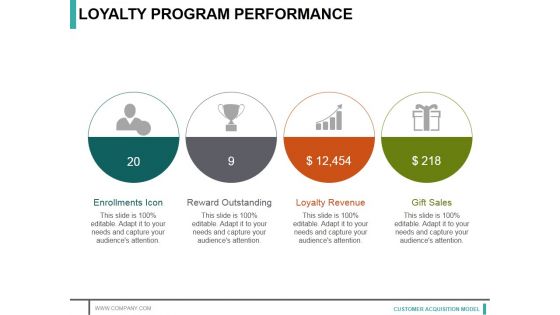
Loyalty Program Performance Ppt PowerPoint Presentation Styles Example
This is a loyalty program performance ppt powerpoint presentation styles example. This is a four stage process. The stages in this process are enrollments icon, reward outstanding, loyalty revenue, gift sales.

Sales Performance Dashboard Ppt PowerPoint Presentation Gallery Background
This is a sales performance dashboard ppt powerpoint presentation gallery backgroun. This is a six stage process. The stages in this process are sales comparison, sales by product category, rankings, revenue, new customers.
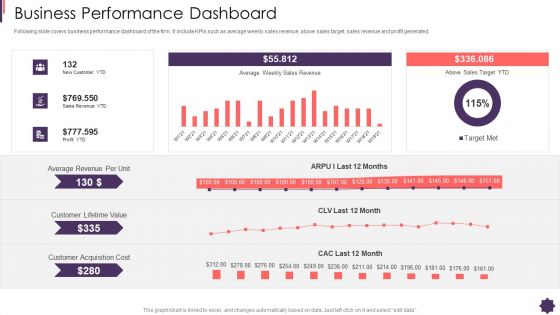
Business Performance Dashboard Brand Techniques Structure Introduction PDF
Following slide covers business performance dashboard of the firm. It include KPIs such as average weekly sales revenue, above sales target, sales revenue and profit generated. Deliver an awe inspiring pitch with this creative business performance dashboard brand techniques structure introduction pdf bundle. Topics like average, revenue, sales, profit, cost can be discussed with this completely editable template. It is available for immediate download depending on the needs and requirements of the user.
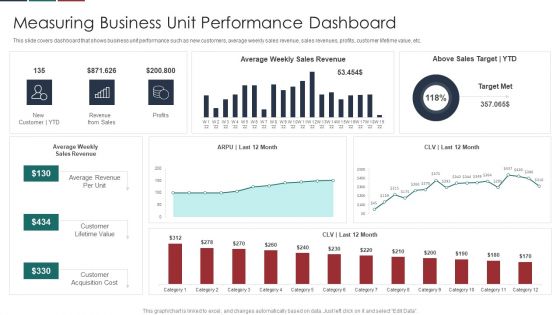
Deliver Efficiency Innovation Measuring Business Unit Performance Dashboard Background PDF
This slide covers dashboard that shows business unit performance such as new customers, average weekly sales revenue, sales revenues, profits, customer lifetime value, etc. Deliver an awe inspiring pitch with this creative Deliver Efficiency Innovation Measuring Business Unit Performance Dashboard Background PDF bundle. Topics like Customer Lifetime Value, Customer Acquisition Cost, Average Revenue Per Unit, Above Sales Target YTD can be discussed with this completely editable template. It is available for immediate download depending on the needs and requirements of the user.

Opportunity Analysis Dashboard Indicating Business Performance Information Rules PDF
This slide shows opportunity analysis dashboard indicating market performance which contains opportunity count by size, sales stage, region, revenue and average revenue. Pitch your topic with ease and precision using this Opportunity Analysis Dashboard Indicating Business Performance Information Rules PDF. This layout presents information on Opportunity Count, Revenue, Sales. It is also available for immediate download and adjustment. So, changes can be made in the color, design, graphics or any other component to create a unique layout.

Performance Strategic Analysis Dashboard For Tactical Management Rules PDF
This slide defines the dashboard for analyzing the sales key performance indicators KPIs. It includes information related to the number of sales, revenue, profit, and cost. Showcasing this set of slides titled Performance Strategic Analysis Dashboard For Tactical Management Rules PDF. The topics addressed in these templates are Revenue, New Customers, Average Revenue, Per Customer. All the content presented in this PPT design is completely editable. Download it and make adjustments in color, background, font etc. as per your unique business setting.
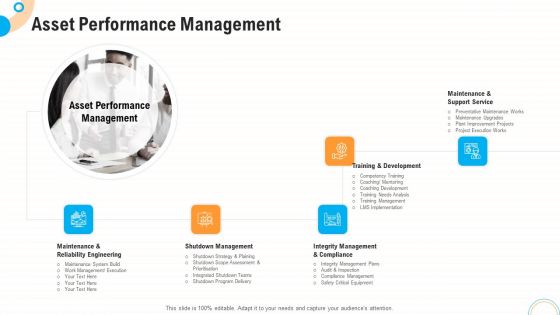
Fiscal And Operational Assessment Asset Performance Management Brochure PDF
Presenting fiscal and operational assessment asset performance management brochure pdf to provide visual cues and insights. Share and navigate important information on five stages that need your due attention. This template can be used to pitch topics like training and development, shutdown management, maintenance and reliability engineering. In addtion, this PPT design contains high resolution images, graphics, etc, that are easily editable and available for immediate download.
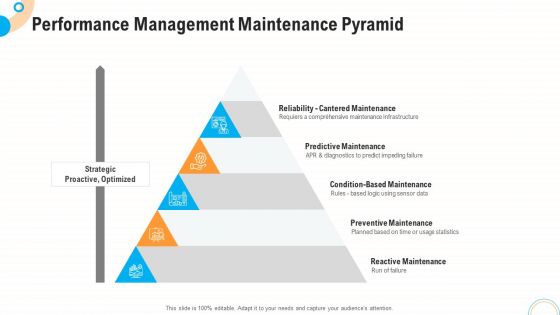
Fiscal And Operational Assessment Performance Management Maintenance Pyramid Infographics PDF
Presenting fiscal and operational assessment performance management maintenance pyramid infographics pdf to provide visual cues and insights. Share and navigate important information on five stages that need your due attention. This template can be used to pitch topics like predictive maintenance, condition based maintenance, preventive maintenance. In addtion, this PPT design contains high resolution images, graphics, etc, that are easily editable and available for immediate download.

Funding Pitch Deck Our Investment Performance Ppt Ideas Slides PDF
This slide provides the glimpse about our investment performance which covers distribution to paid in, total value to invested capital and cash returned. Deliver an awe inspiring pitch with this creative funding pitch deck our investment performance ppt ideas slides pdf bundle. Topics like invested capital, distribution, cash returned can be discussed with this completely editable template. It is available for immediate download depending on the needs and requirements of the user.

Business Performance After Introducing Offshoring Sales Background PDF
The purpose of this slide is to provide a glimpse of the business performance which includes revenue, gross profit, new customers, and satisfaction level etc. Deliver and pitch your topic in the best possible manner with this business performance after introducing offshoring sales background pdf. Use them to share invaluable insights on sales, gross profit, customers, revenue and impress your audience. This template can be altered and modified as per your expectations. So, grab it now.

Competitive Analysis By Key Performance Indicators 2020 Designs PDF
The slide shows the comparison of major KPIs key performance indicators of the company with its competitors. Major KPIs include Revenue, net profit, number of flights, number of passengers, number of pilots etc.Deliver an awe-inspiring pitch with this creative competitive analysis by key performance indicators 2020 designs pdf. bundle. Topics like net profits, revenue, number of passengers can be discussed with this completely editable template. It is available for immediate download depending on the needs and requirements of the user.

Co Variety Advertisement Partners Performance Assessment Dashboard Introduction PDF
This slide provides information regarding the dashboard for partners performance assessment in terms of revenue generated, etc. Presenting co variety advertisement partners performance assessment dashboard introduction pdf to provide visual cues and insights. Share and navigate important information on three stages that need your due attention. This template can be used to pitch topics like revenue generated, marketing progress, plan. In addition, this PPT design contains high-resolution images, graphics, etc, that are easily editable and available for immediate download.
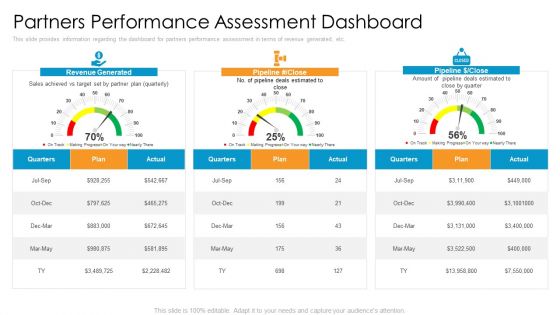
Partner Advertisement Strategy Partners Performance Assessment Dashboard Diagrams PDF
This slide provides information regarding the dashboard for partners performance assessment in terms of revenue generated, etc. Deliver and pitch your topic in the best possible manner with this partner advertisement strategy partners performance assessment dashboard diagrams pdf. Use them to share invaluable insights on revenue generated, sales, target and impress your audience. This template can be altered and modified as per your expectations. So, grab it now.
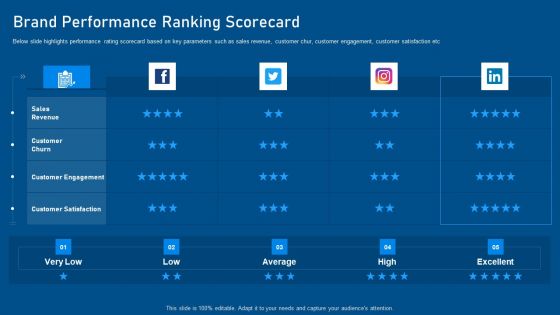
Business Promotion Using Linkedin Brand Performance Ranking Scorecard Ideas PDF
Below slide highlights performance rating scorecard based on key parameters such as sales revenue, customer chur, customer engagement, customer satisfaction etc Deliver an awe inspiring pitch with this creative business promotion using linkedin brand performance ranking scorecard ideas pdf bundle. Topics like sales, revenue, average can be discussed with this completely editable template. It is available for immediate download depending on the needs and requirements of the user.

Competitive Analysis By Key Performance Indicators 2020 Professional PDF
The slide shows the comparison of major KPIs key performance indicators of the company with its competitors. Major KPIs include Revenue, net profit, number of flights, number of passengers, number of pilots etc. Deliver an awe inspiring pitch with this creative competitive analysis by key performance indicators 2020 professional pdf bundle. Topics like revenue, net profits can be discussed with this completely editable template. It is available for immediate download depending on the needs and requirements of the user.

 Home
Home