Financial Graphs
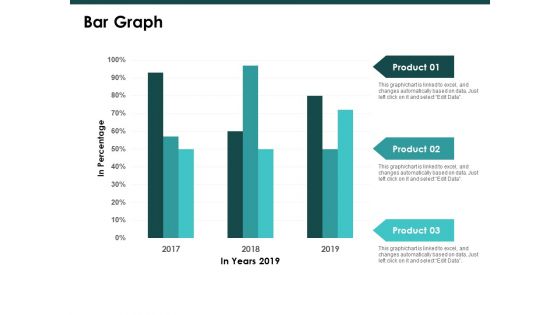
Bar Graph Finance Ppt PowerPoint Presentation Styles Slide
This is a bar graph finance ppt powerpoint presentation styles slide. This is a three stage process. The stages in this process are finance, marketing, management, investment, analysis.

Combo Chart Graph Ppt PowerPoint Presentation Inspiration Template
This is a combo chart graph ppt powerpoint presentation inspiration template. This is a three stage process. The stages in this process are finance, marketing, management, investment, analysis.

Combo Chart Graph Ppt PowerPoint Presentation Infographics Guide
This is a combo chart graph ppt powerpoint presentation infographics guide. This is a two stage process. The stages in this process are marketing, business, management, planning, strategy.
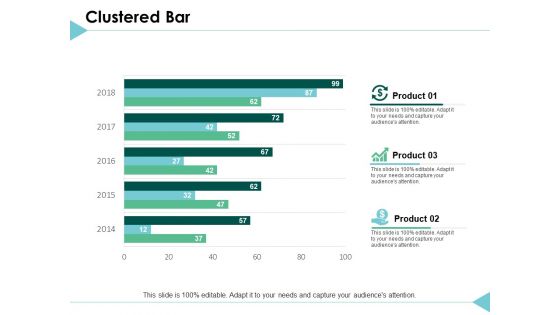
Clustered Bar Graph Ppt PowerPoint Presentation Outline Layouts
This is a clustered bar graph ppt powerpoint presentation outline layouts. This is a three stage process. The stages in this process are finance, marketing, analysis, investment, million.

Stacked Bar Graph Ppt PowerPoint Presentation Inspiration Images
This is a stacked bar graph ppt powerpoint presentation inspiration images. This is a three stage process. The stages in this process are finance, marketing, analysis, investment, million.

Clustered Chart Graph Ppt PowerPoint Presentation Gallery Backgrounds
This is a clustered chart graph ppt powerpoint presentation gallery backgrounds. This is a three stage process. The stages in this process are finance, marketing, analysis, investment, million.

Combo Chart Graph Ppt PowerPoint Presentation Professional Guidelines
This is a combo chart graph ppt powerpoint presentation professional guidelines. This is a three stage process. The stages in this process are finance, marketing, analysis, investment, million.
Gross Revenue Margin Comparison Graph Icon Clipart PDF
Persuade your audience using this Gross Revenue Margin Comparison Graph Icon Clipart PDF. This PPT design covers three stages, thus making it a great tool to use. It also caters to a variety of topics including Gross Revenue Margin, Comparison Graph Icon. Download this PPT design now to present a convincing pitch that not only emphasizes the topic but also showcases your presentation skills.
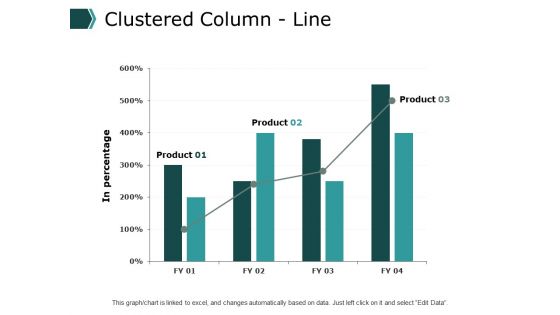
Clustered Column Line Graph Ppt PowerPoint Presentation Ideas Demonstration
This is a clustered column line graph ppt powerpoint presentation ideas demonstration. This is a three stage process. The stages in this process are financial, minimum, maximum, marketing, strategy.
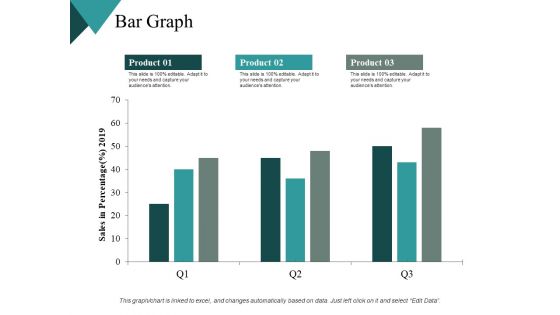
Bar Graph Finance Ppt PowerPoint Presentation Outline Background Designs
This is a bar graph finance ppt powerpoint presentation outline background designs. This is a three stage process. The stages in this process are financial, maximum, medium, minimum, marketing.

Graph Showing Sales Performance Figures Ppt PowerPoint Presentation Infographics Topics
Presenting this set of slides with name graph showing sales performance figures ppt powerpoint presentation infographics topics. This is a six stage process. The stages in this process are people graph, sales performance, population data demographics. This is a completely editable PowerPoint presentation and is available for immediate download. Download now and impress your audience.
Curved Graph Vector Icon Ppt PowerPoint Presentation Slides Themes PDF
Presenting this set of slides with name curved graph vector icon ppt powerpoint presentation slides themes pdf. This is a one stage process. The stage in this process is curved graph vector icon. This is a completely editable PowerPoint presentation and is available for immediate download. Download now and impress your audience.
Icon Of BCWP Graph For Project Management Topics PDF
Persuade your audience using this Icon Of BCWP Graph For Project Management Topics PDF This PPT design covers one stage, thus making it a great tool to use. It also caters to a variety of topics including Icon BCWP, Graph Project, Management Download this PPT design now to present a convincing pitch that not only emphasizes the topic but also showcases your presentation skills.
Doughnut Graph Icon Highlighting IT Team Structure Structure PDF
Presenting Doughnut Graph Icon Highlighting IT Team Structure Structure PDF to dispense important information. This template comprises four stages. It also presents valuable insights into the topics including Doughnut Graph, Icon Highlighting, IT Team Structure. This is a completely customizable PowerPoint theme that can be put to use immediately. So, download it and address the topic impactfully.
Doughnut Graph Icon With Dollar Symbol Topics PDF
Persuade your audience using this Doughnut Graph Icon With Dollar Symbol Topics PDF. This PPT design covers four stages, thus making it a great tool to use. It also caters to a variety of topics including Doughnut Graph, Icon, Dollar Symbol. Download this PPT design now to present a convincing pitch that not only emphasizes the topic but also showcases your presentation skills.

Bar Graph For Business Growth Steps Powerpoint Slides
This PowerPoint template contains design of bar graph with icons. You may download this slide to display strategy steps for business growth. You can easily customize this template to make it more unique as per your need.

Bar Graph With Line Chart For Analysis Powerpoint Slides
This PowerPoint template contains design of bar graph with line chart. You may download this slide to display strategy steps for business growth. You can easily customize this template to make it more unique as per your need.

Bar Graph With Yearly Statistical Analysis Powerpoint Slides
This PowerPoint template contains diagram of bar graph with yearly percentage ratios. You may download this slide to display statistical analysis. You can easily customize this template to make it more unique as per your need.

Project Performance Bar Graph Ppt PowerPoint Presentation Outline
This is a project performance bar graph ppt powerpoint presentation outline. This is a four stage process. The stages in this process are finance, year, business, marketing, future, marketing.
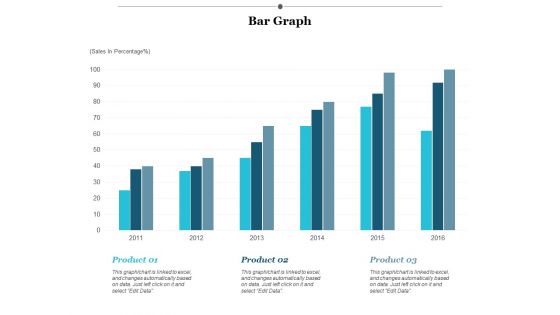
Bar Graph Finance Ppt PowerPoint Presentation Infographics Designs Download
This is a bar graph finance ppt powerpoint presentation infographics designs download. This is a three stage process. The stages in this process are finance, marketing, management, investment, analysis.
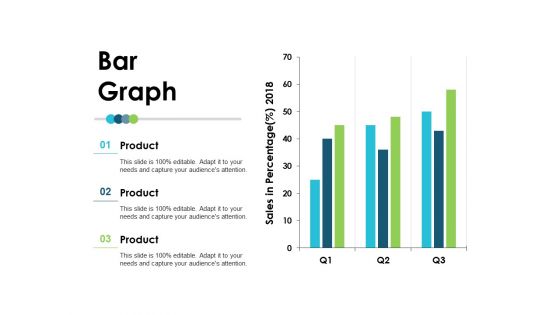
Bar Graph Employee Value Proposition Ppt PowerPoint Presentation File Layout
This is a bar graph employee value proposition ppt powerpoint presentation file layout. This is a three stage process. The stages in this process are business, management, strategy, analysis, marketing.
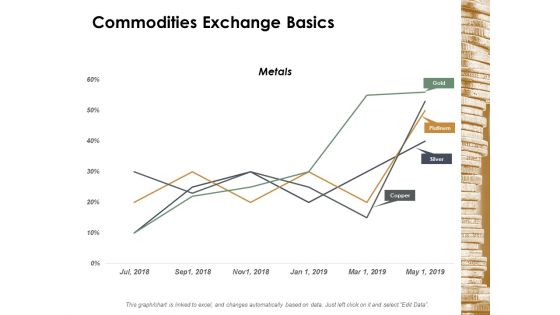
Commodities Exchange Basics Ppt Powerpoint Presentation Diagram Graph Charts
This is a commodities exchange basics ppt powerpoint presentation diagram graph charts. This is a four stage process. The stages in this process are finance, marketing, management, investment, analysis.
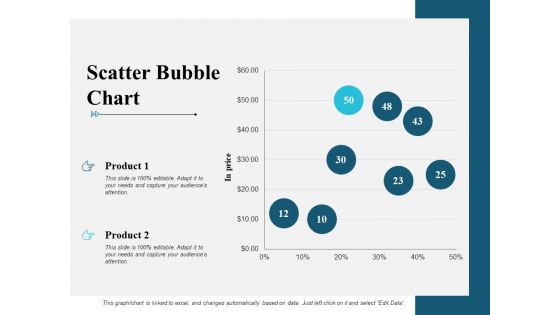
Scatter Bubble Chart Graph Ppt PowerPoint Presentation Infographic Template Maker
This is a scatter bubble chart graph ppt powerpoint presentation infographic template maker. This is a two stage process. The stages in this process are finance, marketing, management, investment, analysis.

Donut Pie Chart Graph Ppt PowerPoint Presentation File Styles
This is a donut pie chart graph ppt powerpoint presentation file styles. This is a three stage process. The stages in this process are finance, marketing, management, investment, analysis.

Stacked Bar Graph Ppt PowerPoint Presentation Portfolio Slide Portrait
This is a stacked bar graph ppt powerpoint presentation portfolio slide portrait. This is a three stage process. The stages in this process are finance, marketing, management, investment, analysis.
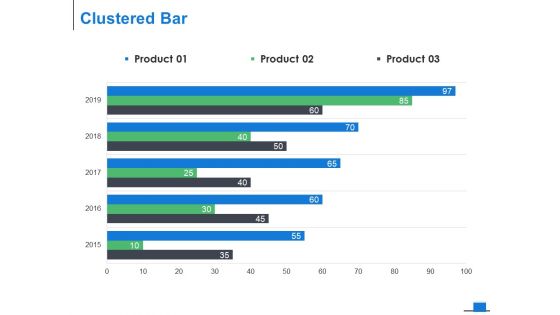
Clustered Bar Graph Ppt PowerPoint Presentation Model Background Designs
This is a clustered bar graph ppt powerpoint presentation model background designs. This is a three stage process. The stages in this process are finance, marketing, management, investment, analysis.
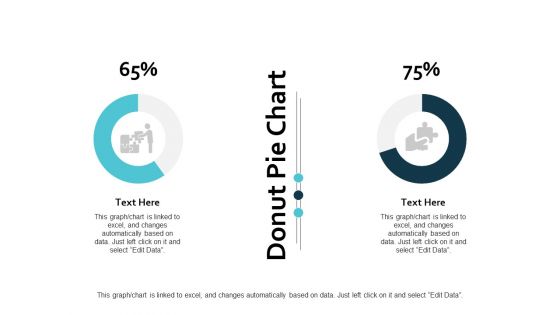
Donut Pie Chart Graph Ppt PowerPoint Presentation Ideas Guidelines
This is a donut pie chart graph ppt powerpoint presentation ideas guidelines. This is a three stage process. The stages in this process are finance, marketing, management, investment, analysis.
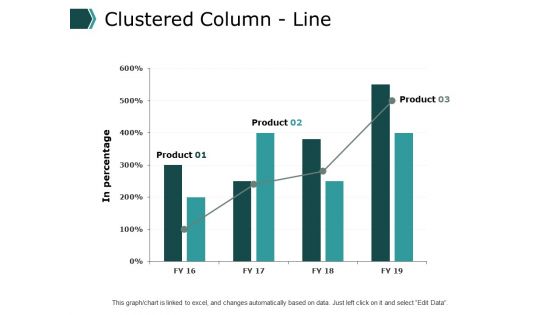
Clustered Column Line Graph Ppt PowerPoint Presentation File Clipart
This is a clustered column line graph ppt powerpoint presentation file clipart. This is a three stage process. The stages in this process are finance, marketing, management, investment, analysis.
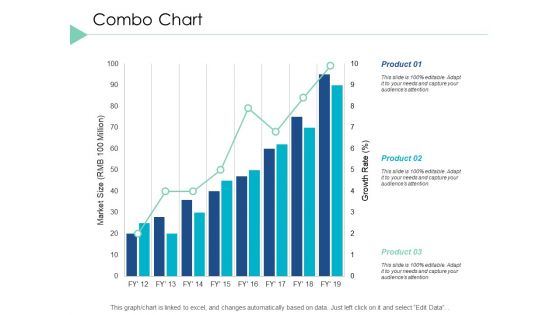
Combo Chart Graph Ppt PowerPoint Presentation Infographic Template Layout Ideas
This is a combo chart graph ppt powerpoint presentation infographic template layout ideas. This is a three stage process. The stages in this process are finance, marketing, analysis, investment, million.

Clustered Column Line Graph Ppt PowerPoint Presentation Inspiration Deck
This is a clustered column line graph ppt powerpoint presentation inspiration deck. This is a three stage process. The stages in this process are finance, marketing, analysis, investment, million.
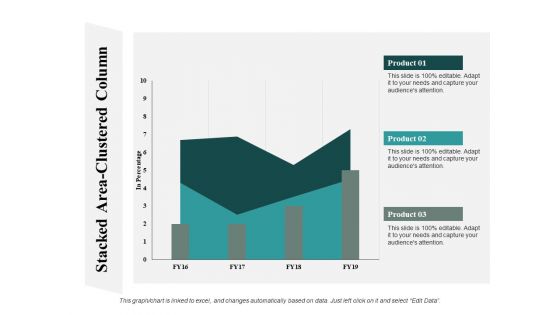
Stacked Area Clustered Column Graph Ppt PowerPoint Presentation Summary Guide
This is a stacked area clustered column graph ppt powerpoint presentation summary guide. This is a three stage process. The stages in this process are finance, marketing, analysis, investment, million.
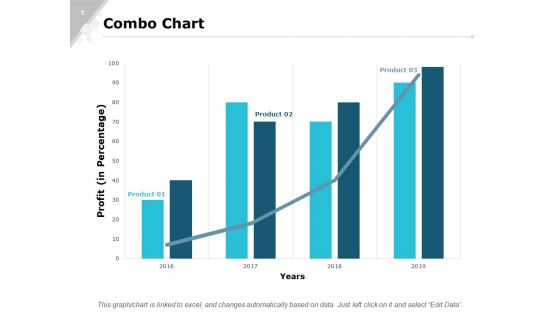
Combo Chart Graph Ppt PowerPoint Presentation Gallery Designs Download
This is a combo chart graph ppt powerpoint presentation gallery designs download. This is a three stage process. The stages in this process are finance, marketing, analysis, investment, million.

Area Chart Graph Ppt PowerPoint Presentation Professional Format Ideas
This is a column chart graph ppt powerpoint presentation slides file formats. This is a stage three process. The stages in this process are finance, marketing, analysis, investment, million.

Graph Showing Sales Number With Search Symbol Professional PDF
Persuade your audience using this Graph Showing Sales Number With Search Symbol Professional PDF. This PPT design covers three stages, thus making it a great tool to use. It also caters to a variety of topics including Graph Showing Sales Number With Search Symbol. Download this PPT design now to present a convincing pitch that not only emphasizes the topic but also showcases your presentation skills.

Growth Arrow On Bar Graph Infographics Powerpoint Template
This PowerPoint template has been designed with growth arrow on bar graph. You may download this diagram slide to display growth and progress concepts. Illustrate your plans to your listeners with this impressive template.
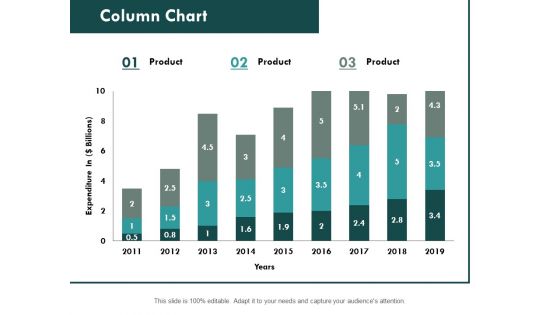
Column Chart Graph Ppt PowerPoint Presentation Slides File Formats
This is a combo chart bar ppt powerpoint presentation slides portfolio. This is a three stage process. The stages in this process are finance, marketing, analysis, investment, million.
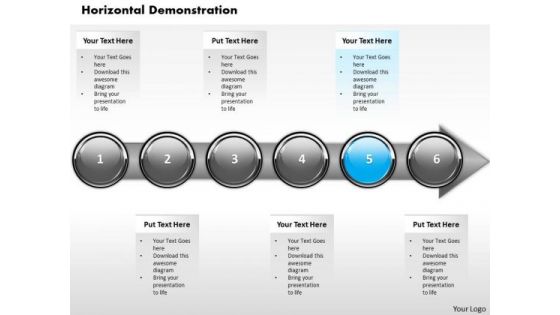
Ppt Consistent Demonstration Of Financial Process Using Stage 5 PowerPoint Templates
PPT consistent demonstration of financial process using stage 5 PowerPoint Templates-Highlight the key components of your entire financial process. Illustrate how each element flows seamlessly onto the next stage.-PPT consistent demonstration of financial process using stage 5 PowerPoint Templates-Abstract, Achievement, Aim, Arrow, Background, Business, Chart, Communication, Company, Competition, Concept, Design, Development, Diagram, Direction, Finance, Financial, Forecast, Forward, Goal, Graph, Graphic, Growth, Icon, Illustration, Increase, Investment, Leader, Leadership, Marketing, Motion, Moving, Orange, Path, Price, Process, Profit, Progress, Shape, Sign, Success, Symbol, Target, Team, Teamwork, Up, Upwards
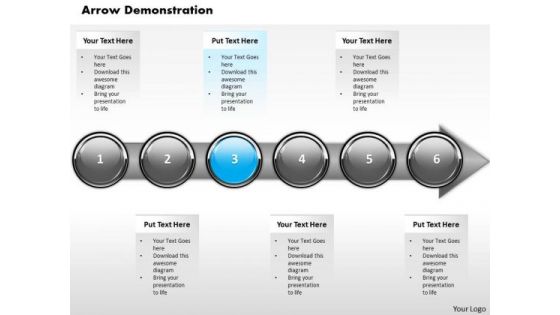
Ppt Homogeneous Demonstration Of Financial Process Using Stage 3 PowerPoint Templates
PPT homogeneous demonstration of financial process using stage 3 PowerPoint Templates-With this pre-designed process arrows diagram you can visualize almost any type of concept, chronological process or steps of your strategies.-PPT homogeneous demonstration of financial process using stage 3 PowerPoint Templates-Abstract, Achievement, Aim, Arrow, Background, Business, Chart, Communication, Company, Competition, Concept, Design, Development, Diagram, Direction, Finance, Financial, Forecast, Forward, Goal, Graph, Graphic, Growth, Icon, Illustration, Increase, Investment, Leader, Leadership, Marketing, Motion, Moving, Orange, Path, Price, Process, Profit, Progress, Shape, Sign, Success, Symbol, Target, Team, Teamwork, Up, Upwards
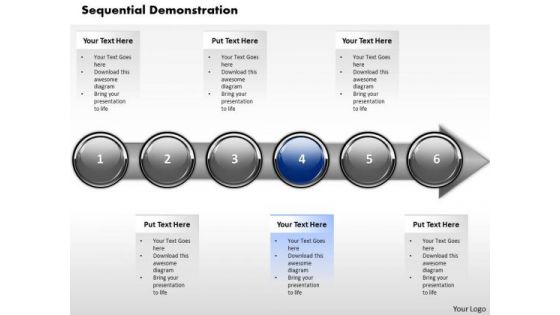
Ppt Horizontal Abstraction Of Financial Process Using Stage 4 PowerPoint Templates
PPT horizontal abstraction of financial process using stage 4 PowerPoint Templates-This diagram can be used in analyzing, designing, documenting or managing a process or program in various fields.-PPT horizontal abstraction of financial process using stage 4 PowerPoint Templates-Abstract, Achievement, Aim, Arrow, Background, Business, Chart, Communication, Company, Competition, Concept, Design, Development, Diagram, Direction, Finance, Financial, Forecast, Forward, Goal, Graph, Graphic, Growth, Icon, Illustration, Increase, Investment, Leader, Leadership, Marketing, Motion, Moving, Orange, Path, Price, Process, Profit, Progress, Shape, Sign, Success, Symbol, Target, Team, Teamwork, Up, Upwards
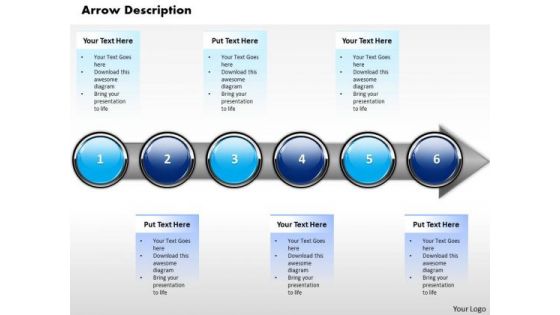
Ppt Horizontal Illustration Of Financial Process Using 6 State Diagram PowerPoint Templates
PPT horizontal illustration of financial process using 6 state diagram PowerPoint Templates-This diagram can be used in analyzing, designing, documenting or managing a process or program in various fields.-PPT horizontal illustration of financial process using 6 state diagram PowerPoint Templates-Abstract, Achievement, Aim, Arrow, Background, Business, Chart, Communication, Company, Competition, Concept, Design, Development, Diagram, Direction, Finance, Financial, Forecast, Forward, Goal, Graph, Graphic, Growth, Icon, Illustration, Increase, Investment, Leader, Leadership, Marketing, Motion, Moving, Orange, Path, Price, Process, Profit, Progress, Shape, Sign, Success, Symbol, Target, Team, Teamwork, Up, Upwards
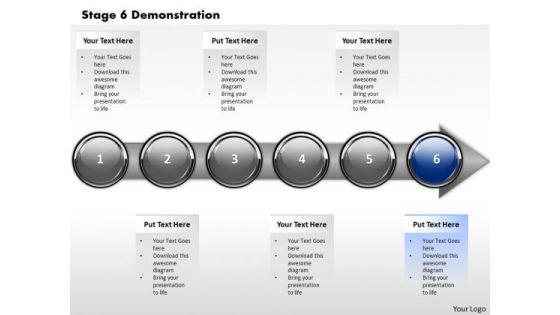
Ppt Linear Abstraction Of Financial Layouts Process Using Stage 6 PowerPoint Templates
PPT linear abstraction of financial layouts process using stage 6 PowerPoint Templates-The theme of this PowerPoint template is linear arrow. Use this slide to detail and highlight your thought process, your views and your positive expectations.-PPT linear abstraction of financial layouts process using stage 6 PowerPoint Templates-Abstract, Achievement, Aim, Arrow, Background, Business, Chart, Communication, Company, Competition, Concept, Design, Development, Diagram, Direction, Finance, Financial, Forecast, Forward, Goal, Graph, Graphic, Growth, Icon, Illustration, Increase, Investment, Leader, Leadership, Marketing, Motion, Moving, Orange, Path, Price, Process, Profit, Progress, Shape, Sign, Success, Symbol, Target, Team, Teamwork, Up, Upwards

Ppt Sequential Illustration Of Financial PowerPoint Presentation Process Step 2 Templates
PPT sequential illustration of financial powerpoint presentation process step 2 Templates-This diagram helps to determine your targets and you can sequence them as per your priorities. Educate your listeners on the relevance and importance of each one as per your plan.-PPT sequential illustration of financial powerpoint presentation process step 2 Templates-Abstract, Achievement, Aim, Arrow, Background, Business, Chart, Communication, Company, Competition, Concept, Design, Development, Diagram, Direction, Finance, Financial, Forecast, Forward, Goal, Graph, Graphic, Growth, Icon, Illustration, Increase, Investment, Leader, Leadership, Marketing, Motion, Moving, Orange, Path, Price, Process, Profit, Progress, Shape, Sign, Success, Symbol, Target, Team, Teamwork, Up, Upwards
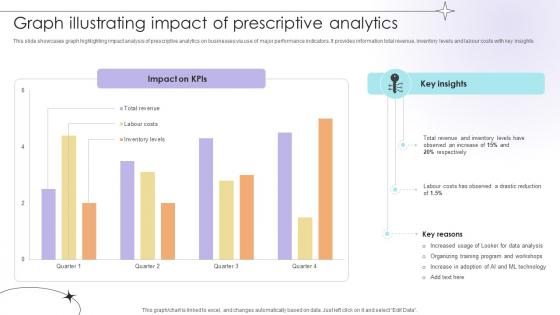
Graph Illustrating Impact Of Prescriptive Analytics Data Analytics SS V
This slide showcases graph highlighting impact analysis of prescriptive analytics on businesses via use of major performance indicators. It provides information total revenue, inventory levels and labour costs with key insights.Take your projects to the next level with our ultimate collection of Graph Illustrating Impact Of Prescriptive Analytics Data Analytics SS V. Slidegeeks has designed a range of layouts that are perfect for representing task or activity duration, keeping track of all your deadlines at a glance. Tailor these designs to your exact needs and give them a truly corporate look with your own brand colors they will make your projects stand out from the rest

Images Of Business People 3d Men With Bar Graph Making Effort PowerPoint Templates
We present our images of business people 3d men with bar graph making effort PowerPoint templates.Use our People PowerPoint Templates because You canTake a leap off the starting blocks with our PowerPoint Templates and Slides. They will put you ahead of the competition in quick time. Present our Business PowerPoint Templates because our PowerPoint Templates and Slides are the string of your bow. Fire of your ideas and conquer the podium. Use our Marketing PowerPoint Templates because They will Put the wind in your sails. Skim smoothly over the choppy waters of the market. Use our Teamwork PowerPoint Templates because Our PowerPoint Templates and Slides will steer your racing mind. Hit the right buttons and spur on your audience. Download and present our Shapes PowerPoint Templates because Our PowerPoint Templates and Slides will let you Hit the target. Go the full distance with ease and elan.Use these PowerPoint slides for presentations relating to 3d, abstract, accounting, achievement, bar graph, business, cartoon, concept, financial, goal, gold, golden, graph, growth, help, icon, lifting, bar, market, meeting, men, partnership, people, presentation, profits, progress, report, strength, team, teamwork. The prominent colors used in the PowerPoint template are Green, Blue, White.
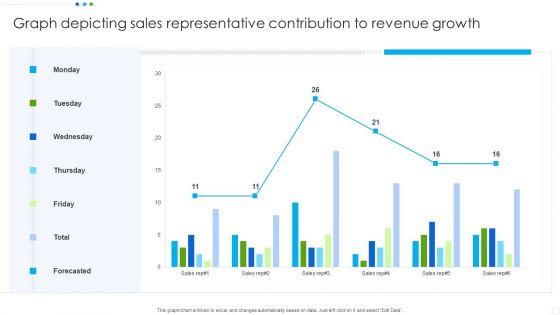
Graph Depicting Sales Representative Contribution To Revenue Growth Graphics PDF
Showcasing this set of slides titled Graph Depicting Sales Representative Contribution To Revenue Growth Graphics PDF. The topics addressed in these templates are Graph Depicting Sales, Revenue Growth. All the content presented in this PPT design is completely editable. Download it and make adjustments in color, background, font etc. as per your unique business setting.
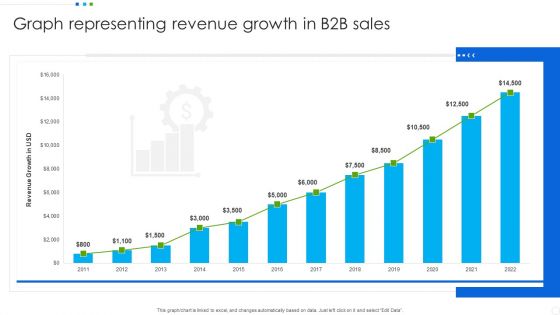
Graph Representing Revenue Growth In B2b Sales Background PDF
Pitch your topic with ease and precision using this Graph Representing Revenue Growth In B2b Sales Background PDF. This layout presents information on Graph Representing, Revenue Growth, Sales. It is also available for immediate download and adjustment. So, changes can be made in the color, design, graphics or any other component to create a unique layout.
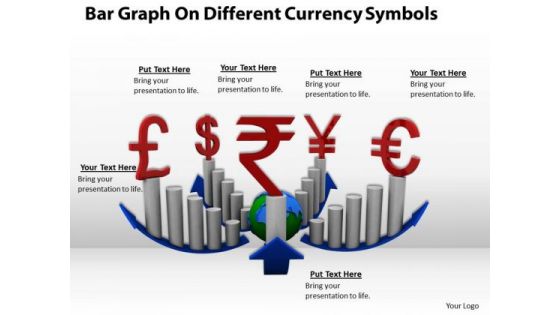
Stock Photo Bar Graph For Currency And Finance PowerPoint Slide
This image slide displays bar graphs with different currency symbols. This image has been designed with graphic of bar graphs, blue colored growth arrow and symbols of different currencies. Use this image slide, in your presentations to express views on finance, growth and achievements. This image slide may also be used to exhibit finance accounts in your presentations. This image slide will enhance the quality of your presentations.
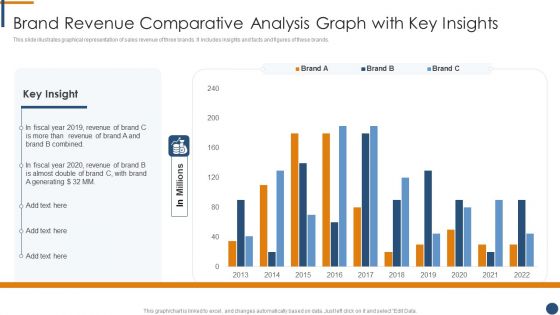
Brand Revenue Comparative Analysis Graph With Key Insights Inspiration PDF
This slide illustrates graphical representation of sales revenue of three brands. It includes insights and facts and figures of these brands.Showcasing this set of slides titled Brand Revenue Comparative Analysis Graph With Key Insights Inspiration PDF. The topics addressed in these templates are Brand Revenue Comparative Analysis Graph With Key Insights. All the content presented in this PPT design is completely editable. Download it and make adjustments in color, background, font etc. as per your unique business setting.
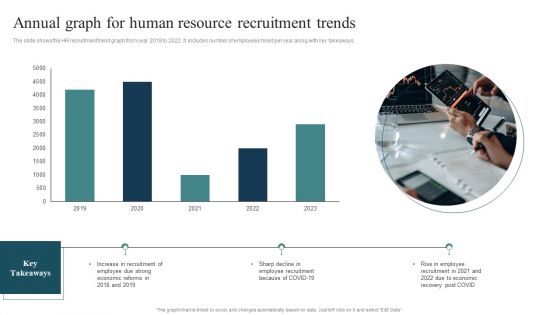
Annual Graph For Human Resource Recruitment Trends Summary PDF
The slide shows the HR recruitment trend graph from year 2018 to 2022. It includes number of employees hired per year along with key takeaways. Pitch your topic with ease and precision using this Annual Graph For Human Resource Recruitment Trends Summary PDF. This layout presents information on Employee Recruitment, Rise Employee, Economic Reforms. It is also available for immediate download and adjustment. So, changes can be made in the color, design, graphics or any other component to create a unique layout.
Business Graph Money PowerPoint Templates And PowerPoint Themes 0712
Business Graph Money PowerPoint Templates And PowerPoint Themes 0712-Microsoft Powerpoint Templates and Background with business graph
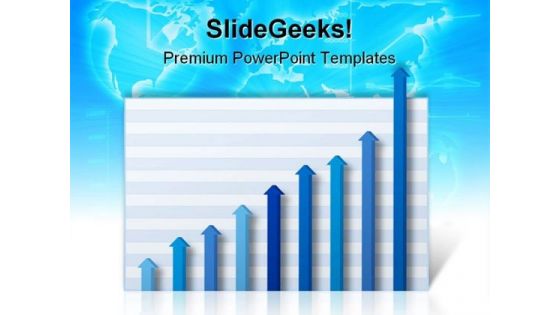
Business Graph Money PowerPoint Templates And PowerPoint Backgrounds 0511
Microsoft PowerPoint Template and Background with business graph with profits rising off the chart graph
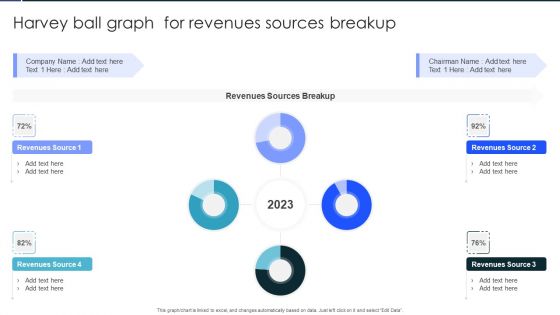
Harvey Ball Graph For Revenues Sources Breakup Infographics PDF
Showcasing this set of slides titled Harvey Ball Graph For Revenues Sources Breakup Infographics PDF. The topics addressed in these templates are Revenues Sources Breakup, Revenues, Sources Breakup. All the content presented in this PPT design is completely editable. Download it and make adjustments in color, background, font etc. as per your unique business setting.
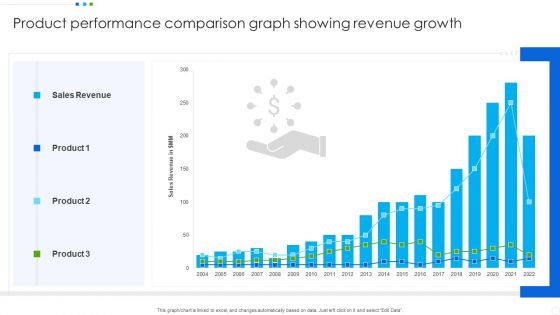
Product Performance Comparison Graph Showing Revenue Growth Portrait PDF
Showcasing this set of slides titled Product Performance Comparison Graph Showing Revenue Growth Portrait PDF. The topics addressed in these templates are Sales Revenue, Product. All the content presented in this PPT design is completely editable. Download it and make adjustments in color, background, font etc. as per your unique business setting.

Business Graph Marketing PowerPoint Templates And PowerPoint Themes 0712
Business Graph Marketing PowerPoint Templates And PowerPoint Themes 0712-Microsoft Powerpoint Templates and Background with business graph

Business Graph Success PowerPoint Templates And PowerPoint Themes 0712
Business Graph Success PowerPoint Templates And PowerPoint Themes 0712-Microsoft Powerpoint Templates and Background with business graph

Income Graph Business PowerPoint Templates And PowerPoint Themes 0712
Income Graph Business PowerPoint Templates And PowerPoint Themes 0712-Microsoft Powerpoint Templates and Background with bar graph
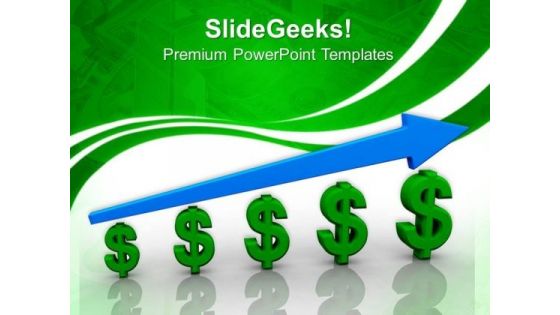
Business Graph Finance PowerPoint Templates And PowerPoint Themes 0712
Business Graph Finance PowerPoint Templates And PowerPoint Themes 0712-Microsoft Powerpoint Templates and Background with business graph

Success Graph Finance PowerPoint Templates And PowerPoint Themes 0812
Success Graph Finance PowerPoint Templates And PowerPoint Themes 0812-Microsoft Powerpoint Templates and Background with success graph
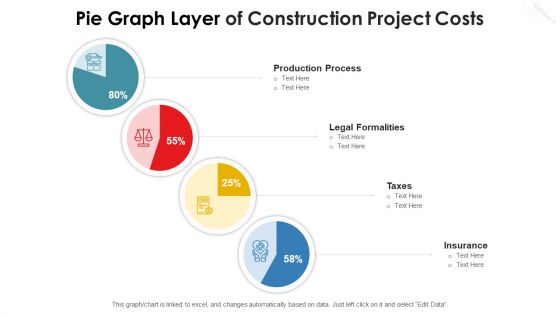
Pie Graph Layer Of Construction Project Costs Diagrams PDF
Showcasing this set of slides titled pie graph layer of construction project costs diagrams pdf. The topics addressed in these templates are production process, taxes, legal formalities, insurance. All the content presented in this PPT design is completely editable. Download it and make adjustments in color, background, font etc. as per your unique business setting.

Pie Graph Layer Of Organizational Report Themes PDF
Pitch your topic with ease and precision using this pie graph layer of organizational report themes pdf. This layout presents information on revenues increased by, business growth and expansion, customer traffic increased by. It is also available for immediate download and adjustment. So, changes can be made in the color, design, graphics or any other component to create a unique layout.

 Home
Home