Financial Graphs
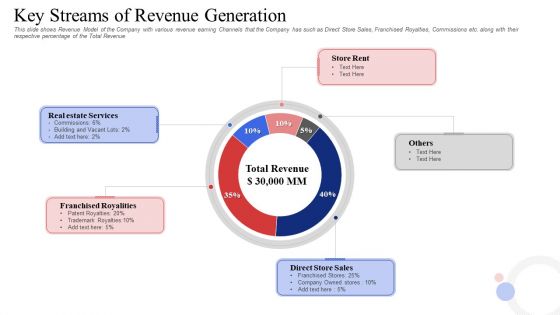
Investor Deck To Procure Receivables Funding From Business Financial Firms Key Streams Of Revenue Generation Topics PDF
This slide shows Revenue Model of the Company with various revenue earning Channels that the Company has such as Direct Store Sales, Franchised Royalties, Commissions etc. along with their respective percentage of the Total Revenue Deliver and pitch your topic in the best possible manner with this investor deck to procure receivables funding from business financial firms key streams of revenue generation topics pdf. Use them to share invaluable insights on real estate services, franchised royalities, direct store sales and impress your audience. This template can be altered and modified as per your expectations. So, grab it now.

Pitch Deck To Raise Capital From Commercial Financial Institution Using Bonds Current Growth Status Of The Company Guidelines PDF
This slide shows Current Growth Performance of the company in terms of rise in Earning per Share and overall Company Revenue Deliver and pitch your topic in the best possible manner with this pitch deck to raise capital from commercial financial institution using bonds current growth status of the company guidelines pdf. Use them to share invaluable insights on the revenue is expected to reach dollar 95 bn in the year 2021, increase in the revenue, operational expenses and impress your audience. This template can be altered and modified as per your expectations. So, grab it now.
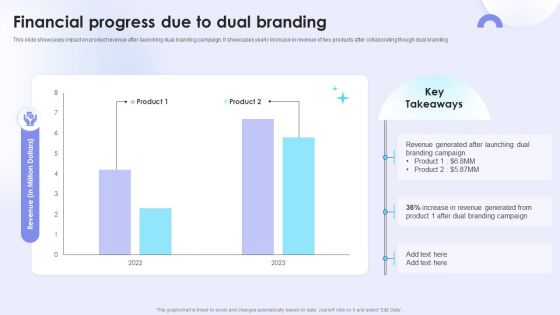
Dual Branding Campaign To Boost Sales Of Product Or Services Financial Progress Due To Dual Branding Pictures PDF
This slide showcases impact on product revenue after launching dual branding campaign. It showcases yearly increase in revenue of two products after collaborating though dual branding Take your projects to the next level with our ultimate collection of DDual Branding Campaign To Boost Sales Of Product Or Services Financial Progress Due To Dual Branding Pictures PDF. Slidegeeks has designed a range of layouts that are perfect for representing task or activity duration, keeping track of all your deadlines at a glance. Tailor these designs to your exact needs and give them a truly corporate look with your own brand colors they will make your projects stand out from the rest.

Investor Pitch Deck Collect Capital Financial Market Market Size And Market Share Of The Industry Information PDF
The slide provides the historical 2016-2020 and forecasted 2021-2025 market size of the banking industry. It also provides the key facts and 2021 market share of top companies in US banking industry. Deliver an awe-inspiring pitch with this creative investor pitch deck collect capital financial market market size and market share of the industry information pdf bundle. Topics like market size banking industry, market share in us banking industry 2021, banking industry facts can be discussed with this completely editable template. It is available for immediate download depending on the needs and requirements of the user.

Cyber Attacks Experienced By The Company In Previous Financial Year Hacking Prevention Awareness Training For IT Security Template PDF
This slide covers the security threats to the organization caused by different departments employees due to lack of cyber security awareness. Deliver an awe inspiring pitch with this creative cyber attacks experienced by the company in previous financial year hacking prevention awareness training for it security template pdf bundle. Topics like phishing, network intrusion, inadvertent disclosure, stolen or lost device or records, system misconfiguration can be discussed with this completely editable template. It is available for immediate download depending on the needs and requirements of the user.
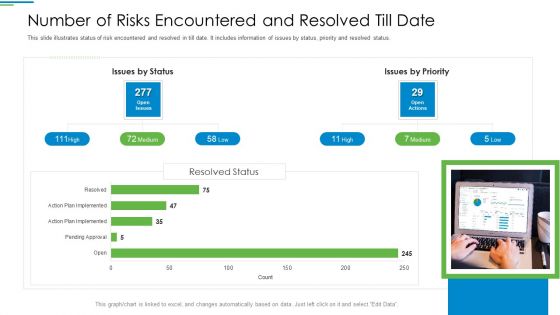
Operational Risk Management Structure In Financial Companies Number Of Risks Encountered And Resolved Till Date Portrait PDF
This slide illustrates status of risk encountered and resolved in till date. It includes information of issues by status, priority and resolved status. Deliver and pitch your topic in the best possible manner with this operational risk management structure in financial companies number of risks encountered and resolved till date portrait pdf. Use them to share invaluable insights on issues by status, issues by priority and impress your audience. This template can be altered and modified as per your expectations. So, grab it now.

Operational Risk Management Structure In Financial Companies Total Number Of Frauds Encountered And Loss Amount Involved Designs PDF
This slide explains year over year total number of frauds occurred in banking sector. It also includes the total amount of loss caused from risk events per year. Deliver and pitch your topic in the best possible manner with this operational risk management structure in financial companies total number of frauds encountered and loss amount involved designs pdf. Use them to share invaluable insights on total number of frauds encountered and loss amount involved and impress your audience. This template can be altered and modified as per your expectations. So, grab it now.
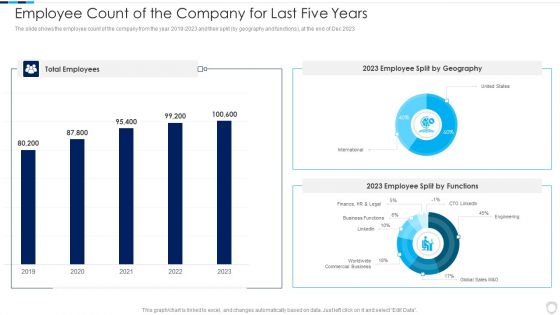
Financial Report Of An IT Firm Employee Count Of The Company For Last Five Years Topics PDF
The slide shows the employee count of the company from the year 2019 to 2023 and their split by geography and functions, at the end of Dec 2023.Deliver an awe inspiring pitch with this creative Financial Report Of An IT Firm Employee Count Of The Company For Last Five Years Topics PDF bundle. Topics like Total Employees, Split Geography, Split Functions can be discussed with this completely editable template. It is available for immediate download depending on the needs and requirements of the user.
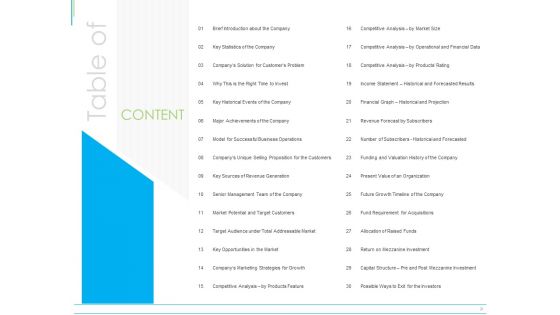
Pitch Deck For Mezzanine Financing Table Of Ppt Infographic Template Model PDF
Presenting this set of slides with name pitch deck for mezzanine financing table of ppt infographic template model pdf. The topics discussed in these slides are senior management, revenue generation, target audience , growth timeline, revenue forecast, financial graph, income statement. This is a completely editable PowerPoint presentation and is available for immediate download. Download now and impress your audience.

Project Metrics Dashboard Depicting Financials Pictures PDF
This slide shows the project management dashboard which covers the monthly sales graph and project financials such as reviewing, setup, coding, testing, getting feedback from users, training, implementation and launching. Pitch your topic with ease and precision using this Project Metrics Dashboard Depicting Financials Pictures PDF. This layout presents information on Execution, Project Financial. It is also available for immediate download and adjustment. So, changes can be made in the color, design, graphics or any other component to create a unique layout.
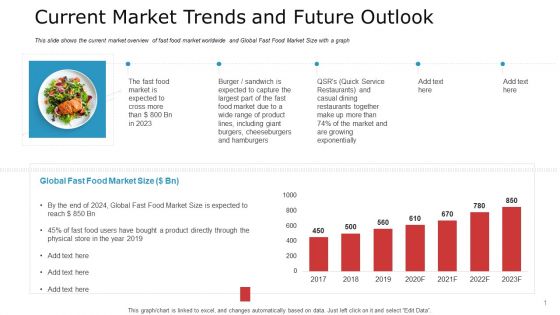
Pitch Deck To Raise Capital From Commercial Financial Institution Using Bonds Current Market Trends And Future Outlook Mockup PDF
This slide shows the current market overview of fast food market worldwide and Global Fast Food Market Size with a graph Deliver an awe-inspiring pitch with this creative pitch deck to raise capital from commercial financial institution using bonds current market trends and future outlook mockup pdf bundle. Topics like global fast food market size, restaurants and casual dining, restaurants together can be discussed with this completely editable template. It is available for immediate download depending on the needs and requirements of the user.

Financial Planning And Examination Plan For Small And Large Enterprises Analyzing The Balance Sheet Of Organization Formats PDF
The following slide outlines 3 years statement of financial position of the firm. The slide provides information about organization assets and liabilities and shareholders equity along with trend graph. Make sure to capture your audiences attention in your business displays with our gratis customizable Developing Financial Contingency Plan To Mitigate Various Risks Topics PDF. These are great for business strategies, office conferences, capital raising or task suggestions. If you desire to acquire more customers for your tech business and ensure they stay satisfied, create your own sales presentation with these plain slides.
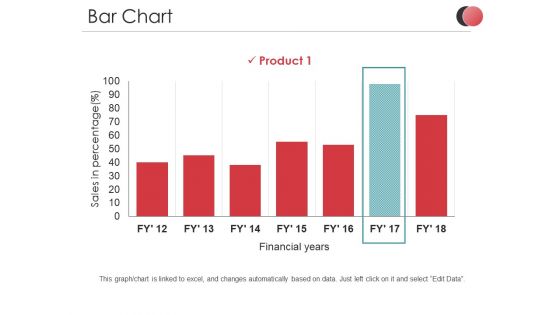
Bar Chart Ppt PowerPoint Presentation Outline Introduction
This is a bar chart ppt powerpoint presentation outline introduction. This is a one stage process. The stages in this process are sales in percentage, product, business, financial years, graph.

Bar Chart Ppt PowerPoint Presentation Styles Outfit
This is a bar chart ppt powerpoint presentation styles outfit. This is a Seven stage process. The stages in this process are sales in percentage, financial years, graph, business.

Clustered Column Ppt PowerPoint Presentation Pictures Mockup
This is a clustered column ppt powerpoint presentation pictures mockup. This is a two stage process. The stages in this process are product, sales in percentage, financial year, graph, business.
Column Chart Ppt PowerPoint Presentation Infographic Template Icon
This is a column chart ppt powerpoint presentation infographic template icon. This is a two stage process. The stages in this process are business, marketing, sales in percentage, financial year, graph.
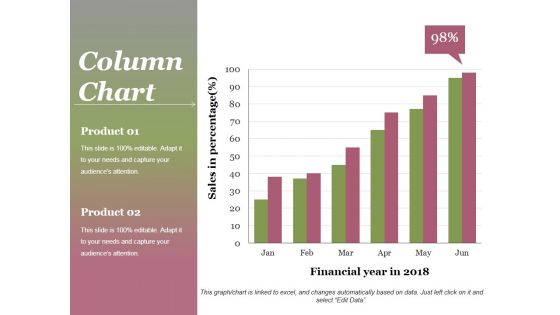
Column Chart Ppt PowerPoint Presentation Gallery Background
This is a column chart ppt powerpoint presentation gallery background. This is a two stage process. The stages in this process are product, sales in percentage, financial year, graph, success.
Stacked Line Ppt PowerPoint Presentation Icon Professional
This is a stacked line ppt powerpoint presentation icon professional. This is a three stage process. The stages in this process are Business, Financial, Marketing, Graph, Strategy Revenue In Percentage.
Subordinate Debt Pitch Deck For Fund Raising Table Of Content Ppt Icon Grid PDF
Deliver an awe-inspiring pitch with this creative subordinate debt pitch deck for fund raising table of content ppt icon grid pdf bundle. Topics like major achievements company, key sources revenue generation, market potential and target customers, key opportunities market, key statistics company, financial graph historical and projection, revenue forecast subscribers can be discussed with this completely editable template. It is available for immediate download depending on the needs and requirements of the user.
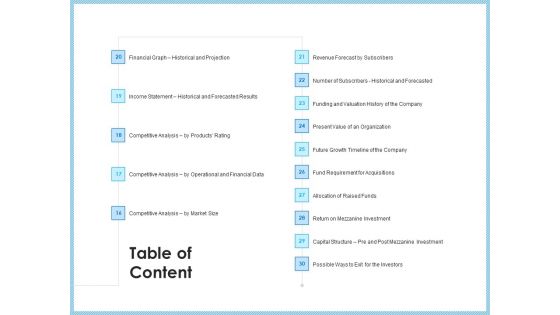
Investment Pitch To Generating Capital From Mezzanine Credit Table Of Content Market Mockup PDF
Deliver an awe-inspiring pitch with this creative investment pitch to generating capital from mezzanine credit table of content market mockup pdf bundle. Topics like financial graph historical and projection, income statement, historical and forecasted results, competitive analysis products rating, competitive analysis, market size can be discussed with this completely editable template. It is available for immediate download depending on the needs and requirements of the user.
Bar Chart Ppt PowerPoint Presentation Icon Demonstration
This is a bar chart ppt powerpoint presentation icon demonstration. This is a seven stage process. The stages in this process are product, sales in percentage, financial year, graph.

Business Marketing PowerPoint Templates Business Start Of The Data Stats Section Ppt Slides
Business Marketing PowerPoint Templates Business start of the data stats section PPT Slides-This Pie Chart is a simple template that provides a graphical, time-phased overview of a continuing sequence of stages, tasks, or events in a circular flow. You can divide a Pie Chart into segments for illustrating proportion-Business Marketing PowerPoint Templates Business start of the data stats section PPT Slides-This ppt can be used for concepts relating to-3d, Allocate, Allocation, Business, Chart, Circle, Data, Diagram, Divide, Division, Expensive, Financial, Graph Etc.
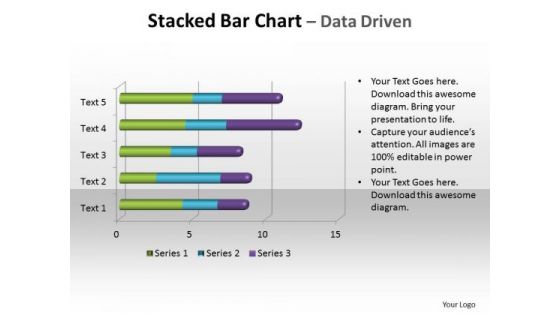
Business Graphic PowerPoint Templates Business Stacked Bar Chart Ppt Slides
Business Graphic PowerPoint Templates Business stacked bar chart PPT Slides-You can use a 100% stacked column chart when you have three or more data series and you want to emphasize the contributions to the whole, especially if the total is the same for each category. . -Business Graphic PowerPoint Templates Business stacked bar chart PPT Slides-This ppt can be used for concepts relating to-Bar, Block, Business, Chart, Color, Colour, Column, Decline, Fill, Finance, Financial, Graph etc.

Ppt Comparison Network Diagram PowerPoint Template 4 Phase Templates
PPT comparison network diagram powerpoint template 4 phase Templates-This PowerPoint diagram slide shows four opposing views. You can use the This PowerPoint diagram slide to represent views from different functions on an issue.-PPT comparison network diagram powerpoint template 4 phase Templates-Abstract, Achievement, Business, Chart, Comparison, Concepts, Data, Descriptive, Design, Development, Diagram, Element, Figure, Finance, Financial, Graph, Graphic, Growth, Icon, Ideas, Improvement, Investment, Market, Money, Progress, Raise, Real, Report, Revenue, Sale, Shape, Sign, Silhouette, Stock, Success, Symbol, Technology
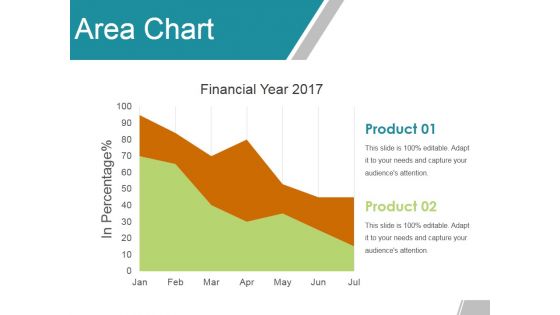
Area Chart Ppt Powerpoint Presentation Ideas Templates
This is a area chart ppt powerpoint presentation ideas templates. This is a two stage process. The stages in this process are product, financial year, in percentage, graph.
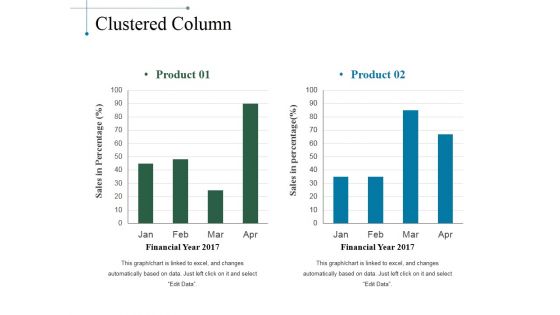
Clustered Column Ppt PowerPoint Presentation Slides Smartart
This is a clustered column ppt powerpoint presentation slides smartart. This is a two stage process. The stages in this process are product, sales in percentage, financial year, bar graph.
Clustered Column Ppt PowerPoint Presentation Gallery Format
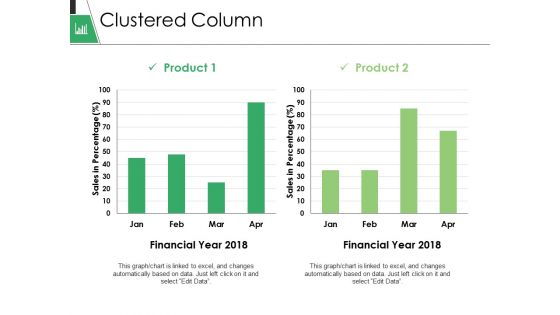
This is a clustered column ppt powerpoint presentation gallery format. This is a two stage process. The stages in this process are business, marketing, graph, financial year, sales in percentage.
Coin And Arrow Business PowerPoint Template 1110
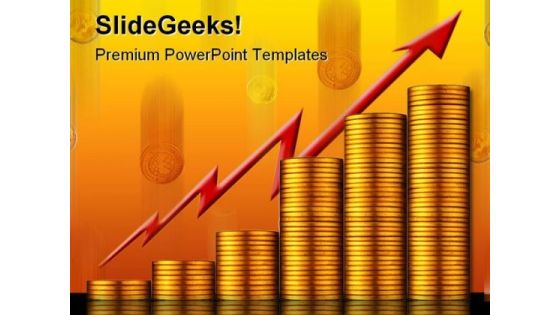
A financial concept with stacks of pennies increasing like a graph signifying success

Midstream Organic Growth Ppt PowerPoint Presentation Ideas Graphics Tutorials
This is a midstream organic growth ppt powerpoint presentation ideas graphics tutorials. This is a three stage process. The stages in this process are business, marketing, bar graph, management, financials.
Clustered Column Line Ppt PowerPoint Presentation Icon Good
This is a clustered column line ppt powerpoint presentation icon good. This is a three stage process. The stages in this process are product, financial year, bar graph, business, growth.
Bar Chart Ppt PowerPoint Presentation Icon Information
This is a bar chart ppt powerpoint presentation icon information. This is a one stage process. The stages in this process are product, sales in percentage, financial years, bar graph, growth.

Column Chart Ppt PowerPoint Presentation Layouts Tips
This is a column chart ppt powerpoint presentation layouts tips. This is a six stage process. The stages in this process are sales in percentage, financial year, bar graph, growth, success.

Stacked Area Clustered Column Ppt PowerPoint Presentation Summary Slides
This is a stacked area clustered column ppt powerpoint presentation summary slides. This is a three stage process. The stages in this process are product, in percentage, financial year, bar graph.
Column Chart Ppt PowerPoint Presentation Layouts Design Inspiration
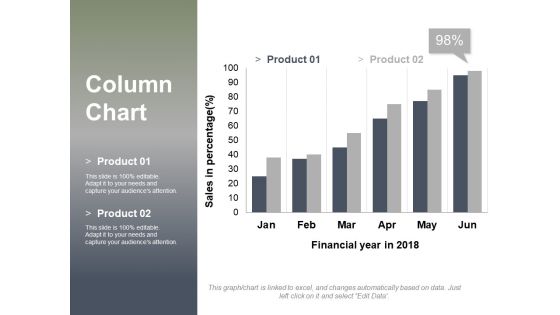
This is a column chart ppt powerpoint presentation layouts design inspiration. This is a two stage process. The stages in this process are sales in percentage, financial year in, graph, business, finance, marketing.

PowerPoint Design Round Chart Leadership Ppt Process
PowerPoint Design Round Chart Leadership PPT Process-Determine your targets and sequence them as per your priorities. Unravel each one for your audience while setting key timelines as you go along. Educate your listeners on the relevance and importance of each one as per your plan and how they all contribute as you strive to hit the Bullseye-PowerPoint Design Round Chart Leadership PPT Process-This ppt can be used for presentations relating to-3d, Angle, Arrow, Business, Chart, Circle, Complex, Concept, Data, Depth, Diagram, Dimensional, Financial, Graph, Graphic, Process

PowerPoint Design Slides Round Chart Image Ppt Themes
PowerPoint Design Slides Round Chart Image PPT Themes-Determine your targets and sequence them as per your priorities. Unravel each one for your audience while setting key timelines as you go along. Educate your listeners on the relevance and importance of each one as per your plan and how they all contribute as you strive to hit the Bullseye-PowerPoint Design Slides Round Chart Image PPT Themes-This ppt can be used for presentations relating to-3d, Angle, Arrow, Business, Chart, Circle, Complex, Concept, Data, Depth, Diagram, Dimensional, Financial, Graph, Graphic, Process

PowerPoint Designs Round Chart Business Ppt Presentation Designs
PowerPoint Designs Round Chart Business PPT Presentation Designs-Determine your targets and sequence them as per your priorities. Unravel each one for your audience while setting key timelines as you go along. Educate your listeners on the relevance and importance of each one as per your plan and how they all contribute as you strive to hit the Bullseye-PowerPoint Designs Round Chart Business PPT Presentation Designs-This ppt can be used for presentations relating to-3d, Angle, Arrow, Business, Chart, Circle, Complex, Concept, Data, Depth, Diagram, Dimensional, Financial, Graph, Graphic, Process

PowerPoint Slide Designs Round Chart Business Ppt Slide Designs
PowerPoint Slide Designs Round Chart Business PPT Slide Designs-Determine your targets and sequence them as per your priorities. Unravel each one for your audience while setting key timelines as you go along. Educate your listeners on the relevance and importance of each one as per your plan and how they all contribute as you strive to hit the Bullseye-PowerPoint Slide Designs Round Chart Business PPT Slide Designs-This ppt can be used for presentations relating to-3d, Angle, Arrow, Business, Chart, Circle, Complex, Concept, Data, Depth, Diagram, Dimensional, Financial, Graph, Graphic, Process

Ppt Round Images 2007 Implementation Of 8 Steps Involved Procedure PowerPoint Templates
PPT round images 2007 implementation of 8 steps involved procedure PowerPoint Templates-This PowerPoint Diagram shows the Round Implementation of steps which are involved in manufacturing Process. It includes eight Steps. You can change color, size and orientation of any icon to your liking.-PPT round images 2007 implementation of 8 steps involved procedure PowerPoint Templates-Analysis, Art, Blank, Blue, Business, Categories, Chart, Chief, Circle, Clip, Clipart, Corporate, Design, Diagram, Directors, Element, Executive, Financial, Graph, Graphic, Green, Heading, Icon, Illustration, Implementation, Isolated, Managers, Media, Network, Officer, Perspective, Pie, President, Red, Relations, Role, Round, Sales, Segments, Set, Six, Staff, Strategic, Title, Vector, Vice, Wheel
Clustered Column Ppt PowerPoint Presentation Gallery Structure
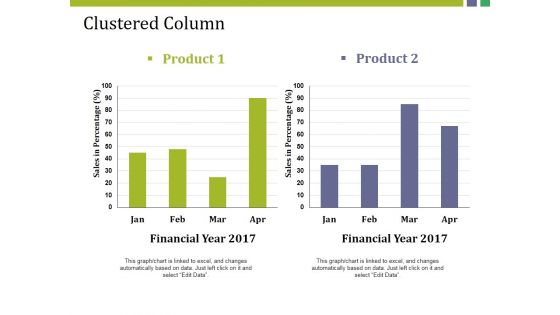
This is a clustered column ppt powerpoint presentation gallery structure. This is a two stage process. The stages in this process are product, sales in percentage, financial year, bar graph, finance.
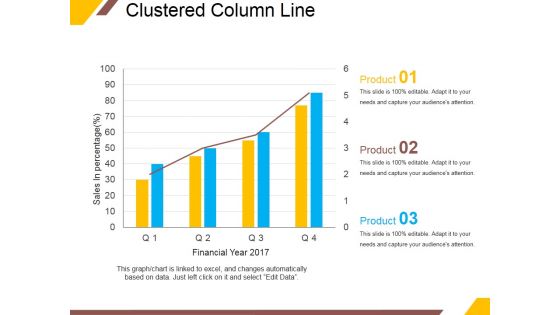
Clustered Column Line Ppt PowerPoint Presentation Portfolio Outline
This is a clustered column line ppt powerpoint presentation portfolio outline. This is a four stage process. The stages in this process are sales in percentage, financial year, product, graph, growth.

Ppt Round Implementation Of 8 Steps Involved Procedure PowerPoint Templates
PPT round implementation of 8 steps involved procedure PowerPoint Templates-This PowerPoint Diagram shows the Round Implementation of steps which are involved in manufacturing Process. It includes eight Steps. You can change color, size and orientation of any icon to your liking.-PPT round implementation of 8 steps involved procedure PowerPoint Templates-Analysis, Art, Blank, Blue, Business, Categories, Chart, Chief, Circle, Clip, Clipart, Corporate, Design, Diagram, Directors, Element, Executive, Financial, Graph, Graphic, Green, Heading, Icon, Illustration, Implementation, Isolated, Managers, Media, Network, Officer, Perspective, Pie, President, Red, Relations, Role, Round, Sales, Segments, Set, Six, Staff, Strategic, Title, Vector, Vice, Wheel

Colored Arrows Business Growth PowerPoint Templates And PowerPoint Themes 1012
Colored Arrows Business Growth PowerPoint Templates And PowerPoint Themes 1012-The above template displays a diagram of 3d colorful arrows on abstract world map background. This image represents the concept of business growth and success. Use this template for business and corporate purposes. It imitates competition, communication, financial, graph, growth, progress, sales, success and target. This image has been conceived to enable you to emphatically communicate your ideas in your Leadership and Marketing PPT presentations. Create captivating presentations to deliver comparative and weighted arguments.-Colored Arrows Business Growth PowerPoint Templates And PowerPoint Themes 1012-This PowerPoint template can be used for presentations relating to-Colored arrows vector, business, success, competition, leadership, finance
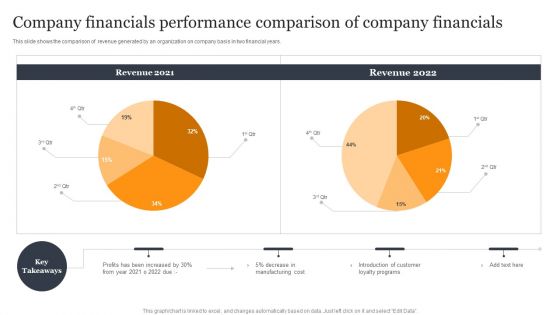
Company Financials Performance Comparison Of Company Financials Formats PDF
This slide shows the comparison of revenue generated by an organization on company basis in two financial years. Pitch your topic with ease and precision using this Company Financials Performance Comparison Of Company Financials Formats PDF. This layout presents information on Manufacturing Cost, Introduction Customer, Loyalty Programs. It is also available for immediate download and adjustment. So, changes can be made in the color, design, graphics or any other component to create a unique layout.
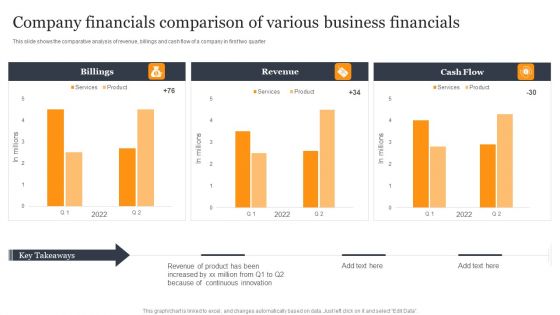
Company Financials Comparison Of Various Business Financials Template PDF
This slide shows the comparative analysis of revenue, billings and cash flow of a company in first two quarter. Pitch your topic with ease and precision using this Company Financials Comparison Of Various Business Financials Template PDF. This layout presents information on Revenue Product, Because Continuous, Been Increased. It is also available for immediate download and adjustment. So, changes can be made in the color, design, graphics or any other component to create a unique layout.
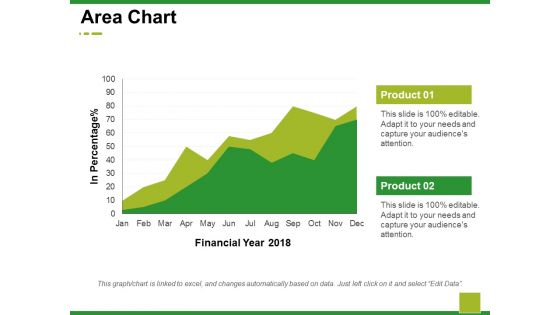
Area Chart Ppt PowerPoint Presentation Model Demonstration
This is a area chart ppt powerpoint presentation model demonstration. This is a two stage process. The stages in this process are business, marketing, financial year, in percentage, graph.

Combo Chart Ppt PowerPoint Presentation Summary Background Images
This is a combo chart ppt powerpoint presentation summary background images. This is a two stage process. The stages in this process are business, marketing, financial year, in percentage, graph.

Line Chart Ppt PowerPoint Presentation Infographic Template Slides
This is a line chart ppt powerpoint presentation infographic template slides. This is a two stage process. The stages in this process are sales in percentage, financial years, business, marketing, graph.
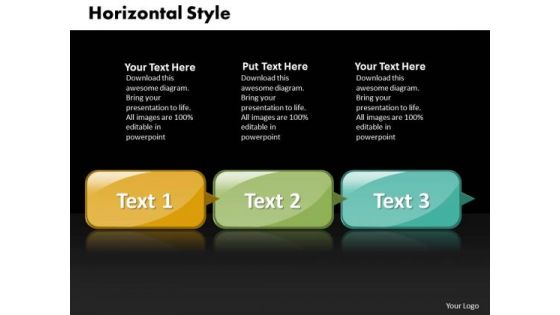
Ppt Horizontal Picture Style PowerPoint 2010 3 State Diagram Templates
PPT horizontal picture style powerpoint 2010 3 state diagram Templates-This diagram is an amazing tool to ensure that strategic planning sessions contribute to teambuilding.-PPT horizontal picture style powerpoint 2010 3 state diagram Templates-Banner, Box, Business, Button, Chrome, Collection, Control, Design, Direction, Element, Empty, Financial, Flow, Graph, Green, Header, Horizontal, Style, Illustration, Image, Information, Process, Red, Retail, Round, Sale, Set, Shapes

Ppt Horizontal Polished Style PowerPoint 2007 6 Stage Templates
PPT horizontal polished style powerpoint 2007 6 stage Templates-This PowerPoint diagram slide shows 6 stages in different colors. You can add text to this slide as per your need.-PPT horizontal polished style powerpoint 2007 6 stage Templates-Banner, Box, Business, Button, Chrome, Collection, Control, Design, Direction, Element, Empty, Financial, Flow, Graph, Green, Header, Horizontal, Illustration, Image, Information, Process, Red, Retail, Round, Sale, Set, Shapes

Ppt Horizontal Polished Style PowerPoint 2007 6 Stages 1 Templates
PPT horizontal polished style powerpoint 2007 6 stages 1 Templates-This diagram is an amazing tool to ensure that strategic planning sessions contribute to teambuilding.-PPT horizontal polished style powerpoint 2007 6 stages 1 Templates-Banner, Arrows, Business, Button, Chrome, Collection, Control, Design, Direction, Element, Empty, Financial, Flow, Graph, Green, Header, Horizontal, Illustration, Image, Information, Process, Red, Retail, Round, Sale, Set, Shapes

Ppt Horizontal Style 3 Stages 1 PowerPoint Templates
PPT horizontal style 3 stages 1 PowerPoint Templates-This diagram provides an overview of the interactions of different factors in a company.-PPT horizontal style 3 stages 1 PowerPoint Templates-Banner, Arrows, Business, Button, Chrome, Collection, Control, Design, Direction, Element, Empty, Financial, Flow, Graph, Green, Header, Horizontal, Illustration, Image, Information, Process, Red, Retail, Round, Sale, Set, Shapes

Ppt Horizontal Style 5 Stages 1 PowerPoint Templates
PPT horizontal style 5 stages 1 PowerPoint Templates-This PowerPoint diagram slide shows 5 steps in different colors. You can add text to this slide as per your need.-PPT horizontal style 5 stages 1 PowerPoint Templates-Banner, Arrows, Business, Button, Chrome, Collection, Control, Design, Direction, Element, Empty, Financial, Flow, Graph, Green, Header, Horizontal, Illustration, Image, Information, Process, Red, Retail, Round, Sale, Set, Shapes
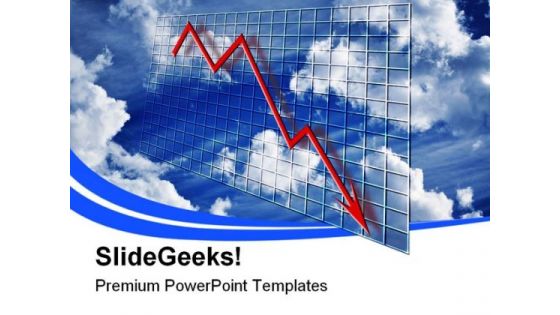
Crisis Chart Business PowerPoint Templates And PowerPoint Backgrounds 0811
Microsoft PowerPoint Template and Background with graph declining over time concept financial decline or credit crisis crunch over grid and clouds with cloudy sky
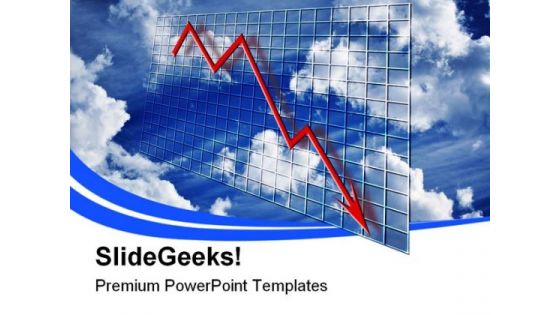
Crisis Chart Business PowerPoint Themes And PowerPoint Slides 0811
Microsoft PowerPoint Theme and Slide with graph declining over time concept financial decline or credit crisis crunch over grid and clouds with cloudy sky

Bar Chart Ppt PowerPoint Presentation Outline Backgrounds
This is a bar chart ppt powerpoint presentation outline backgrounds. This is a one stage process. The stages in this process are sales in percentage, financial years, product, bar graph, finance.
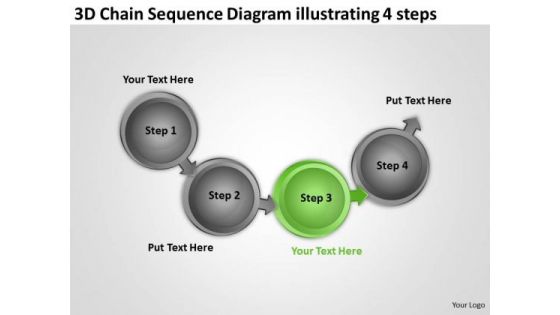
3d Chain Sequence Diagram Illustrating 4 Steps Ppt Business Plan Financials PowerPoint Slides
We present our 3d chain sequence diagram illustrating 4 steps ppt business plan financials PowerPoint Slides.Present our Finance PowerPoint Templates because Our PowerPoint Templates and Slides will fulfill your every need. Use them and effectively satisfy the desires of your audience. Use our Business PowerPoint Templates because you can see clearly through to the bigger bowl ahead. Time your jump to perfection and hit the nail on the head. Use our Circle Charts PowerPoint Templates because this template will explain the value of its wellness to human life. Use our Flow charts PowerPoint Templates because it depicts Rolling along while gathering profits along the way is the aim. Use our Arrows PowerPoint Templates because clear thnking is your strength, transmit your thoughts to your eager team.Use these PowerPoint slides for presentations relating to Arrow, Business, Chain, Chart, Circle, Circle, Frame, Color, Concept, Connect, Connection, Connectivity, Corporate, Data, Design, Diagram, Financial, Flow, Flowchart, Graph, Graphical, Group, Important, Organization, Organize, Plan, Process, Rectangle, Relation, Set, Steps, Structure, Teamwork. The prominent colors used in the PowerPoint template are Green, Gray, Black. Professionals tell us our 3d chain sequence diagram illustrating 4 steps ppt business plan financials PowerPoint Slides will make the presenter successul in his career/life. We assure you our Concept PowerPoint templates and PPT Slides are Gorgeous. People tell us our 3d chain sequence diagram illustrating 4 steps ppt business plan financials PowerPoint Slides are Ultra. Customers tell us our Chart PowerPoint templates and PPT Slides are Perfect. Use our 3d chain sequence diagram illustrating 4 steps ppt business plan financials PowerPoint Slides are Efficient. We assure you our Circle PowerPoint templates and PPT Slides are Gorgeous.

Column Chart Ppt PowerPoint Presentation Gallery Slide Portrait
This is a column chart ppt powerpoint presentation gallery slide portrait. This is a two stage process. The stages in this process are sales in percentage, financial year, product, bar graph, growth.

Bar Chart Ppt PowerPoint Presentation Infographics Format Ideas
This is a bar chart ppt powerpoint presentation infographics format ideas. This is a two stage process. The stages in this process are bar graph, product, financial year, sales in percentage.

Business Circle Chart PowerPoint Templates Editable Innovation Process Ppt Slides
Business Circle Chart PowerPoint Templates Editable Innovation Process PPT Slides-Use this circle chart to make your team understand complex processes.-Business Circle Chart PowerPoint Templates Editable Innovation Process PPT Slides-This template can be used for presentations relating to Aluminum, Analyze, Business, Chart, Colors, Column, Company, Computer, Corporate, Create, Data, Design, Drawing, Figures, Financial, Flowchart, Graph, Idea, Innovate, Keyboard, Layout, Notepad, Notes, Numbers, Organizational, Pie, Plan, Planning, Process

 Home
Home