Financial Graphs

Financial Performance Online Financial Services Platform Ppt Slides
This slide highlights video advertising platform highlights the growing financial performance of the company. It depicts companys annual value of revenue and gross profit. Present like a pro with Financial Performance Online Financial Services Platform Ppt Slides. Create beautiful presentations together with your team, using our easy-to-use presentation slides. Share your ideas in real-time and make changes on the fly by downloading our templates. So whether you are in the office, on the go, or in a remote location, you can stay in sync with your team and present your ideas with confidence. With Slidegeeks presentation got a whole lot easier. Grab these presentations today.
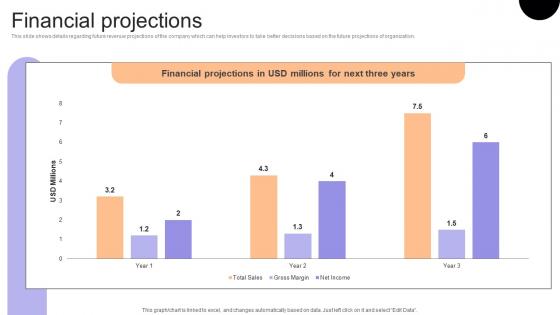
Financial Projections Financial Consulting Platform Fundraising Pitch Deck Formats Pdf
This slide shows details regarding future revenue projections of the company which can help investors to take better decisions based on the future projections of organization. Do you have to make sure that everyone on your team knows about any specific topic I yes, then you should give Financial Projections Financial Consulting Platform Fundraising Pitch Deck Formats Pdf a try. Our experts have put a lot of knowledge and effort into creating this impeccable Financial Projections Financial Consulting Platform Fundraising Pitch Deck Formats Pdf. You can use this template for your upcoming presentations, as the slides are perfect to represent even the tiniest detail. You can download these templates from the Slidegeeks website and these are easy to edit. So grab these today
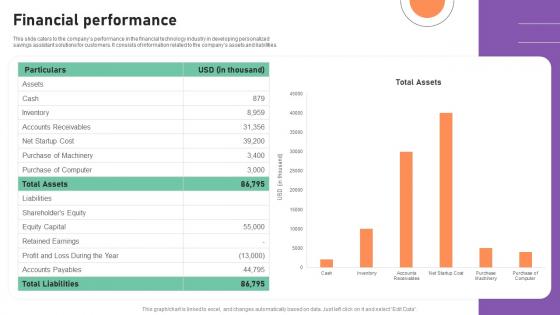
Financial Performance Financial Management Software Capital Raising Deck Graphics Pdf
This slide caters to the companys performance in the financial technology industry in developing personalized savings assistant solutions for customers. It consists of information related to the companys assets and liabilities. Present like a pro with Financial Performance Financial Management Software Capital Raising Deck Graphics Pdf Create beautiful presentations together with your team, using our easy to use presentation slides. Share your ideas in real time and make changes on the fly by downloading our templates. So whether you are in the office, on the go, or in a remote location, you can stay in sync with your team and present your ideas with confidence. With Slidegeeks presentation got a whole lot easier. Grab these presentations today.
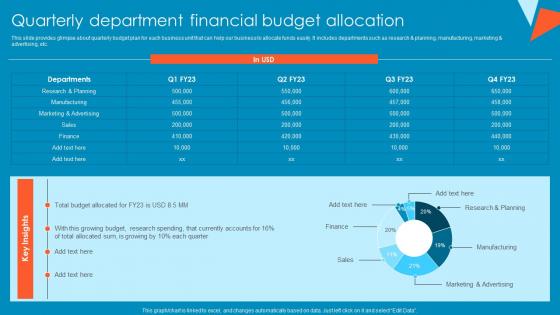
Quarterly Department Financial Budget Allocation Tactical Financial Governance Formats Pdf
This slide provides glimpse about quarterly budget plan for each business unit that can help our business to allocate funds easily. It includes departments such as research and planning, manufacturing, marketing and advertising, etc. There are so many reasons you need a Quarterly Department Financial Budget Allocation Tactical Financial Governance Formats Pdf. The first reason is you can not spend time making everything from scratch, Thus, Slidegeeks has made presentation templates for you too. You can easily download these templates from our website easily.
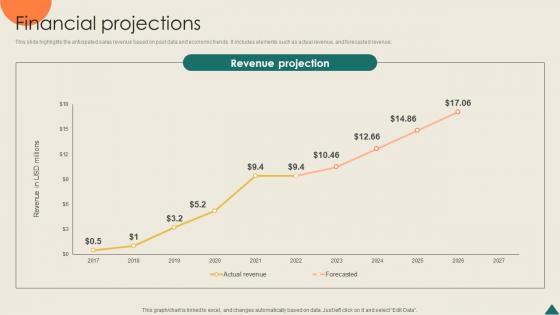
Financial Projections Financial Analytics Platform Investor Elevator Pitch Deck
This slide highlights the anticipated sales revenue based on past data and economic trends. It includes elements such as actual revenue, and forecasted revenue. Boost your pitch with our creative Financial Projections Financial Analytics Platform Investor Elevator Pitch Deck. Deliver an awe-inspiring pitch that will mesmerize everyone. Using these presentation templates you will surely catch everyones attention. You can browse the ppts collection on our website. We have researchers who are experts at creating the right content for the templates. So you do not have to invest time in any additional work. Just grab the template now and use them.
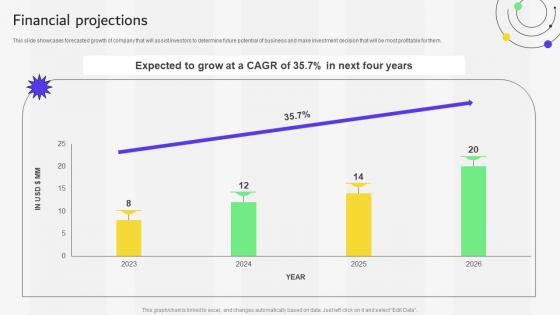
Financial Projections Financial Services Provider Investor Funding Elevator Pitch Deck
This slide showcases forecasted growth of company that will assist investors to determine future potential of business and make investment decision that will be most profitable for them. resent like a pro with Financial Projections Financial Services Provider Investor Funding Elevator Pitch Deck. Create beautiful presentations together with your team, using our easy-to-use presentation slides. Share your ideas in real-time and make changes on the fly by downloading our templates. So whether you are in the office, on the go, or in a remote location, you can stay in sync with your team and present your ideas with confidence. With Slidegeeks presentation got a whole lot easier. Grab these presentations today.

Financial Projections Financial Management Software Capital Raising Deck Sample Pdf
This slide caters to the details related to the forecast of companies future. It highlights revenue, cost of goods sold, net profit, operating profit, and CAGR Compound annual growth rate recorded which indicates positive performance and future growth potential. Slidegeeks is here to make your presentations a breeze with Financial Projections Financial Management Software Capital Raising Deck Sample Pdf With our easy to use and customizable templates, you can focus on delivering your ideas rather than worrying about formatting. With a variety of designs to choose from, you are sure to find one that suits your needs. And with animations and unique photos, illustrations, and fonts, you can make your presentation pop. So whether you are giving a sales pitch or presenting to the board, make sure to check out Slidegeeks first.

Quarterly Department Financial Budget Assessing Corporate Financial Techniques Slides Pdf
This slide provides glimpse about quarterly budget plan for each business unit that can help our business to allocate funds easily. It includes departments such as research and planning, manufacturing, marketing and advertising, etc. This Quarterly Department Financial Budget Assessing Corporate Financial Techniques Slides Pdf from Slidegeeks makes it easy to present information on your topic with precision. It provides customization options, so you can make changes to the colors, design, graphics, or any other component to create a unique layout. It is also available for immediate download, so you can begin using it right away. Slidegeeks has done good research to ensure that you have everything you need to make your presentation stand out. Make a name out there for a brilliant performance.
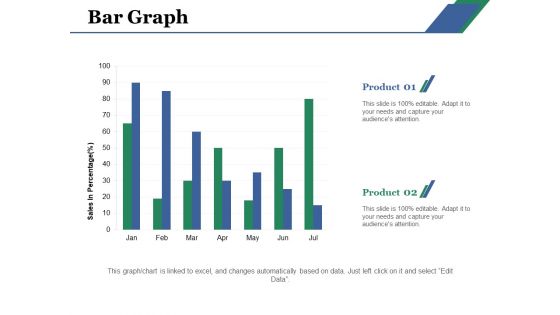
Bar Graph Ppt PowerPoint Presentation Infographic Template Demonstration
This is a bar graph ppt powerpoint presentation infographic template demonstration. This is a two stage process. The stages in this process are bar graph, product, sales, percentage, financial.

Coverage Financial Ratios Chart For 5 Financial Years Themes PDF
This slide illustrates graph for coverage ratios that are interest coverage ratio, debt service coverage ratio and asset coverage ratio. It showcases comparison for a period of 5 years that can help company to measure ability to service its debt and meet its financial obligations Showcasing this set of slides titled coverage financial ratios chart for 5 financial years themes pdf. The topics addressed in these templates are coverage financial ratios chart for 5 financial years. All the content presented in this PPT design is completely editable. Download it and make adjustments in color, background, font etc. as per your unique business setting.

Financial PAR Key Financial Highlights Ppt Layouts Deck PDF
Deliver an awe inspiring pitch with this creative financial par key financial highlights ppt layouts deck pdf bundle. Topics like net sales in figures, operating profits in figures, dividend declared per share in figures, free cash flow in figures can be discussed with this completely editable template. It is available for immediate download depending on the needs and requirements of the user.

Financial Evaluation Report Project Feasibility Financial Ratios Mockup PDF
Following slide covers project feasibility financial ratio along with graphical representation. Ratios included are net profit sales, quick ratio, debt equity ratio and gross profit sales. Formulating a presentation can take up a lot of effort and time, so the content and message should always be the primary focus. The visuals of the PowerPoint can enhance the presenters message, so our Financial Evaluation Report Project Feasibility Financial Ratios Mockup PDF was created to help save time. Instead of worrying about the design, the presenter can concentrate on the message while our designers work on creating the ideal templates for whatever situation is needed. Slidegeeks has experts for everything from amazing designs to valuable content, we have put everything into Financial Evaluation Report Project Feasibility Financial Ratios Mockup PDF.
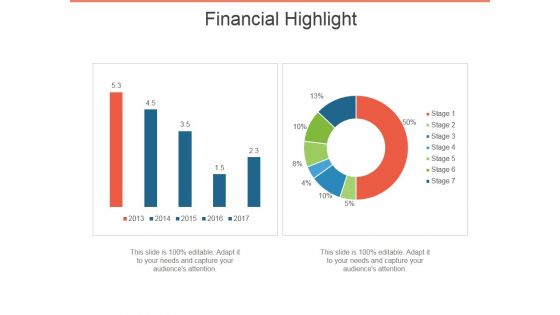
Financial Highlight Template 1 Ppt PowerPoint Presentation Ideas Themes
This is a financial highlight template 1 ppt powerpoint presentation ideas themes. This is a two stage process. The stages in this process are financial, highlight, business, bar graph, marketing.
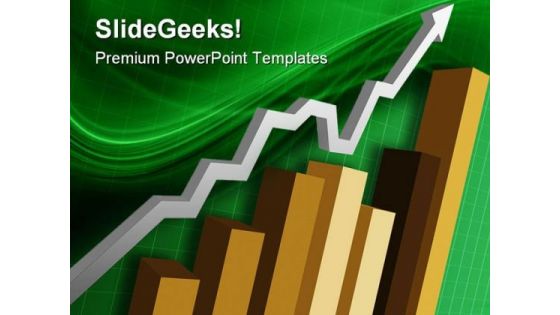
Business Bar Graph Arrow Success PowerPoint Templates And PowerPoint Backgrounds 0511
Microsoft PowerPoint Template and Background with a business chart/graph showing the decline of the financial money market
Business Bar Graph Arrow Success PowerPoint Themes And PowerPoint Slides 0511
Microsoft PowerPoint Theme and Slide with a business chart/graph showing the decline of the financial money market
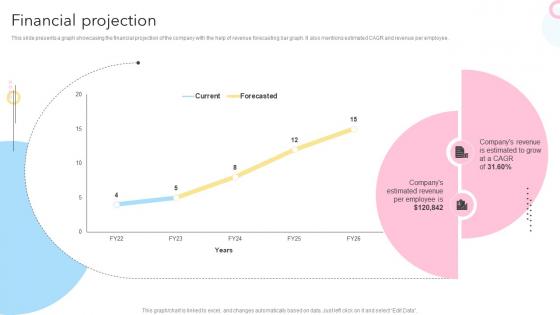
Financial Projection Maternity Support Platform Pitch Deck
This slide presents a graph showcasing the financial projection of the company with the help of revenue forecasting bar graph. It also mentions estimated CAGR and revenue per employee.Slidegeeks is here to make your presentations a breeze with Financial Projection Maternity Support Platform Pitch Deck With our easy-to-use and customizable templates, you can focus on delivering your ideas rather than worrying about formatting. With a variety of designs to choose from, you are sure to find one that suits your needs. And with animations and unique photos, illustrations, and fonts, you can make your presentation pop. So whether you are giving a sales pitch or presenting to the board, make sure to check out Slidegeeks first
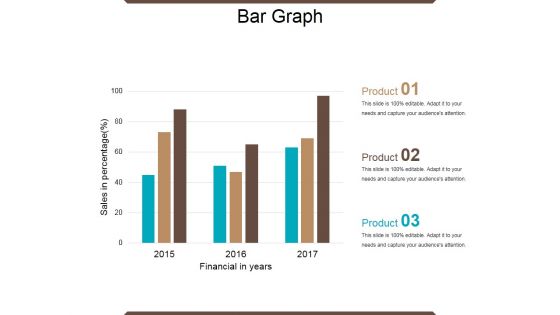
Bar Graph Ppt PowerPoint Presentation Ideas Graphic Tips
This is a bar graph ppt powerpoint presentation ideas graphic tips. This is a three stage process. The stages in this process are financial year, sales in percentage, product, bar graph, growth.

Financial Ppt Model Pictures PDF
Deliver and pitch your topic in the best possible manner with this financial ppt model pictures pdf. Use them to share invaluable insights on target, actual and impress your audience. This template can be altered and modified as per your expectations. So, grab it now.

Financial Ppt Inspiration Layouts PDF
Deliver and pitch your topic in the best possible manner with this financial ppt inspiration layouts pdf. Use them to share invaluable insights on minimum, medium, maximum and impress your audience. This template can be altered and modified as per your expectations. So, grab it now.
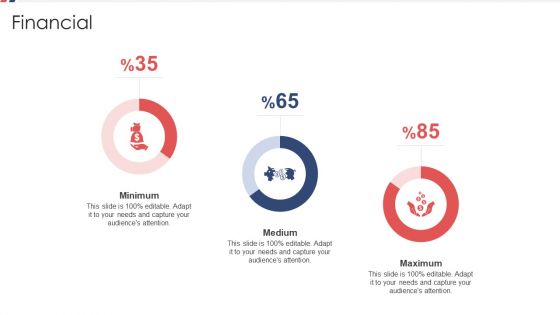
Financial Ppt Show Diagrams PDF
Deliver an awe inspiring pitch with this creative financial ppt show diagrams pdf bundle. Topics like minimum, medium, maximum can be discussed with this completely editable template. It is available for immediate download depending on the needs and requirements of the user.

Business Diagram Eight Staged Circular Puzzle Bar Graph Presentation Template
This Power Point template has been crafted with graphic of eight staged circular puzzle and bar graph. This PPT contains the financial result analysis related concept. Use this PPT for your business and success related presentations.
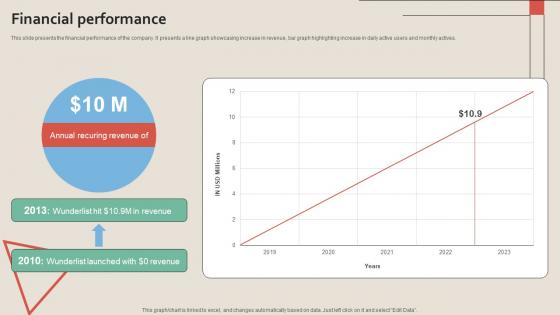
Financial Performance Work Management Tool Pitch Deck
This slide presents the financial performance of the company. It presents a line graph showcasing increase in revenue, bar graph highlighting increase in daily active users and monthly actives.Present like a pro with Financial Performance Work Management Tool Pitch Deck. Create beautiful presentations together with your team, using our easy-to-use presentation slides. Share your ideas in real-time and make changes on the fly by downloading our templates. So whether you are in the office, on the go, or in a remote location, you can stay in sync with your team and present your ideas with confidence. With Slidegeeks presentation got a whole lot easier. Grab these presentations today.

Financial Projection Medical Research Organization Pitch Deck
This slide presents graphs showcasing statistics relating to the financial projection of the company in the coming years. It includes revenue, gross profit, EBITDA, and total customers by types.Present like a pro with Financial Projection Medical Research Organization Pitch Deck. Create beautiful presentations together with your team, using our easy-to-use presentation slides. Share your ideas in real-time and make changes on the fly by downloading our templates. So whether you are in the office, on the go, or in a remote location, you can stay in sync with your team and present your ideas with confidence. With Slidegeeks presentation got a whole lot easier. Grab these presentations today.
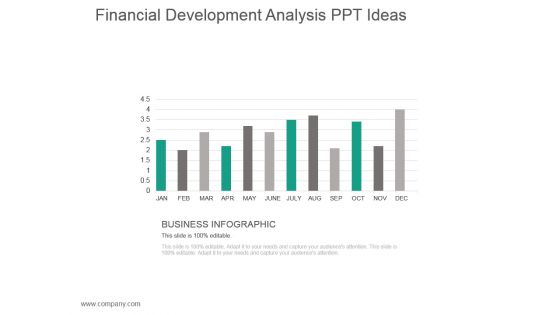
Financial Development Analysis Ppt Ideas
This is a financial development analysis ppt ideas. This is a twelve stage process. The stages in this process are business infographic.

Bar Graph Ppt PowerPoint Presentation Examples
This is a bar graph ppt powerpoint presentation examples. This is a three stage process. The stages in this process are business, strategy, marketing, analysis, finance, bar graph.

Bar Graph Ppt PowerPoint Presentation Outline Aids
This is a bar graph ppt powerpoint presentation outline aids. This is a four stage process. The stages in this process are bar, graph, finance, marketing, strategy.

Comparability Of Financial Statements Diagram
This is a comparability of financial statements diagram. This is a four stage process. The stages in this process are statement of financial position, statements of comprehensive income, statements of cash flows, statements of changes in equity.

Financial Market Business PowerPoint Presentation
Discover Decisive Moments With Our Financial Market Business Powerpoint Presentation Powerpoint Templates. They Help Make That Crucial Difference.

Bar Graph Ppt PowerPoint Presentation Professional Gridlines
This is a bar graph ppt powerpoint presentation professional gridlines. This is a three stage process. The stages in this process are bar, marketing, strategy, planning, growth.
Financial Ppt PowerPoint Presentation Samples
This is a financial ppt powerpoint presentation samples. This is a six stage process. The stages in this process are business, finance, marketing, icons, strategy.

Successful Business Men 3d Lifting Graph PowerPoint Slides
We present our successful business men 3d lifting graph PowerPoint Slides.Download our Business PowerPoint Templates because Our PowerPoint Templates and Slides are aesthetically designed to attract attention. We gaurantee that they will grab all the eyeballs you need. Download and present our People PowerPoint Templates because Our PowerPoint Templates and Slides are created by a hardworking bunch of busybees. Always flitting around with solutions gauranteed to please. Present our Finance PowerPoint Templates because It is Aesthetically crafted by artistic young minds. Our PowerPoint Templates and Slides are designed to display your dexterity. Download our Success PowerPoint Templates because You can Connect the dots. Fan expectations as the whole picture emerges. Download and present our Marketing PowerPoint Templates because You are well armed with penetrative ideas. Our PowerPoint Templates and Slides will provide the gunpowder you need.Use these PowerPoint slides for presentations relating to 3d, abstract, accounting, achievement, advantage, bar, bar graph, bar-chart, bar-graph, business, cartoon, chart, company, concept, corporate, financial, graph, growth, help, icon, idiom, lifting, lifting the bar, market, meeting, men, metaphor, partnership, people, performance, presentation, progress, report, strength, team, teamwork. The prominent colors used in the PowerPoint template are Red, Yellow, Green.
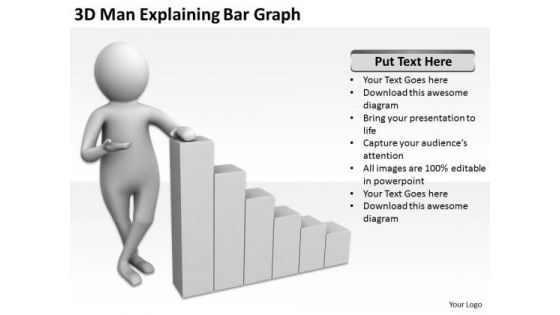
Business People Walking 3d Man Explaining Bar Graph PowerPoint Templates
We present our business people walking 3d man explaining bar graph PowerPoint templates.Use our Finance PowerPoint Templates because Our PowerPoint Templates and Slides are Clear and concise. Use them and dispel any doubts your team may have. Download our Success PowerPoint Templates because Our PowerPoint Templates and Slides has conjured up a web of all you need with the help of our great team. Use them to string together your glistening ideas. Download our Business PowerPoint Templates because You are working at that stage with an air of royalty. Let our PowerPoint Templates and Slides be the jewels in your crown. Download and present our Sales PowerPoint Templates because Our PowerPoint Templates and Slides will bullet point your ideas. See them fall into place one by one. Use our Shapes PowerPoint Templates because Our PowerPoint Templates and Slides are specially created by a professional team with vast experience. They diligently strive to come up with the right vehicle for your brilliant Ideas. Use these PowerPoint slides for presentations relating to 3d, Accounting, Activity, Analysis, Analyst, Analytics, Background, Bar, Business, Businessman, Chart, Concept, Corporate, Diagram, Earn, Economy, Finance, Financial, Graph, Graphic, Grow, Growth, Illustration, Income, Investing, Investment, Isolated, Man, Manager, Market, Moving, People, Person, Profit, Progress, Prosperity, Red, Sales, Statistic, Stats, Strategy, Succeed, Success. The prominent colors used in the PowerPoint template are White, Gray, Black.

Bar Graph Ppt PowerPoint Presentation Styles
This is a bar graph ppt powerpoint presentation styles. This is a five stage process. The stages in this process are bar graph, business, marketing, strategy, growth.
Bar Graph Ppt PowerPoint Presentation Designs
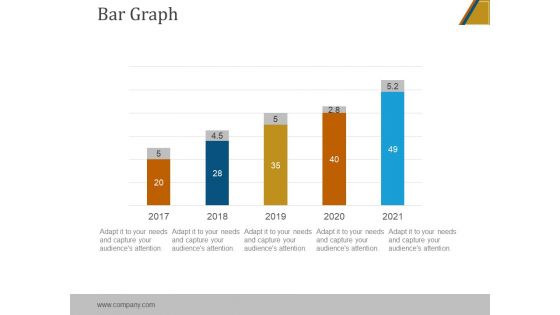
This is a bar graph ppt powerpoint presentation designs. This is a five stage process. The stages in this process are bar graph, marketing, analysis, strategy, business.

Bar Graph Ppt PowerPoint Presentation Portfolio
This is a bar graph ppt powerpoint presentation portfolio. This is a five stage process. The stages in this process are bar graph, marketing, analysis, finance, business, investment.
Bar Graph Ppt PowerPoint Presentation Slide
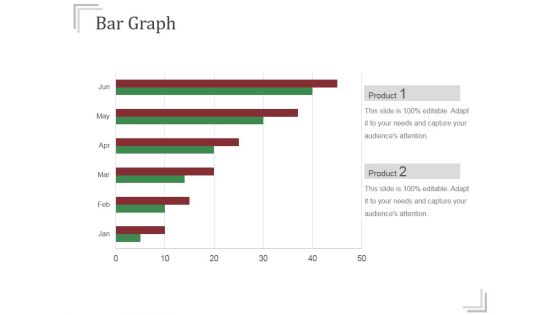
This is a bar graph ppt powerpoint presentation slide. This is a six stage process. The stages in this process are bar graph, analysis, marketing, strategy, business, finance.
Bar Graph Ppt PowerPoint Presentation Slides Format
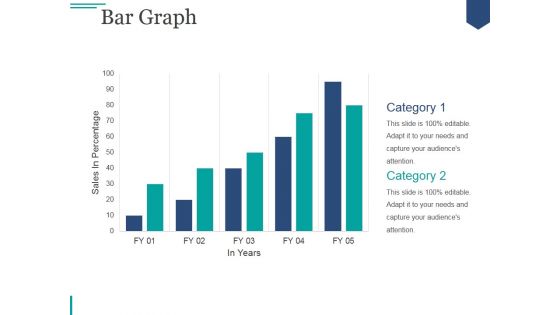
This is a bar graph ppt powerpoint presentation slides format. This is a two stage process. The stages in this process are business, marketing, growth, planning, sales plan.

Financial Projections Work Management Tool Pitch Deck
This slide presents the financial projection of the company with the help of line graphs. It showcases projected increase in company revenue and growth of EBITDA.Slidegeeks is here to make your presentations a breeze with Financial Projections Work Management Tool Pitch Deck With our easy-to-use and customizable templates, you can focus on delivering your ideas rather than worrying about formatting. With a variety of designs to choose from, you are sure to find one that suits your needs. And with animations and unique photos, illustrations, and fonts, you can make your presentation pop. So whether you are giving a sales pitch or presenting to the board, make sure to check out Slidegeeks first
Bar Graph Ppt PowerPoint Presentation Styles Picture
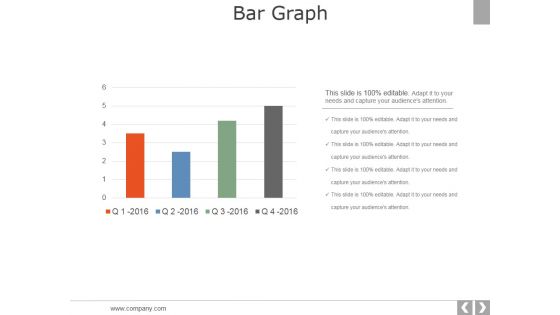
This is a bar graph ppt powerpoint presentation styles picture. This is a four stage process. The stages in this process are business, strategy, marketing, analysis, chart and graph, bar graph.

Bar Graph Ppt PowerPoint Presentation Model Layouts
This is a bar graph ppt powerpoint presentation model layouts. This is a two stage process. The stages in this process are business, product, bar graph, growth, management.
Financial Projection Biopharma Research Organization Pitch Deck
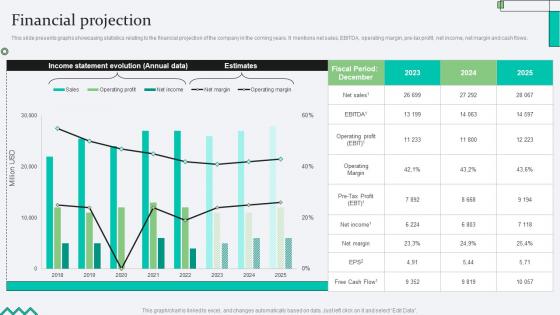
This slide presents graphs showcasing statistics relating to the financial projection of the company in the coming years. It mentions net sales, EBITDA, operating margin, pre-tax profit, net income, net margin and cash flows. Slidegeeks is here to make your presentations a breeze with Financial Projection Biopharma Research Organization Pitch Deck With our easy-to-use and customizable templates, you can focus on delivering your ideas rather than worrying about formatting. With a variety of designs to choose from, you are sure to find one that suits your needs. And with animations and unique photos, illustrations, and fonts, you can make your presentation pop. So whether you are giving a sales pitch or presenting to the board, make sure to check out Slidegeeks first

Bar Graph Ppt PowerPoint Presentation Templates
This is a bar graph ppt powerpoint presentation templates. This is a four stage process. The stages in this process are arrows, business, marketing, strategy, growth, graphic.

Bar Graph Ppt PowerPoint Presentation Layout
This is a bar graph ppt powerpoint presentation layout. This is a three stage process. The stages in this process are business, marketing, management, analysis, growth.
Bar Graph Ppt PowerPoint Presentation Outline Slides
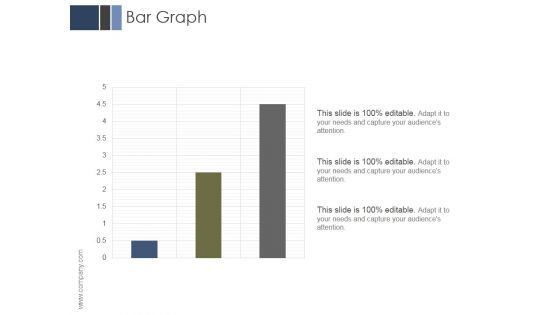
This is a bar graph ppt powerpoint presentation outline slides. This is a three stage process. The stages in this process are business, marketing, management, analysis, growth.
Bar Graph Ppt PowerPoint Presentation Microsoft
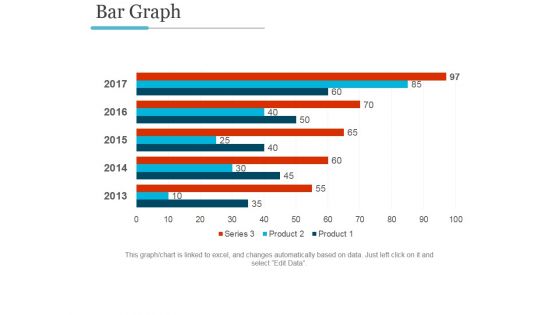
This is a bar graph ppt powerpoint presentation microsoft. This is a five stage process. The stages in this process are bar graph, finance, marketing, strategy, analysis, business.

Bar Graph Ppt PowerPoint Presentation Gallery Skills
This is a bar graph ppt powerpoint presentation gallery skills. This is a four stage process. The stages in this process are in percentage, bar graph, business, marketing, product.
Bar Graph Ppt PowerPoint Presentation Professional Guide
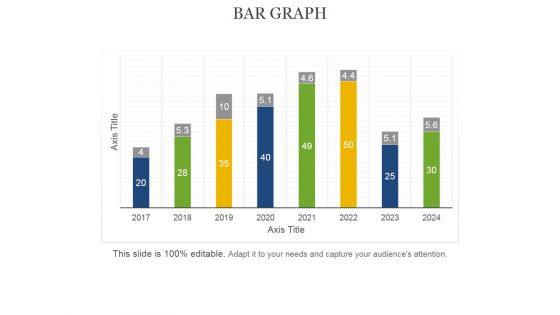
This is a bar graph ppt powerpoint presentation professional guide. This is a eight stage process. The stages in this process are axis title, bar graph, business, marketing, management.

Bar Graph Ppt PowerPoint Presentation Layouts Pictures
This is a bar graph ppt powerpoint presentation layouts pictures. This is a four stage process. The stages in this process are fire, earthquake, axis title, in percentage.
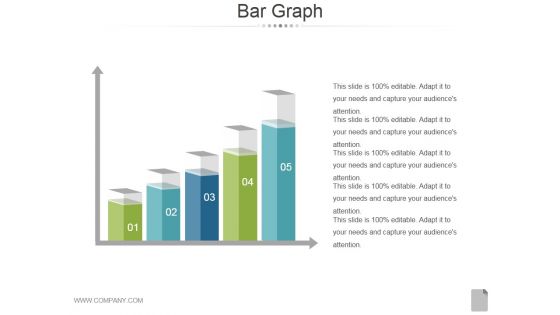
Bar Graph Ppt PowerPoint Presentation Guide
This is a bar graph ppt powerpoint presentation guide. This is a five stage process. The stages in this process are bar graph, finance, marketing, analysis, strategy, business.

Bar Graph Ppt PowerPoint Presentation Layouts Good
This is a bar graph ppt powerpoint presentation layouts good. This is a two stage process. The stages in this process are bar graph, finance, success, strategy, management.
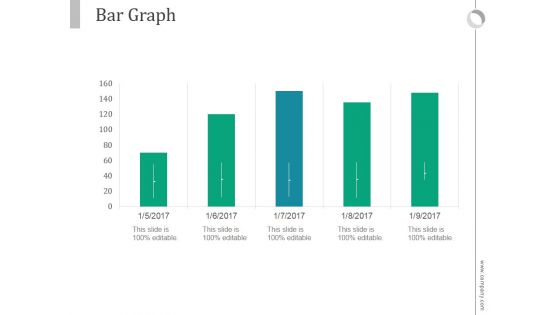
Bar Graph Ppt PowerPoint Presentation Model
This is a bar graph ppt powerpoint presentation model. This is a five stage process. The stages in this process are business, marketing, bar slides, management, finance.

Bar Graph Ppt PowerPoint Presentation Themes
This is a bar graph ppt powerpoint presentation themes. This is a three stage process. The stages in this process are business, marketing, strategy, success, management.
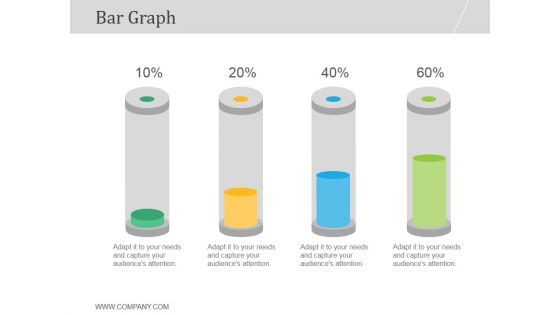
Bar Graph Ppt PowerPoint Presentation Good
This is a bar graph ppt powerpoint presentation good. This is a four stage process. The stages in this process are bar graph, growth, business, marketing, management, percentage.
Bar Graph Ppt PowerPoint Presentation Icon Diagrams
This is a bar graph ppt powerpoint presentation icon diagrams. This is a nine stage process. The stages in this process are product, bar graph, marketing, success.
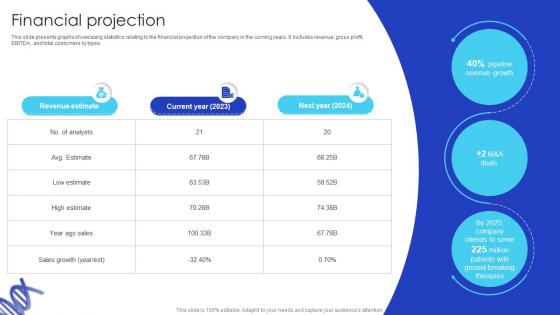
Financial Projection Biotech Firm Pitch Deck
This slide presents graphs showcasing statistics relating to the financial projection of the company in the coming years. It includes revenue, gross profit, EBITDA, and total customers by types. Slidegeeks is here to make your presentations a breeze with Financial Projection Biotech Firm Pitch Deck With our easy-to-use and customizable templates, you can focus on delivering your ideas rather than worrying about formatting. With a variety of designs to choose from, you are sure to find one that suits your needs. And with animations and unique photos, illustrations, and fonts, you can make your presentation pop. So whether you are giving a sales pitch or presenting to the board, make sure to check out Slidegeeks first
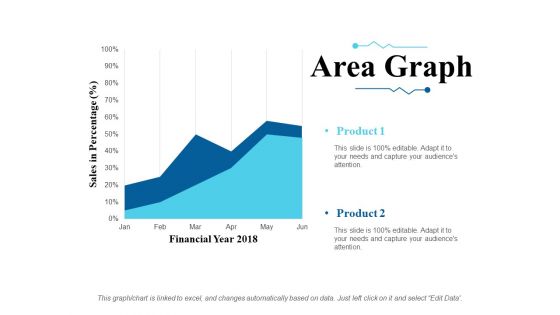
Area Graph Ppt PowerPoint Presentation Slides Ideas
This is a area graph ppt powerpoint presentation slides ideas. This is a two stage process. The stages in this process are sales in percentage, financial year, product.

Bar Graph Ppt PowerPoint Presentation Inspiration Slides
This is a bar graph ppt powerpoint presentation inspiration slides. This is a six stage process. The stages in this process are sales in percentage, financial year, product.

Bar Graph Ppt PowerPoint Presentation Infographics Templates
This is a bar graph ppt powerpoint presentation infographics templates. This is a two stage process. The stages in this process are product, financial years, sales in percentage.
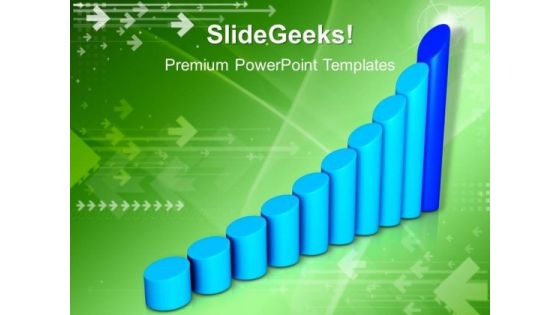
Bar Graph Business PowerPoint Templates And PowerPoint Themes 1012
Bar Graph Business PowerPoint Templates And PowerPoint Themes 1012-This PowerPoint Template shows the Bar Graph with increasing percentage which signifies the Financial Growth. The Template signifies the concept of business growth. The structure of our templates allows you to effectively highlight the key issues concerning the growth of your business. Our PPT images are so ideally designed that it reveals the very basis of our PPT template are an effective tool to make your clients understand.-Bar Graph Business PowerPoint Templates And PowerPoint Themes 1012-This PowerPoint template can be used for presentations relating to-Financial bar graph chart, technology, money, business, finance, marketing

Financial Dashboard For Month Closing Income And Expenses Ideas PDF
This slide illustrates facts and figures related to month end financials of a corporation. It includes income statement graph, profit margin, income and expenditure graph etc.Showcasing this set of slides titled Financial Dashboard For Month Closing Income And Expenses Ideas PDF The topics addressed in these templates are Accounts Receivable, Income Statement, Expenditure All the content presented in this PPT design is completely editable. Download it and make adjustments in color, background, font etc. as per your unique business setting.

 Home
Home