Financial Graphs
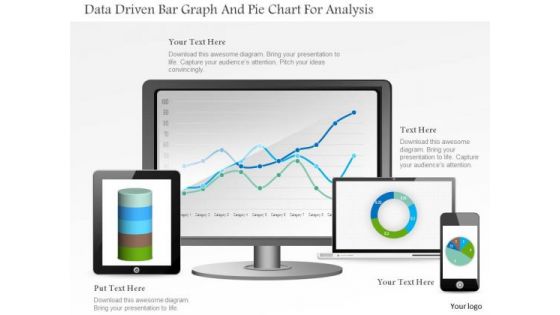
Business Diagram Data Driven Bar Graph And Pie Chart For Analysis PowerPoint Slide
This PowerPoint template displays technology gadgets with various business charts. Use this diagram slide, in your presentations to make business reports for statistical analysis. You may use this diagram to impart professional appearance to your presentations.
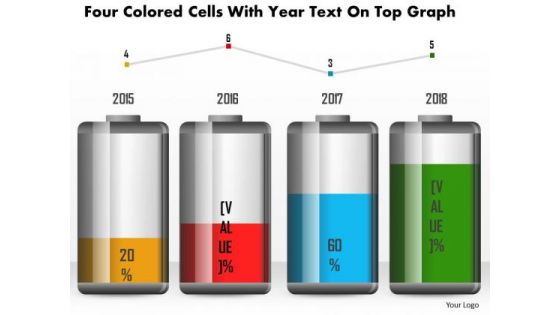
Business Diagram Four Colored Cells With Year Text On Top Graph PowerPoint Slide
This business diagram has been designed with battery cell graphic for business timeline. This slide can be used for business planning and management. Use this diagram for your business and success milestones related presentations.

Business Diagram Human Mind Diagram With Pie Graph For Representation PowerPoint Slide
This diagram displays human face graphic divided into sections. This section can be used for data display. Use this diagram to build professional presentations for your viewers.

Business Diagram Tablet With Pie And Business Bar Graph For Result Analysis PowerPoint Slide
This PowerPoint template displays technology gadgets with various business charts. Use this diagram slide, in your presentations to make business reports for statistical analysis. You may use this diagram to impart professional appearance to your presentations.
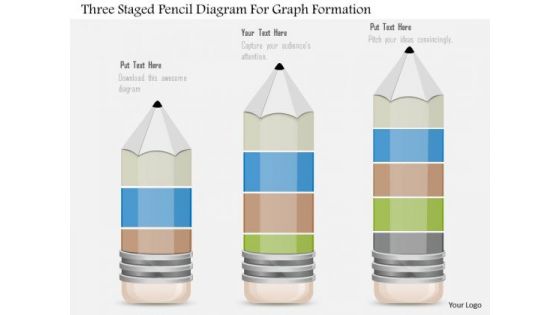
Business Diagram Three Staged Pencil Diagram For Graph Formation PowerPoint Slide
This business diagram displays set of pencils. This Power Point template has been designed to compare and present business data. Download this diagram to represent stages of business growth.
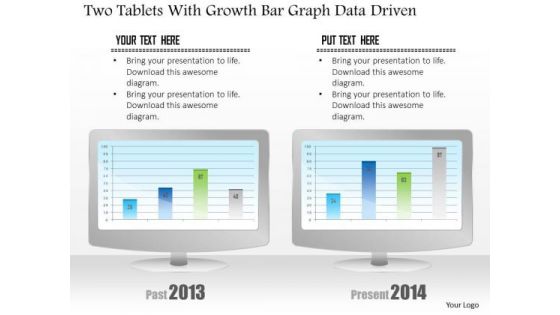
Business Diagram Two Tablets With Growth Bar Graph Data Driven PowerPoint Slide
This business diagram has been designed with comparative charts on tablets. This slide suitable for data representation. You can also use this slide to present business reports and information. Use this diagram to present your views in a wonderful manner.
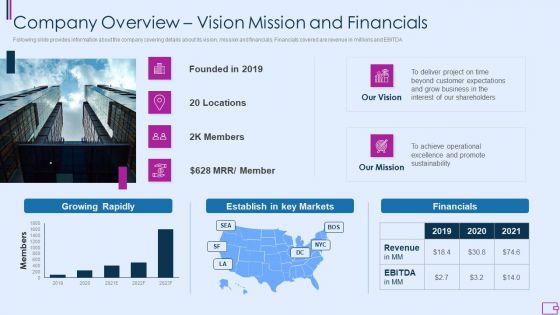
Capital Fundraising And Financial Forecast Pitch Deck Company Overview Vision Mission And Financials Elements PDF
Following slide provides information about the company covering details about its vision, mission and financials. Financials covered are revenue in millions and EBITDA. Deliver an awe inspiring pitch with this creative capital fundraising and financial forecast pitch deck company overview vision mission and financials elements pdf bundle. Topics like company overview vision mission and financials can be discussed with this completely editable template. It is available for immediate download depending on the needs and requirements of the user.
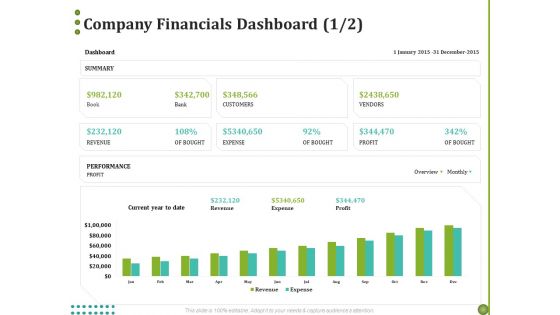
BPO Managing Enterprise Financial Transactions Company Financials Dashboard Profit Diagrams PDF
Presenting this set of slides with name bpo managing enterprise financial transactions company financials dashboard profit diagrams pdf. The topics discussed in these slide is company financials dashboard. This is a completely editable PowerPoint presentation and is available for immediate download. Download now and impress your audience.
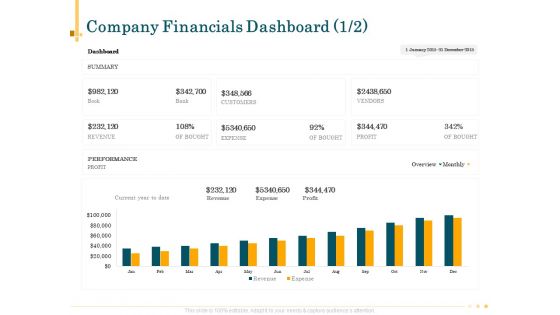
Outsource Bookkeeping Service Manage Financial Transactions Company Financials Dashboard Profit Information PDF
Presenting this set of slides with name outsource bookkeeping service manage financial transactions company financials dashboard profit information pdf. The topics discussed in these slide is company financials dashboard. This is a completely editable PowerPoint presentation and is available for immediate download. Download now and impress your audience.
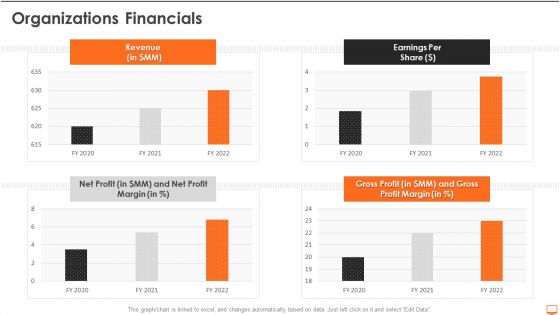
Financial Operational System Pitch Deck Organizations Financials Ppt Professional Aids PDF
Deliver an awe inspiring pitch with this creative financial operational system pitch deck organizations financials ppt professional aids pdf bundle. Topics like organizations financials can be discussed with this completely editable template. It is available for immediate download depending on the needs and requirements of the user.
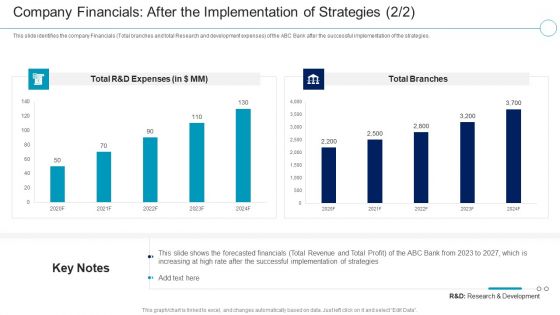
Financial Services Enterprise Transformation Company Financials After The Implementation Rules PDF
This slide identifies the company Financials Total branches and total Research and development expenses of the ABC Bank after the successful implementation of the strategies.Deliver and pitch your topic in the best possible manner with this Financial Services Enterprise Transformation Company Financials After The Implementation Rules PDF Use them to share invaluable insights on Company Financials After The Implementation Of Strategies and impress your audience. This template can be altered and modified as per your expectations. So, grab it now.

Outsource Bookkeeping Service Manage Financial Transactions Company Financials Dashboard Topics PDF
Presenting this set of slides with name outsource bookkeeping service manage financial transactions company financials dashboard topics pdf. The topics discussed in these slides are performance, revenue, expense, profit. This is a completely editable PowerPoint presentation and is available for immediate download. Download now and impress your audience.
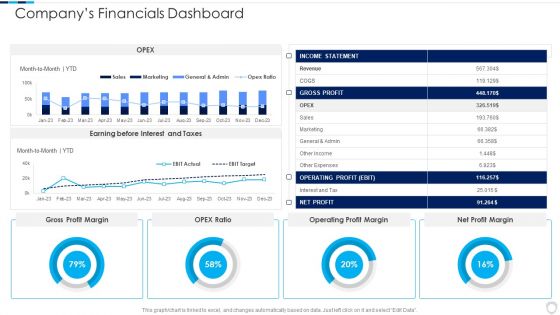
Financial Report Of An IT Firm Companys Financials Dashboard Infographics PDF
Deliver an awe inspiring pitch with this creative Financial Report Of An IT Firm Companys Financials Dashboard Infographics PDF bundle. Topics like Operating Profit, Gross Profit, Income Statement can be discussed with this completely editable template. It is available for immediate download depending on the needs and requirements of the user.

Financial Report Of An IT Firm Companys Geographic Financials And Revenue Split Elements PDF
The slide provides the companys revenue for last three years from its geographical segments North America, Europe, Asia, and Rest of the World.Deliver an awe inspiring pitch with this creative Financial Report Of An IT Firm Companys Geographic Financials And Revenue Split Elements PDF bundle. Topics like Companys Geographic, Financials Revenue can be discussed with this completely editable template. It is available for immediate download depending on the needs and requirements of the user.
Financial Report Of An IT Firm Companys Income Statement Financials Icons PDF
The slide provides the key financials revenue, operating income and margin, net income and margin from the companys income statement along with the basic details.Deliver an awe inspiring pitch with this creative Financial Report Of An IT Firm Companys Income Statement Financials Icons PDF bundle. Topics like Reported Strong, Operating Income, Operating Margin can be discussed with this completely editable template. It is available for immediate download depending on the needs and requirements of the user.
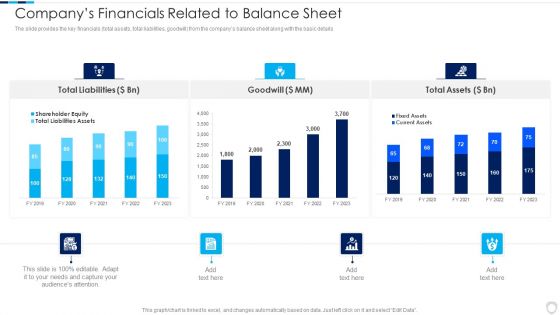
Financial Report Of An IT Firm Companys Financials Related To Balance Sheet Introduction PDF
The slide provides the key financials total assets, total liabilities, goodwill from the companys balance sheet along with the basic details.Deliver and pitch your topic in the best possible manner with this Financial Report Of An IT Firm Companys Financials Related To Balance Sheet Introduction PDF Use them to share invaluable insights on Total Liabilities, Total Assets, Liabilities Assets and impress your audience. This template can be altered and modified as per your expectations. So, grab it now.
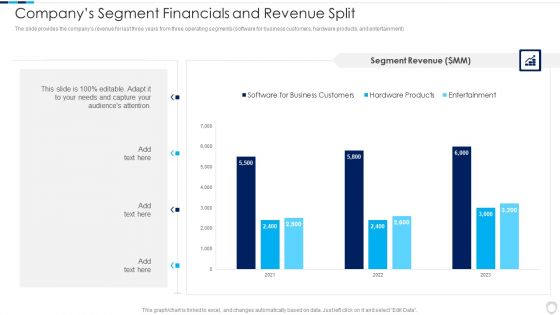
Financial Report Of An IT Firm Companys Segment Financials And Revenue Split Rules PDF
The slide provides the companys revenue for last three years from three operating segments software for business customers, hardware products, and entertainment.Deliver an awe inspiring pitch with this creative Financial Report Of An IT Firm Companys Segment Financials And Revenue Split Rules PDF bundle. Topics like Software Business, Customers Entertainment, Hardware Products can be discussed with this completely editable template. It is available for immediate download depending on the needs and requirements of the user.
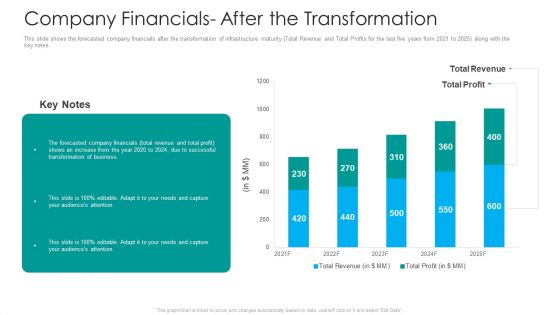
IT Facilities Maturity Framework For Strong Business Financial Position Company Financials After The Transformation Brochure PDF
This slide shows the forecasted company financials after the transformation of infrastructure maturity Total Revenue and Total Profits for the last five years from 2021 to 2025 along with the key notes. Deliver an awe inspiring pitch with this creative it facilities maturity framework for strong business financial position company financials after the transformation brochure pdf bundle. Topics like business, financials, revenue can be discussed with this completely editable template. It is available for immediate download depending on the needs and requirements of the user.
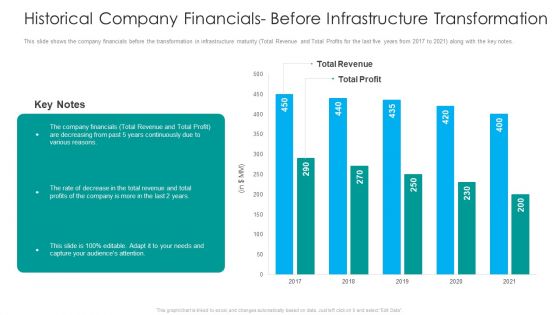
IT Facilities Maturity Framework For Strong Business Financial Position Historical Company Financials Before Microsoft PDF
This slide shows the company financials before the transformation in infrastructure maturity Total Revenue and Total Profits for the last five years from 2017 to 2021 along with the key notes. Deliver and pitch your topic in the best possible manner with this it facilities maturity framework for strong business financial position historical company financials before microsoft pdf. Use them to share invaluable insights on historical company financials before infrastructure transformation and impress your audience. This template can be altered and modified as per your expectations. So, grab it now.
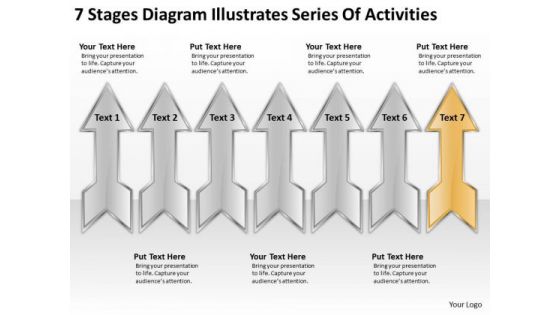
Stages Diagram Illustrates Series Of Activities Business Financial Planning PowerPoint Slides
We present our stages diagram illustrates series of activities business financial planning PowerPoint Slides.Use our Arrows PowerPoint Templates because You can Be the star of the show with our PowerPoint Templates and Slides. Rock the stage with your ideas. Use our Leadership PowerPoint Templates because you should Experience excellence with our PowerPoint Templates and Slides. They will take your breath away. Download our Shapes PowerPoint Templates because It will get your audience in sync. Download our Business PowerPoint Templates because They will bring a lot to the table. Their alluring flavours will make your audience salivate. Download and present our Process and Flows PowerPoint Templates because Our PowerPoint Templates and Slides will provide you a launch platform. Give a lift off to your ideas and send them into orbit.Use these PowerPoint slides for presentations relating to abstract, achievement, action, arrow, arrowhead, aspiration, background, business, career, competition, concept, development, direction, dots, effect, financial, forecast, forward, graph, group, growth, idea, increase, investment, leader, leadership, moving, onwards, plan, prediction, price, profit, progress, property, sales, solution, speed, style, success, symbol, target, teamwork, vector, winner Activities. The prominent colors used in the PowerPoint template are Gray, Yellow, Black. Presenters tell us our stages diagram illustrates series of activities business financial planning PowerPoint Slides are specially created by a professional team with vast experience. They diligently strive to come up with the right vehicle for your brilliant Ideas. PowerPoint presentation experts tell us our action PowerPoint templates and PPT Slides will impress their bosses and teams. People tell us our stages diagram illustrates series of activities business financial planning PowerPoint Slides will generate and maintain the level of interest you desire. They will create the impression you want to imprint on your audience. You can be sure our career PowerPoint templates and PPT Slides are designed by a team of presentation professionals. The feedback we get is that our stages diagram illustrates series of activities business financial planning PowerPoint Slides are designed by professionals You can be sure our business PowerPoint templates and PPT Slides will help you be quick off the draw. Just enter your specific text and see your points hit home.
Bar Graph For Four Years Business Result Analysis Ppt PowerPoint Presentation Icon Show
Presenting this set of slides with name bar graph for four years business result analysis ppt powerpoint presentation icon show. The topics discussed in these slides are financial targets, financial goals, growth profitability. This is a completely editable PowerPoint presentation and is available for immediate download. Download now and impress your audience.

Business Diagram Four Staged Bar Graph With Percentage Value Presentation Template
Four staged bar graph with percentage value has been used to craft this power point template. This PPT contains the concept of making financial timeline and result analysis. This PPT can be used for business and finance related presentations.

Stock Market Trend Dollar Sign On Bar Graph Ppt Powerpoint Presentation Show Deck
This is a stock market trend dollar sign on bar graph ppt powerpoint presentation show deck. This is a four stage process. The stages in this process are stock market, financial market, bull market.

Stock Trading Graph With Bull Showing Upward Trend Ppt Powerpoint Presentation Pictures Outfit
This is a stock trading graph with bull showing upward trend ppt powerpoint presentation pictures outfit. This is a four stage process. The stages in this process are stock market, financial market, bull market.
Growth Arrow On Bar Graph Icon Ppt Powerpoint Presentation Infographic Template Clipart
This is a growth arrow on bar graph icon ppt powerpoint presentation infographic template clipart. This is a three stage process. The stages in this process are financial statements icon, accounting ratio icon, balance sheet icon.
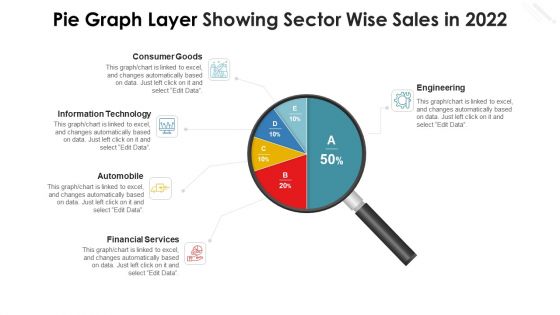
Pie Graph Layer Showing Sector Wise Sales In 2022 Microsoft PDF
Pitch your topic with ease and precision using this pie graph layer showing sector wise sales in 2022 microsoft pdf. This layout presents information on consumer goods, information technology, automobile, financial services, engineering. It is also available for immediate download and adjustment. So, changes can be made in the color, design, graphics or any other component to create a unique layout.
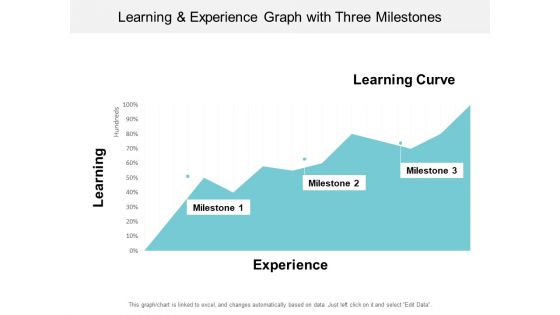
Learning And Experience Graph With Three Milestones Ppt PowerPoint Presentation Model Introduction
This is a learning and experience graph with three milestones ppt powerpoint presentation model introduction. This is a three stage process. The stages in this process are experience curve, learning curve.
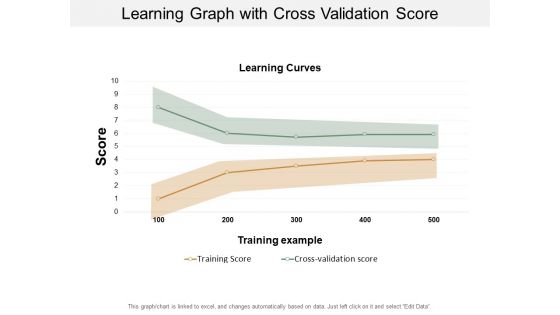
Learning Graph With Cross Validation Score Ppt PowerPoint Presentation Visual Aids Inspiration
This is a learning graph with cross validation score ppt powerpoint presentation visual aids inspiration. This is a two stage process. The stages in this process are experience curve, learning curve.

Learning Progress Graph Slow Steep And Plateau Ppt PowerPoint Presentation Professional Gallery
This is a learning progress graph slow steep and plateau ppt powerpoint presentation professional gallery. This is a three stage process. The stages in this process are experience curve, learning curve.
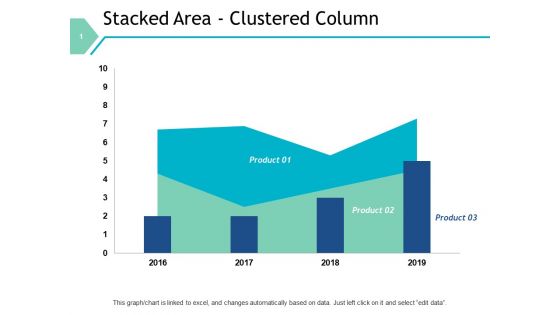
Stacked Area Clustered Column Graph Ppt PowerPoint Presentation File Designs Download
This is a stacked area clustered column graph ppt powerpoint presentation file designs download. This is a three stage process. The stages in this process are finance, marketing, management, investment, analysis.

Income Statement Graph With Closing Costs Ppt PowerPoint Presentation Gallery Example Topics PDF
Presenting this set of slides with name income statement graph with closing costs ppt powerpoint presentation gallery example topics pdf. The topics discussed in these slides are revenue, buy closing costs, operating costs, financial costs, buy broker commission, in house sale costs, sale closing costs, margin. This is a completely editable PowerPoint presentation and is available for immediate download. Download now and impress your audience.
Bar Graph Icon For Research Analysis Ppt PowerPoint Presentation Summary Portfolio
Presenting this set of slides with name bar graph icon for research analysis ppt powerpoint presentation summary portfolio. This is a three stage process. The stages in this process are data visualization icon, research analysis, business focus. This is a completely editable PowerPoint presentation and is available for immediate download. Download now and impress your audience.

Bar Graph Companys Business Model Canvas Ppt PowerPoint Presentation Visual Aids Model
This is a bar graph companys business model canvas ppt powerpoint presentation visual aids model. This is a three stage process. The stages in this process are bar graph, finance, marketing, strategy, analysis, business.

Graph Showing Technical Analysis Of Stock Trading Ppt PowerPoint Presentation Infographic Template Portrait PDF
Presenting this set of slides with name graph showing technical analysis of stock trading ppt powerpoint presentation infographic template portrait pdf. This is a three stage process. The stages in this process are graph showing technical analysis of stock trading. This is a completely editable PowerPoint presentation and is available for immediate download. Download now and impress your audience.

Waterfall Graph Showing Sales Expenses Revenue And Taxes Ppt PowerPoint Presentation Pictures Summary
This is a waterfall graph showing sales expenses revenue and taxes ppt powerpoint presentation pictures summary. This is a three stage process. The stages in this process are profit and loss, balance sheet, income statement, benefit and loss.
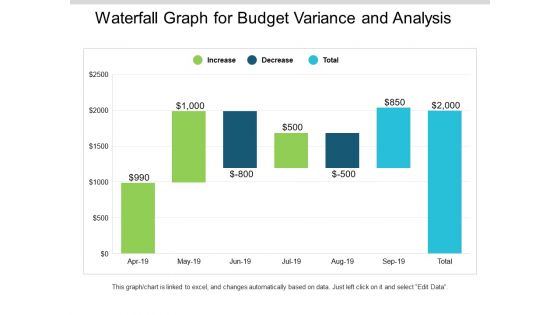
Waterfall Graph For Budget Variance And Analysis Ppt PowerPoint Presentation Slides Mockup
This is a waterfall graph for budget variance and analysis ppt powerpoint presentation slides mockup. This is a three stage process. The stages in this process are profit and loss, balance sheet, income statement, benefit and loss.

Waterfall Graph Summarize Budget 2018 To 2019 Ppt PowerPoint Presentation Summary Slides
This is a waterfall graph summarize budget 2018 to 2019 ppt powerpoint presentation summary slides. This is a three stage process. The stages in this process are profit and loss, balance sheet, income statement, benefit and loss.
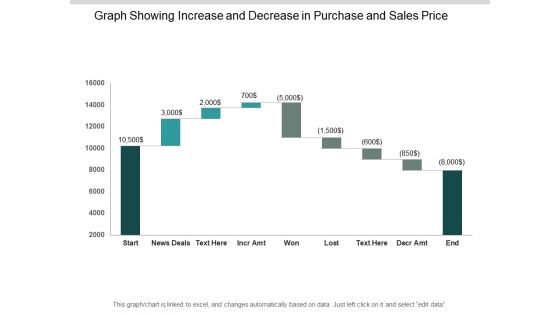
Graph Showing Increase And Decrease In Purchase And Sales Price Ppt PowerPoint Presentation Outline Gallery
This is a graph showing increase and decrease in purchase and sales price ppt powerpoint presentation outline gallery. This is a nine stage process. The stages in this process are sales waterfall, waterfall chart, business.

Sales Graph Showing Payouts Losses And Wins Ppt PowerPoint Presentation Pictures Designs Download
This is a sales graph showing payouts losses and wins ppt powerpoint presentation pictures designs download. This is a eight stage process. The stages in this process are sales waterfall, waterfall chart, business.

Waterfall Graph For Income And Expense Analysis Ppt PowerPoint Presentation File Deck
This is a waterfall graph for income and expense analysis ppt powerpoint presentation file deck. This is a eight stage process. The stages in this process are sales waterfall, waterfall chart, business.
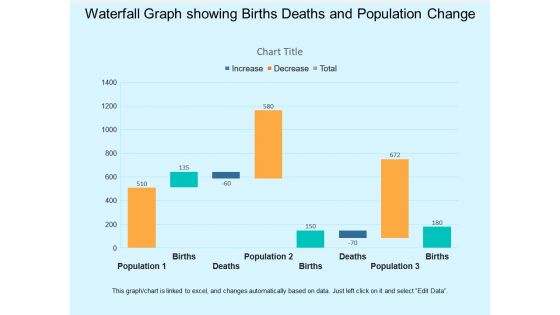
Waterfall Graph Showing Births Deaths And Population Change Ppt PowerPoint Presentation Infographic Template Visual Aids
This is a waterfall graph showing births deaths and population change ppt powerpoint presentation infographic template visual aids. This is a three stage process. The stages in this process are profit and loss, balance sheet, income statement, benefit and loss.
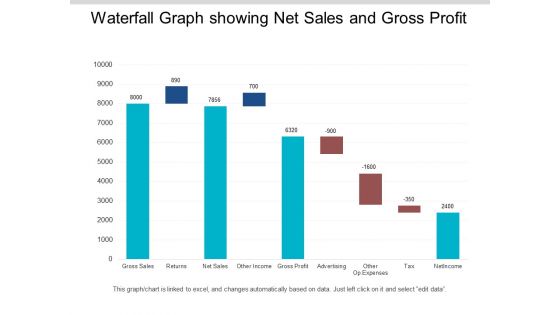
Waterfall Graph Showing Net Sales And Gross Profit Ppt PowerPoint Presentation Infographics Format
This is a waterfall graph showing net sales and gross profit ppt powerpoint presentation infographics format. This is a three stage process. The stages in this process are profit and loss, balance sheet, income statement, benefit and loss.
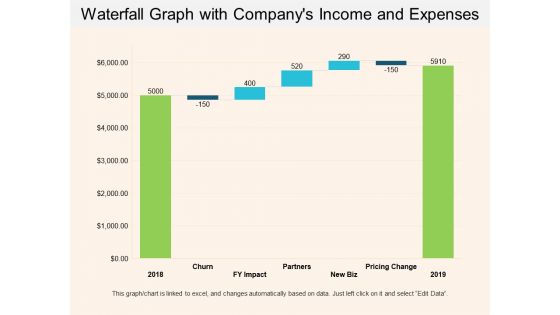
Waterfall Graph With Companys Income And Expenses Ppt PowerPoint Presentation Show Example Introduction
This is a waterfall graph with companys income and expenses ppt powerpoint presentation show example introduction. This is a three stage process. The stages in this process are profit and loss, balance sheet, income statement, benefit and loss.
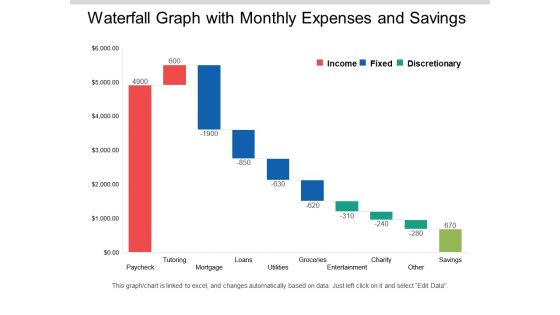
Waterfall Graph With Monthly Expenses And Savings Ppt PowerPoint Presentation Layouts Clipart Images
This is a waterfall graph with monthly expenses and savings ppt powerpoint presentation layouts clipart images. This is a three stage process. The stages in this process are profit and loss, balance sheet, income statement, benefit and loss.
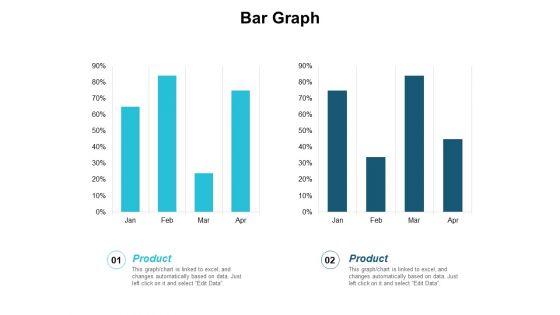
Bar Graph Finance Planning Ppt PowerPoint Presentation Infographic Template Master Slide
This is a bar graph finance planning ppt powerpoint presentation infographic template master slide. This is a two stage process. The stages in this process are finance, analysis, business, investment, marketing.
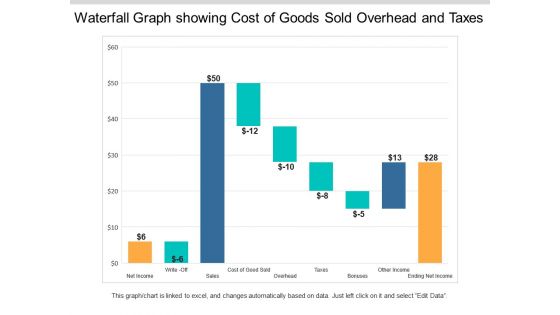
Waterfall Graph Showing Cost Of Goods Sold Overhead And Taxes Ppt PowerPoint Presentation Styles Example Topics
This is a waterfall graph showing cost of goods sold overhead and taxes ppt powerpoint presentation styles example topics. This is a three stage process. The stages in this process are profit and loss, balance sheet, income statement, benefit and loss.

Current And Quick Ratio Comparison Graph For Liquidity Assessment Structure PDF
This slide showcases current and quick ratio graph that can help to evaluate companys liquidity and and assess the company abilities to pay off debt. It also showcases comparison of ratio with previous financial year. Showcasing this set of slides titled Current And Quick Ratio Comparison Graph For Liquidity Assessment Structure PDF. The topics addressed in these templates are Short Term Debt, Delayed Payments, Cash Shortage. All the content presented in this PPT design is completely editable. Download it and make adjustments in color, background, font etc. as per your unique business setting.

6 Year Revenue Declining Graph Ppt PowerPoint Presentation Outline Sample PDF
This slide shows the revenues of the company over the last years to have a clear idea of organization growth and financial status . It includes the 6 year 2017 to 2022 revenue earned by the company.Showcasing this set of slides titled 6 Year Revenue Declining Graph Ppt PowerPoint Presentation Outline Sample PDF. The topics addressed in these templates are Revenue Company, Highest Comparison, Conditions Restrictions. All the content presented in this PPT design is completely editable. Download it and make adjustments in color, background, font etc. as per your unique business setting.
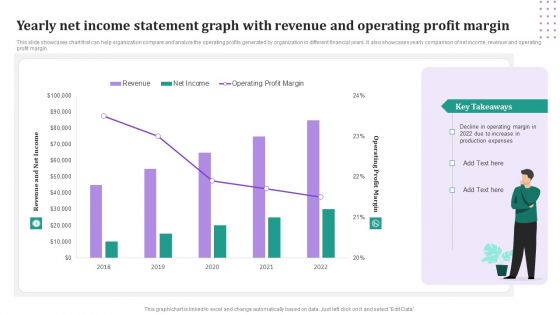
Yearly Net Income Statement Graph With Revenue And Operating Profit Margin Download PDF
This slide showcases chart that can help organization compare and analyze the operating profits generated by organization in different financial years. It also showcases yearly comparison of net income, revenue and operating profit margin. Pitch your topic with ease and precision using this Yearly Net Income Statement Graph With Revenue And Operating Profit Margin Download PDF. This layout presents information on Revenue, Net Income, Operating Profit Margin. It is also available for immediate download and adjustment. So, changes can be made in the color, design, graphics or any other component to create a unique layout.
Graph For Money Flow Assessment With Magnifying Glass Ppt PowerPoint Presentation Gallery Design Templates PDF
Presenting this set of slides with name graph for money flow assessment with magnifying glass ppt powerpoint presentation gallery design templates pdf. This is a three stage process. The stages in this process are graph for money flow assessment with magnifying glass. This is a completely editable PowerPoint presentation and is available for immediate download. Download now and impress your audience.
Money Flow Liquidity Icon With Dollar Symbol And Graph Formats PDF
Presenting money flow liquidity icon with dollar symbol and graph formats pdf to dispense important information. This template comprises four stages. It also presents valuable insights into the topics including money flow liquidity icon with dollar symbol and graph. This is a completely customizable PowerPoint theme that can be put to use immediately. So, download it and address the topic impactfully.

Bar Graph Showing Growth In Money Flow Ppt PowerPoint Presentation File Show PDF
Presenting this set of slides with name bar graph showing growth in money flow ppt powerpoint presentation file show pdf. This is a three stage process. The stages in this process are bar graph showing growth in money flow. This is a completely editable PowerPoint presentation and is available for immediate download. Download now and impress your audience.
Bar Graph Showing Negative Trend Ppt PowerPoint Presentation Summary Master Slide
Presenting this set of slides with name bar graph showing negative trend ppt powerpoint presentation summary master slide. This is a one stage process. The stages in this process are bar graph showing negative trend. This is a completely editable PowerPoint presentation and is available for immediate download. Download now and impress your audience.
Bar Graph Analyzing Company Performance Vector Icon Ppt PowerPoint Presentation Ideas Slides PDF
Presenting this set of slides with name bar graph analyzing company performance vector icon ppt powerpoint presentation ideas slides pdf. This is a three stage process. The stages in this process are bar graph analyzing company performance vector icon. This is a completely editable PowerPoint presentation and is available for immediate download. Download now and impress your audience.
Bar Graph Showing Business Performance With Downward Arrow Ppt PowerPoint Presentation Show Format Ideas PDF
Presenting this set of slides with name bar graph showing business performance with downward arrow ppt powerpoint presentation show format ideas pdf. This is a three stage process. The stages in this process are bar graph showing business performance with downward arrow. This is a completely editable PowerPoint presentation and is available for immediate download. Download now and impress your audience.
Downward Arrow Trend Graph Vector Icon Ppt PowerPoint Presentation Pictures PDF
Presenting this set of slides with name downward arrow trend graph vector icon ppt powerpoint presentation pictures pdf. This is a three stage process. The stages in this process are downward arrow trend graph vector icon. This is a completely editable PowerPoint presentation and is available for immediate download. Download now and impress your audience.
Bar Graph Showing Business Loss Vector Icon Ppt PowerPoint Presentation Gallery Example Topics PDF
Presenting this set of slides with name bar graph showing business loss vector icon ppt powerpoint presentation gallery example topics pdf. This is a three stage process. The stages in this process are bar graph showing business loss vector icon. This is a completely editable PowerPoint presentation and is available for immediate download. Download now and impress your audience.
Business Graph Showing Company Growth Vector Icon Ppt PowerPoint Presentation Gallery Slide Portrait PDF
Presenting this set of slides with name business graph showing company growth vector icon ppt powerpoint presentation gallery slide portrait pdf. This is a three stage process. The stages in this process are business graph showing company growth vector icon. This is a completely editable PowerPoint presentation and is available for immediate download. Download now and impress your audience.

Company Share Analysis Pie Graph Ppt PowerPoint Presentation Styles Slides PDF
Presenting this set of slides with name company share analysis pie graph ppt powerpoint presentation styles slides pdf. This is a four stage process. The stages in this process are company share analysis pie graph. This is a completely editable PowerPoint presentation and is available for immediate download. Download now and impress your audience.

Monitoring Showing Stock Trading And Analysis Graph Ppt PowerPoint Presentation Ideas Slideshow PDF
Presenting this set of slides with name monitoring showing stock trading and analysis graph ppt powerpoint presentation ideas slideshow pdf. This is a one stage process. The stage in this process is monitoring showing stock trading and analysis graph. This is a completely editable PowerPoint presentation and is available for immediate download. Download now and impress your audience.

 Home
Home