Financial Dashboard

Adjusting Financial Strategies And Planning Analyzing Impact Of New Financial Strategic Planning Graphics PDF
This slide showcases the impact assessment of new financial strategy plan on key financial metrics involved. It includes parameters such as revenues, total revenue, revenue growth, expenses, margin EBITDA, etc. Are you in need of a template that can accommodate all of your creative concepts This one is crafted professionally and can be altered to fit any style. Use it with Google Slides or PowerPoint. Include striking photographs, symbols, depictions, and other visuals. Fill, move around, or remove text boxes as desired. Test out color palettes and font mixtures. Edit and save your work, or work with colleagues. Download Adjusting Financial Strategies And Planning Analyzing Impact Of New Financial Strategic Planning Graphics PDF and observe how to make your presentation outstanding. Give an impeccable presentation to your group and make your presentation unforgettable.

Compensation Plan Financial And Non Financial Ppt PowerPoint Presentation File Structure
Presenting this set of slides with name compensation plan financial and non financial ppt powerpoint presentation file structure. This is a eight stage process. The stages in this process are the idea sharing, deeper understanding, data gathering, implement solutions, solution shaping, feedback and review, embed, ongoing. This is a completely editable PowerPoint presentation and is available for immediate download. Download now and impress your audience.

How Electronic Commerce Financial Procedure Can Be Enhanced Standalone Financial Ratios Of Ecommerce Website Template PDF
This slide showcases standalone financial ratios of ecommerce websites. It provides information about net profit margin, return on capital, return on assets, quick ratio, inventory turnover ratio, operational expenses, etc. The How Electronic Commerce Financial Procedure Can Be Enhanced Standalone Financial Ratios Of Ecommerce Website Template PDF is a compilation of the most recent design trends as a series of slides. It is suitable for any subject or industry presentation, containing attractive visuals and photo spots for businesses to clearly express their messages. This template contains a variety of slides for the user to input data, such as structures to contrast two elements, bullet points, and slides for written information. Slidegeeks is prepared to create an impression.

Financial Summary Of Vending Start Up Key Financial Assumptions Of The Organization Rules PDF
This slide provides a glimpse of important financial assumptions that are to be made while setting up the firm in terms of income, expense, and balance sheet. The computations are based on market trends and conditions prevailing in the vending industry. Want to ace your presentation in front of a live audience Our Financial Summary Of Vending Start Up Key Financial Assumptions Of The Organization Rules PDF can help you do that by engaging all the users towards you. Slidegeeks experts have put their efforts and expertise into creating these impeccable powerpoint presentations so that you can communicate your ideas clearly. Moreover, all the templates are customizable, and easy to edit and downloadable. Use these for both personal and commercial use.

Adjusting Financial Strategies And Planning Comparative Analysis Of Financial Analysis Software Structure PDF
This slide provides glimpse about comparative analysis of different corporate investment portfolios for selecting appropriate investment portfolio. It includes KPIs such as return, risk, liquidity, time horizon, etc. Coming up with a presentation necessitates that the majority of the effort goes into the content and the message you intend to convey. The visuals of a PowerPoint presentation can only be effective if it supplements and supports the story that is being told. Keeping this in mind our experts created Adjusting Financial Strategies And Planning Comparative Analysis Of Financial Analysis Software Structure PDF to reduce the time that goes into designing the presentation. This way, you can concentrate on the message while our designers take care of providing you with the right template for the situation.
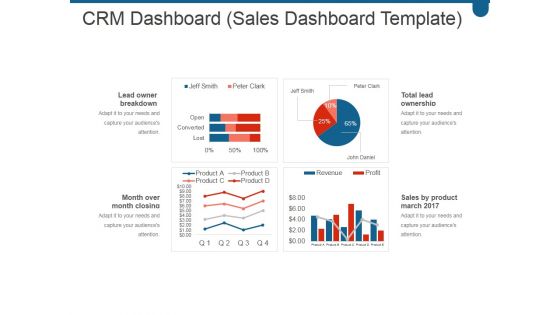
Crm Dashboard Sales Dashboard Template Ppt PowerPoint Presentation Microsoft
This is a crm dashboard sales dashboard template ppt powerpoint presentation microsoft. This is a four stage process. The stages in this process are lead owner breakdown, month over month closing trend, total lead ownership, sales by product march 2017.
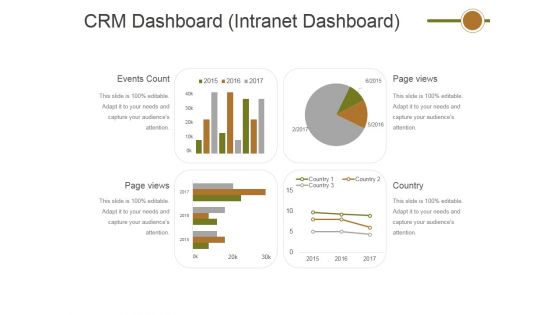
Crm Dashboard Intranet Dashboard Ppt PowerPoint Presentation Outline Professional
This is a crm dashboard intranet dashboard ppt powerpoint presentation outline professional. This is a four stage process. The stages in this process are events count, page views, page views, country.
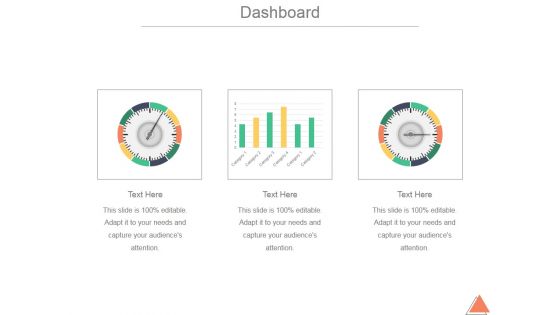
Dashboard Ppt PowerPoint Presentation Infographics
This is a dashboard ppt powerpoint presentation infographics. This is a three stage process. The stages in this process are business, marketing, dashboard, analysis, finance.

Dashboard Ppt PowerPoint Presentation Graphics
This is a dashboard ppt powerpoint presentation graphics. This is a four stage process. The stages in this process are business, marketing, management, dashboard, analysis.
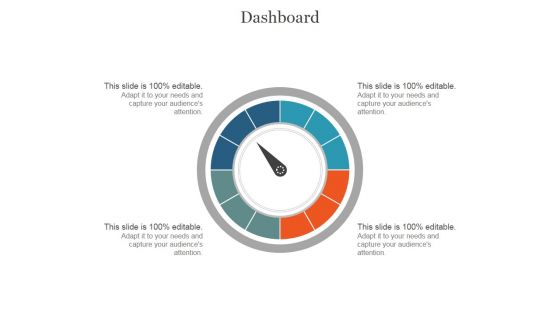
Dashboard Ppt PowerPoint Presentation Portfolio
This is a dashboard ppt powerpoint presentation portfolio. This is a four stage process. The stages in this process are business, marketing, management, dashboard, finance.

Four Steps For Financial Data Analysis Powerpoint Slides
This PowerPoint contains four circles with percentage values. Download this diagram slide to display financial data analysis. This template is editable, You can edit text, color, shade and style of this diagram as per you need.

Dashboard Ppt PowerPoint Presentation Examples
This is a dashboard ppt powerpoint presentation examples. This is a three stage process. The stages in this process are low, medium, high.
Dashboard Ppt PowerPoint Presentation Shapes
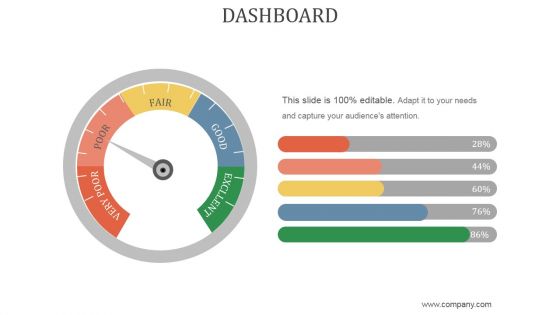
This is a dashboard ppt powerpoint presentation shapes. This is a five stage process. The stages in this process are very poor, poor, fair, good, excllent.

Enterprise Financial Performance Analysis With Project Portfolio Scorecard Guidelines PDF
The slide showcases a scorecard dashboard help assess projects portfolio financial performance. It covers financial performance status, projects locations, graphical charts and financial scorecard. Showcasing this set of slides titled Enterprise Financial Performance Analysis With Project Portfolio Scorecard Guidelines PDF. The topics addressed in these templates are Projects Status, Projects Issues Status, Budget Balance. All the content presented in this PPT design is completely editable. Download it and make adjustments in color, background, font etc. as per your unique business setting.
Crm Dashboard Intranet Dashboard Ppt PowerPoint Presentation Model
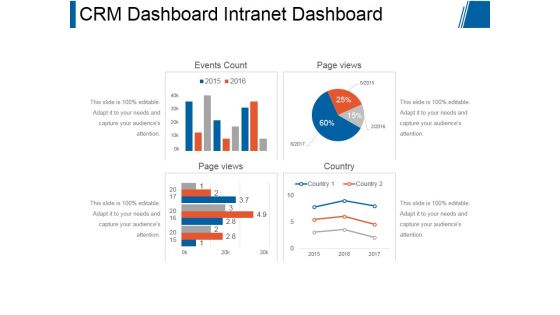
This is a crm dashboard intranet dashboard ppt powerpoint presentation model. This is a four stage process. The stages in this process are events count, page views, page views, country.
Crm Dashboard Sales Dashboard Ppt PowerPoint Presentation Themes
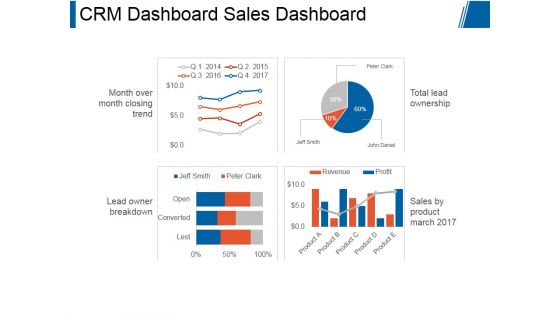
This is a crm dashboard sales dashboard ppt powerpoint presentation themes. This is a four stage process. The stages in this process are month over month closing trend, lead owner breakdown, total lead ownership, sales by product march 2017.

Financial Team Project Weekly Status Update Summary Document Background PDF
This slide represents the weekly report of the project handled by the financial department of the organization. It includes dashboard showing the health of the project, tasks, workload, time, cost and progress of the project. Showcasing this set of slides titled Financial Team Project Weekly Status Update Summary Document Background PDF. The topics addressed in these templates are Projects, Dashboard, Reports, Workload, Roadmap. All the content presented in this PPT design is completely editable. Download it and make adjustments in color, background, font etc. as per your unique business setting.

Financial Metrics And Kpi Template Presentation Visual Aids
This is a financial metrics and kpi template presentation visual aids. This is a three stage process. The stages in this process are operating profit last 12 months, total income act vs forecast between 2009 and 2010, income by qtr by tr between 2007 and 2010.

Concentric Chart With Five Financial Steps Powerpoint Slides
This PowerPoint slide contains diagram of concentric chart with five financial steps This professional slide helps to exhibit financial planning for business. Use this PowerPoint template to make impressive presentations.

Crm Dashboard Sales Dashboard Template Ppt PowerPoint Presentation Professional Layout
This is a crm dashboard sales dashboard template ppt powerpoint presentation professional layout. This is a four stage process. The stages in this process are lead owner breakdown, sales by product march 2017, total lead ownership, month over month closing trend.
Test Tubes For Financial Ratio Analysis Powerpoint Slides
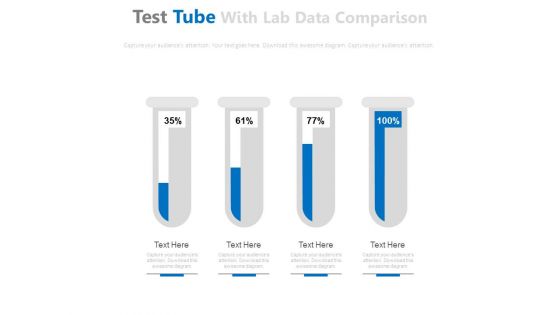
This PowerPoint template has been designed with graphics of test tubes. Use this PPT slide to depict financial ratio analysis. Download this PPT template to make impressive presentations.

Corporate Performance Management Dashboard Ppt Powerpoint Topics
This is a corporate performance management dashboard ppt powerpoint topics. This is a eight stage process. The stages in this process are analysis, reporting, dashboards, financial consolidation, budgeting, forecasting, detailed planning, operational planning, corporate performance management.

Financial Highlight Template 2 Ppt PowerPoint Presentation Outline Visuals
This is a financial highlight template 2 ppt powerpoint presentation outline visuals. This is a two stage process. The stages in this process are sales, profit and loss, operating expenses, operating income, net income.

Financial Highlights Template 1 Ppt PowerPoint Presentation Slides
This is a financial highlights template 1 ppt powerpoint presentation slides. This is a two stage process. The stages in this process are sales, operating expenses, operating income, net income.
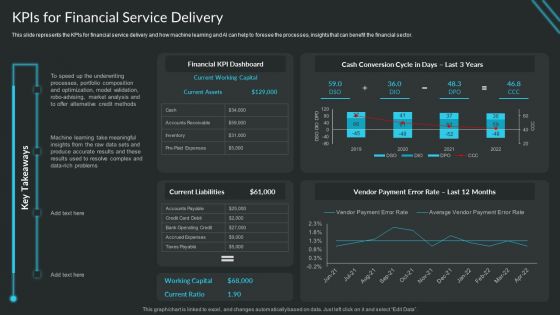
Proactive Consumer Solution And How To Perform It Kpis For Financial Service Delivery Designs PDF
This slide represents the KPIs for financial service delivery and how machine learning and AI can help to foresee the processes, insights that can benefit the financial sector.Deliver an awe inspiring pitch with this creative Proactive Consumer Solution And How To Perform It Kpis For Financial Service Delivery Designs PDF bundle. Topics like Financial Dashboard, Machine Learning, Portfolio Composition can be discussed with this completely editable template. It is available for immediate download depending on the needs and requirements of the user.
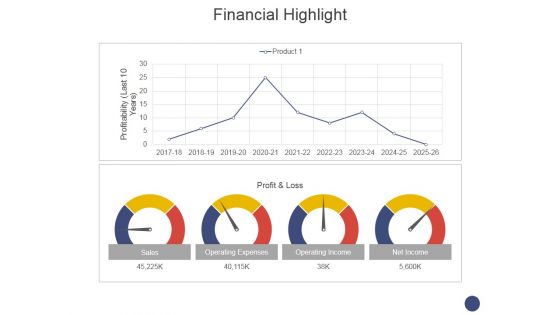
Financial Highlight Template 1 Ppt PowerPoint Presentation Model Deck
This is a financial highlight template 1 ppt powerpoint presentation model deck. This is a two stage process. The stages in this process are sales, operating expenses, operating income, net income.

Pricing Right Data Kpi Dashboard Powerpoint Layout
This is a pricing right data kpi dashboard powerpoint layout. This is a two stage process. The stages in this process are price management, transactional discounting, price waterfall, channel mix, segmentation, product mix, price elasticity, contribution margin, price realization, kpi dashboard, financial statement, pricing, data, pricing right.
Crisis Management Program Presentation Financial Performance Tracking Slides PDF
This slide presents the dashboard which will help firm in tracking the fiscal performance. This dashboard displays number of customers, vendors and revenues generated, expenses and profit incurred. Deliver and pitch your topic in the best possible manner with this crisis management program presentation financial performance tracking slides pdf. Use them to share invaluable insights on revenue, expense, profit, customer, financial performance tracking and impress your audience. This template can be altered and modified as per your expectations. So, grab it now.
Mitigating Cybersecurity Threats And Vulnerabilities Financial Performance Tracking Designs PDF
This slide presents the dashboard which will help firm in tracking the fiscal performance. This dashboard displays revenues and expenses trends and payment received analysis. Deliver and pitch your topic in the best possible manner with this mitigating cybersecurity threats and vulnerabilities financial performance tracking designs pdf. Use them to share invaluable insights on receivables analysis, revenue and expense trends and impress your audience. This template can be altered and modified as per your expectations. So, grab it now.

Management Dashboard Templates Presentation Diagram
This is a management dashboard templates presentation diagram. This is a four stage process. The stages in this process are operational performance, business value, financial performance, infrastructure business value.
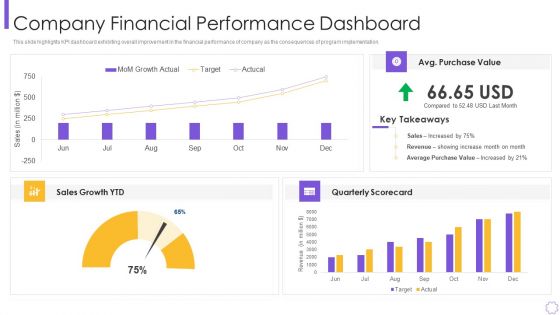
Organizational Program To Improve Team Productivity And Efficiency Company Financial Pictures PDF
This slide highlights KPI dashboard exhibiting overall improvement in the financial performance of company as the consequences of program implementation. Deliver an awe inspiring pitch with this creative organizational program to improve team productivity and efficiency company financial pictures pdf bundle. Topics like company financial performance dashboard can be discussed with this completely editable template. It is available for immediate download depending on the needs and requirements of the user.
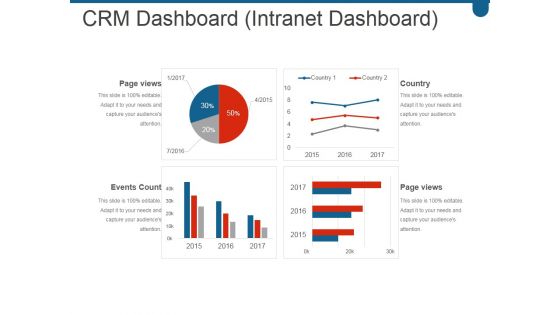
Crm Dashboard Intranet Dashboard Ppt PowerPoint Presentation Sample
This is a crm dashboard intranet dashboard ppt powerpoint presentation sample. This is a four stage process. The stages in this process are page views, events count, country, page views.
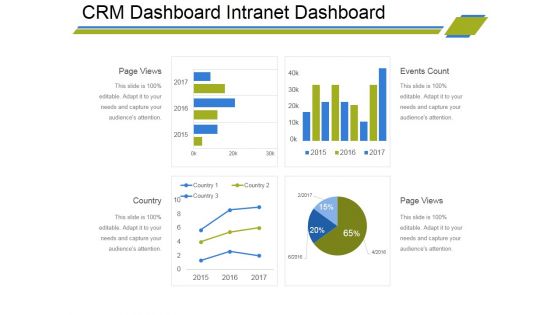
Crm Dashboard Intranet Dashboard Ppt PowerPoint Presentation Ideas Images
This is a crm dashboard intranet dashboard ppt powerpoint presentation ideas images. This is a four stage process. The stages in this process are page views, country, page views, events count.

Risk Metrics Dashboard And Mitigation Expenditure Dashboard Ideas PDF
This slide illustrates facts and figures of expenditure incurred on different risks. It includes financial risk, operational risks and competition risks. Pitch your topic with ease and precision using this Risk Metrics Dashboard And Mitigation Expenditure Dashboard Ideas PDF. This layout presents information on Management, Expenditure, Risk. It is also available for immediate download and adjustment. So, changes can be made in the color, design, graphics or any other component to create a unique layout.
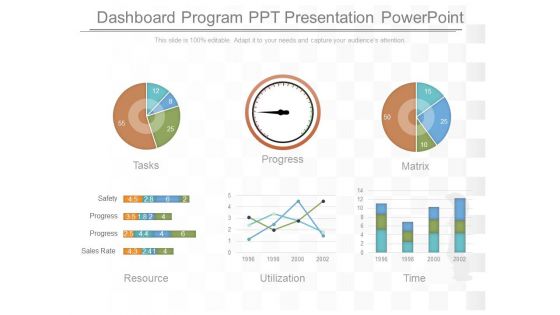
Dashboard Program Ppt Presentation Powerpoint
This is a dashboard program ppt presentation powerpoint. This is a six stage process. The stages in this process are tasks, progress, matrix, resource, utilization, time, safety, progress, sales rate.
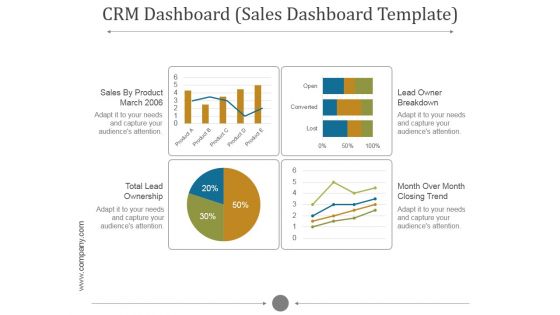
Crm Dashboard Sales Dashboard Template Ppt PowerPoint Presentation Inspiration
This is a crm dashboard sales dashboard template ppt powerpoint presentation inspiration. This is a five stage process. The stages in this process are sales by product march, lead owner breakdown, total lead ownership, month over month closing trend.
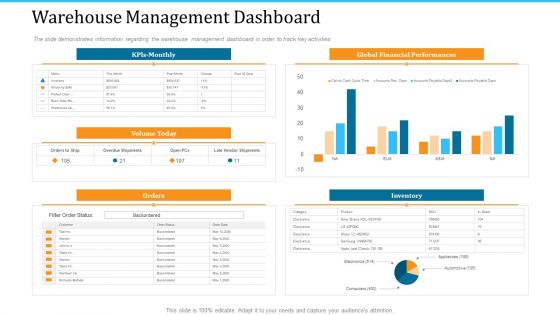
WMS Implementation Warehouse Management Dashboard Rules PDF
The slide demonstrates information regarding the warehouse management dashboard in order to track key activities. Deliver an awe-inspiring pitch with this creative wms implementation warehouse management dashboard rules pdf bundle. Topics like warehouse management dashboard, global financial performances, inventory can be discussed with this completely editable template. It is available for immediate download depending on the needs and requirements of the user.
Dashboard Ppt PowerPoint Presentation Inspiration Icons
This is a dashboard ppt powerpoint presentation inspiration icons. This is a four stage process. The stages in this process are business, marketing, finance, planning, analysis.

Key Evolutions In Financial Technology Industry Ideas PDF
This slide presents key industry trends dashboard for fintech helpful in leveraging technology to streamline operations of various financial processes. It includes insights on fintech adoption rates, top fintech technologies used and countrywide distribution of fintech using customers. Showcasing this set of slides titled Key Evolutions In Financial Technology Industry Ideas PDF. The topics addressed in these templates are Key Evolutions, Financial Technology Industry. All the content presented in this PPT design is completely editable. Download it and make adjustments in color, background, font etc. as per your unique business setting.
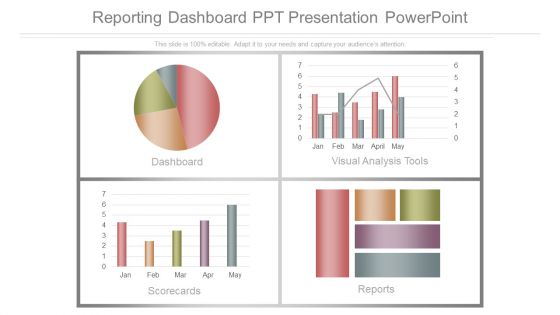
Reporting Dashboard Ppt Presentation Powerpoint
This is a reporting dashboard ppt presentation powerpoint. This is a four stage process. The stages in this process are dashboard, visual analysis tools, scorecards, reports.
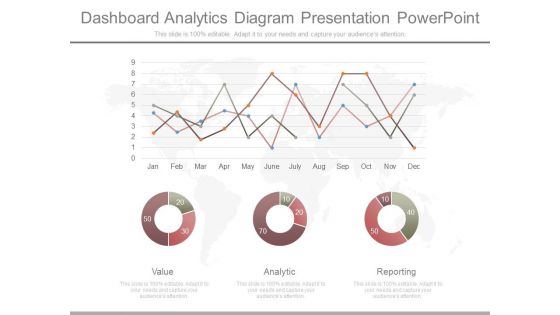
Dashboard Analytics Diagram Presentation Powerpoint
This is a dashboard analytics diagram presentation powerpoint. This is a three stage process. The stages in this process are value, analytic, reporting.

Business Management Dashboard Powerpoint Graphics
This is a business management dashboard powerpoint graphics. This is a four stage process. The stages in this process are property system, crm system, asset system, finance system.
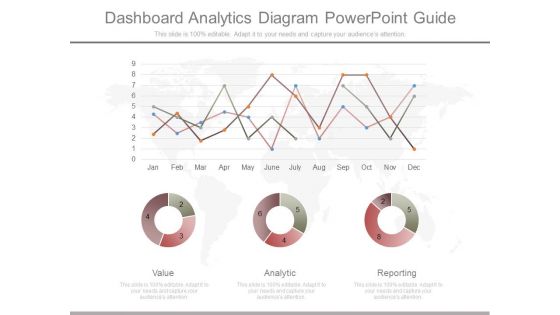
Dashboard Analytics Diagram Powerpoint Guide
This is a dashboard analytics diagram powerpoint guide. This is a three stage process. The stages in this process are value, analytic, reporting.

Corporate Dashboard Template Presentation Portfolio
This is a corporate dashboard template presentation portfolio. This is a five stage process. The stages in this process are product, strategy, marketing, customer, management.
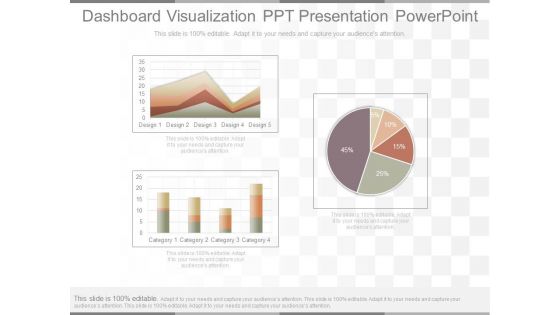
Dashboard Visualization Ppt Presentation Powerpoint
This is a dashboard visualization ppt presentation powerpoint. This is a three stage process. The stages in this process are design, category.

Business Management Dashboard Ppt Example
This is a business management dashboard ppt example. This is a three stage process. The stages in this process are sales figure, regional sales breakdown, product break.

Kpi Warehousing Dashboard Powerpoint Ideas
This is a kpi warehousing dashboard powerpoint ideas. This is a two stage process. The stages in this process are sales distribution, sales comparison.

Dashboard Report Ppt Powerpoint Ideas
This is a dashboard report ppt powerpoint ideas. This is a six stage process. The stages in this process are sales vs quotes, target for week, the sales, inventory, revenue.
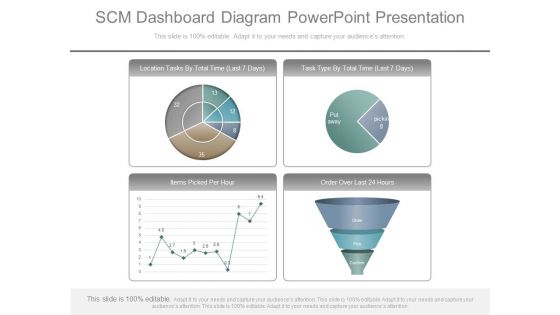
Scm Dashboard Diagram Powerpoint Presentation
This is a scm dashboard diagram powerpoint presentation. This is a four stage process. The stages in this process are location tasks by total time, task type by total time, items picked per hour, order over last.
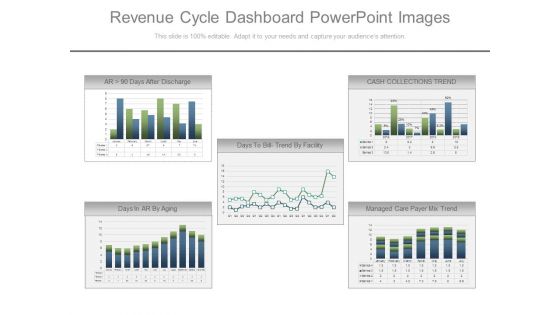
Revenue Cycle Dashboard Powerpoint Images
This is a revenue cycle dashboard powerpoint images. This is a five stage process. The stages in this process are days after discharge, cash collections trend, days to bill trend by facility, days in ar by aging, managed care payer mix trend.

Bar Graph For Financial Statements Ppt PowerPoint Presentation Example
This is a bar graph for financial statements ppt powerpoint presentation example. This is a four stage process. The stages in this process are product version, finance, year.

Business Diagram Drops For Financial Accounting And Reporting Presentation Template
This business diagram has been designed with drops displaying financial ratios. Download this diagram to depict financial and accounting ratios. Use this slide to build quality presentations for your viewers.

Business Framework Model Digital Illustration Of Financial Reports Marketing Diagram
Get Out Of The Dock With Our Business Framework Model Digital Illustration Of Financial Reports Marketing Diagram Powerpoint Templates. Your Mind Will Be Set Free.
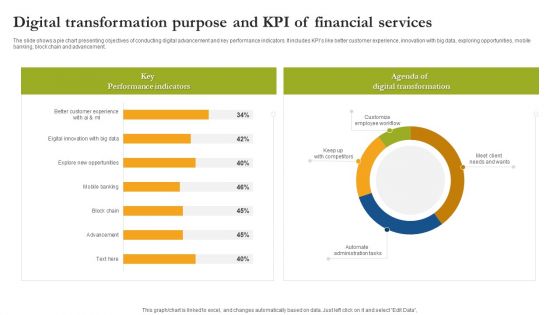
Digital Transformation Purpose And Kpi Of Financial Services Guidelines PDF
The slide shows a pie chart presenting objectives of conducting digital advancement and key performance indicators. It includes KPIs like better customer experience, innovation with big data, exploring opportunities, mobile banking, block chain and advancement. Showcasing this set of slides titled Digital Transformation Purpose And Kpi Of Financial Services Guidelines PDF. The topics addressed in these templates are Key Performance Indicators Digital Transformation, Customize Employee Workflow. All the content presented in this PPT design is completely editable. Download it and make adjustments in color, background, font etc. as per your unique business setting.
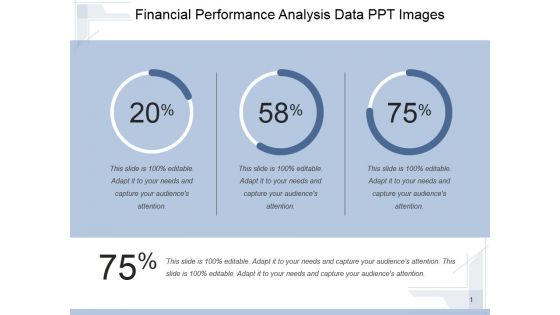
Financial Performance Analysis Data Ppt PowerPoint Presentation Topics
This is a financial performance analysis data ppt powerpoint presentation topics. This is a three stage process. The stages in this process are finance, percentage, marketing, business, growth.

Key Financial Ratios Template 3 Ppt PowerPoint Presentation Summary Sample
This is a key financial ratios template 3 ppt powerpoint presentation summary sample. This is a four stage process. The stages in this process are liquidity, profitability, activity, solvency.
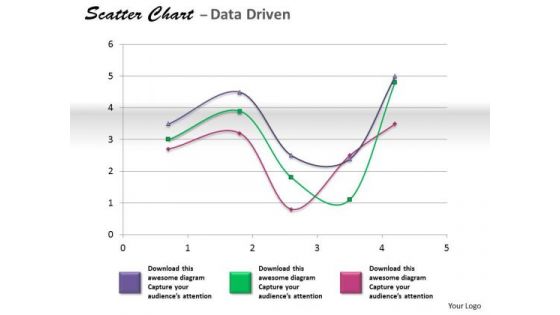
Financial Data Analysis Coordinate With Scatter Chart PowerPoint Templates
Get The Doers Into Action. Activate Them With Our financial data analysis coordinate with scatter chart Powerpoint Templates .

Budget And Financial Snapshot Ppt PowerPoint Presentation Example
This is a budget and financial snapshot ppt powerpoint presentation example. This is a two stage process. The stages in this process are sales, operating income, net income.
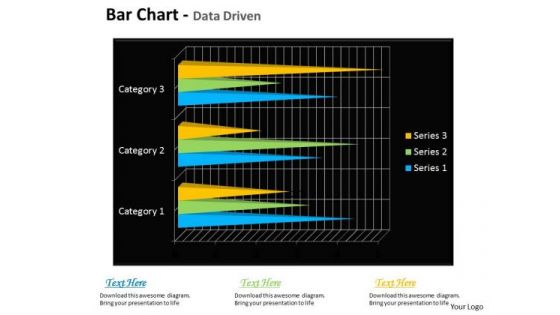
Quantitative Data Analysis Bar Chart For Financial Markets PowerPoint Templates
Draft It Out On Our quantitative data analysis bar chart for financial markets Powerpoint Templates . Give The Final Touches With Your Ideas.
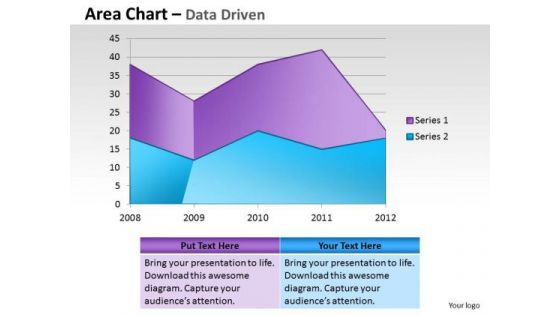
Financial Data Analysis Area Chart For Showing Trends PowerPoint Templates
Document Your Views On Our financial data analysis area chart for showing trends Powerpoint Templates . They Will Create A Strong Impression.

 Home
Home