Financial Comparison
Private Equity Management Structure Ppt PowerPoint Presentation Icon Shapes
This is a private equity management structure ppt powerpoint presentation icon shapes. This is a four stage process. The stages in this process are investment, funding, private equity, venture capital.
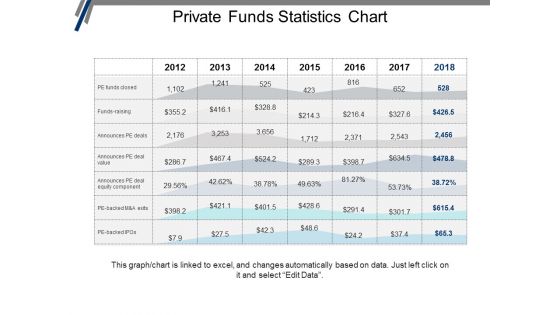
Private Funds Statistics Chart Ppt PowerPoint Presentation Portfolio Graphics Design
This is a private funds statistics chart ppt powerpoint presentation portfolio graphics design. This is a seven stage process. The stages in this process are investment, funding, private equity, venture capital.
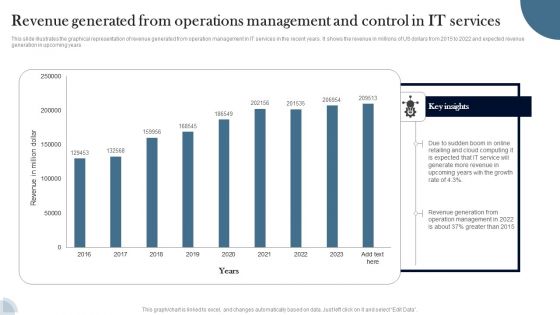
Revenue Generated From Operations Management And Control In IT Services Guidelines PDF
This slide illustrates the graphical representation of revenue generated from operation management in IT services in the recent years. It shows the revenue in millions of US dollars from 2015 to 2022 and expected revenue generation in upcoming years. Pitch your topic with ease and precision using this Revenue Generated From Operations Management And Control In IT Services Guidelines PDF. This layout presents information on Revenue, IT Service, Cloud Computing. It is also available for immediate download and adjustment. So, changes can be made in the color, design, graphics or any other component to create a unique layout.

Information Technology Project Analysis With Kpi Dashboard Portrait PDF
The following slide highlights various key performance indicators to ensure successful information technology IT project completion. It also includes components such as risks, status, budget, deadlines, average task handle time, overdue activities etc. Pitch your topic with ease and precision using this Information Technology Project Analysis With Kpi Dashboard Portrait PDF. This layout presents information on Planning Completed, Design Completed, Development . It is also available for immediate download and adjustment. So, changes can be made in the color, design, graphics or any other component to create a unique layout.
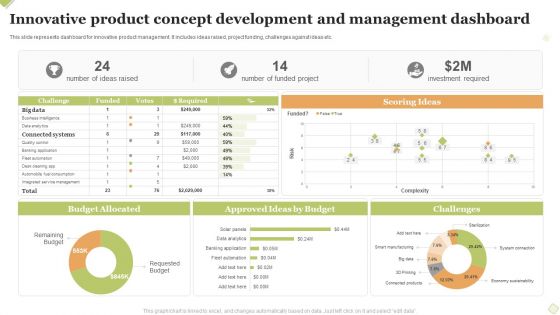
Innovative Product Concept Development And Management Dashboard Introduction PDF
This slide represents dashboard for innovative product management. It includes ideas raised, project funding, challenges against ideas etc. Pitch your topic with ease and precision using this Innovative Product Concept Development And Management Dashboard Introduction PDF This layout presents information on Scoring Ideas, Budget Allocated, Challenges. It is also available for immediate download and adjustment. So, changes can be made in the color, design, graphics or any other component to create a unique layout.

Challenges Faced In Implementation Of Advocacy Strategy Introduction PDF
The following slide displays statistical report for advocacy plan execution challenges faced by organization. It includes components such as employee motivation, budget, regulatory compliance, tools and technologies, etc. Showcasing this set of slides titled Challenges Faced In Implementation Of Advocacy Strategy Introduction PDF The topics addressed in these templates are Key Insights, Strategy, Overall Engagement. All the content presented in this PPT design is completely editable. Download it and make adjustments in color, background, font etc. as per your unique business setting.

Multi Channel Marketing Strategy Dashboard Slides PDF
This slide showcases marketing channels instrument board. The purpose of this template is evaluate progress and improve decision making. It includes elements such as marketing channel type digital marketing, free marketing, paid marketing and traditional marketing, main KPIS, click revenue. Pitch your topic with ease and precision using this Multi Channel Marketing Strategy Dashboard Slides PDF. This layout presents information on Bounce Rate, Conversion Rate, Marketing Channel Type. It is also available for immediate download and adjustment. So, changes can be made in the color, design, graphics or any other component to create a unique layout.
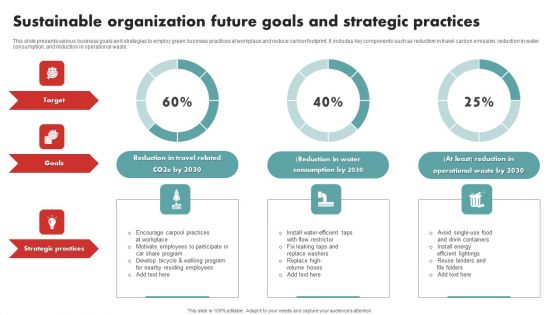
Sustainable Organization Future Goals And Strategic Practices Sample PDF
This slide presents various business goals and strategies to employ green business practices at workplace and reduce carbon footprint. It includes key components such as reduction in travel carbon emission, reduction in water consumption, and reduction in operational waste. Pitch your topic with ease and precision using this Sustainable Organization Future Goals And Strategic Practices Sample PDF This layout presents information on Goals, Target, Strategic Practices. It is also available for immediate download and adjustment. So, changes can be made in the color, design, graphics or any other component to create a unique layout.
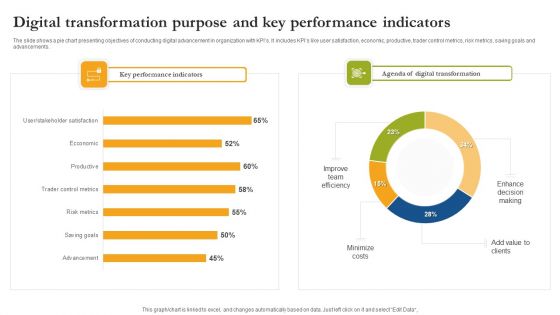
Digital Transformation Purpose And Key Performance Indicators Formats PDF
The slide shows a pie chart presenting objectives of conducting digital advancement in organization with KPIs. It includes KPIs like user satisfaction, economic, productive, trader control metrics, risk metrics, saving goals and advancements. Pitch your topic with ease and precision using this Digital Transformation Purpose And Key Performance Indicators Formats PDF. This layout presents information on Key Performance Indicators, Digital Transformation, Minimize Costs. It is also available for immediate download and adjustment. So, changes can be made in the color, design, graphics or any other component to create a unique layout.

Employee Demographics Data And Designation Analysis Dashboard Introduction PDF
The purpose of this template is to explain the analysis of employee demographics and designation dashboard. The slide provides information about gender, ethnicity, location and structure. Pitch your topic with ease and precision using this Employee Demographics Data And Designation Analysis Dashboard Introduction PDF. This layout presents information on Job Functions, Top Locations, Employee Structure It is also available for immediate download and adjustment. So, changes can be made in the color, design, graphics or any other component to create a unique layout.
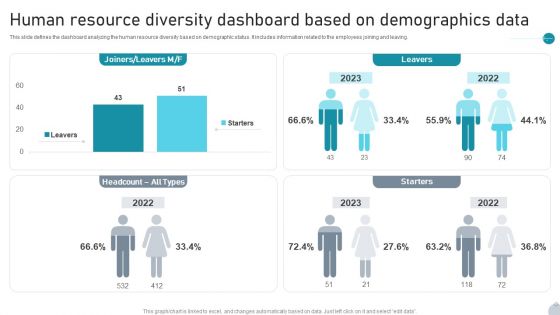
Human Resource Diversity Dashboard Based On Demographics Data Rules PDF
This slide defines the dashboard analyzing the human resource diversity based on demographic status. It includes information related to the employees joining and leaving. Pitch your topic with ease and precision using this Human Resource Diversity Dashboard Based On Demographics Data Rules PDF. This layout presents information on Starters, Leavers, Demographics Data It is also available for immediate download and adjustment. So, changes can be made in the color, design, graphics or any other component to create a unique layout.
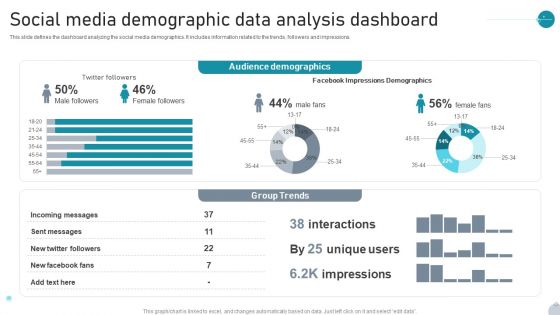
Social Media Demographic Data Analysis Dashboard Infographics PDF
This slide defines the dashboard analyzing the social media demographics. It includes information related to the trends, followers and impressions. Pitch your topic with ease and precision using this Social Media Demographic Data Analysis Dashboard Infographics PDF. This layout presents information on Audience Demographics, Group Trends, Impressions Demographics It is also available for immediate download and adjustment. So, changes can be made in the color, design, graphics or any other component to create a unique layout.
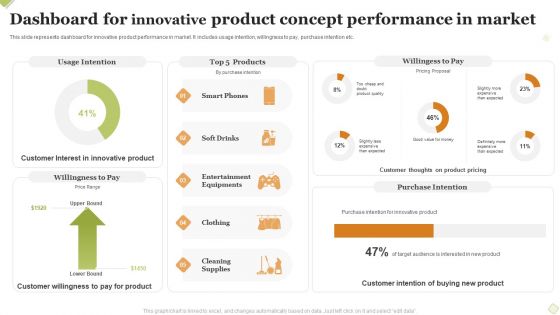
Dashboard For Innovative Product Concept Performance In Market Formats PDF
This slide represents dashboard for innovative product performance in market. It includes usage intention, willingness to pay, purchase intention etc. Pitch your topic with ease and precision using this Dashboard For Innovative Product Concept Performance In Market Formats PDF This layout presents information on Usage Intention, Willingess To Pay, Purchase Intention . It is also available for immediate download and adjustment. So, changes can be made in the color, design, graphics or any other component to create a unique layout.
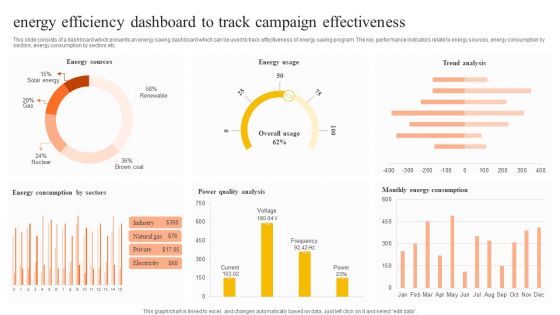
Energy Efficiency Dashboard To Track Campaign Effectiveness Pictures PDF
This slide consists of a dashboard which presents an energy saving dashboard which can be used to track effectiveness of energy saving program. The key performance indicators relate to energy sources, energy consumption by sectors, energy consumption by sectors etc. Pitch your topic with ease and precision using this Energy Efficiency Dashboard To Track Campaign Effectiveness Pictures PDF. This layout presents information on Energy Sources, Energy Usage, Trend Analysis. It is also available for immediate download and adjustment. So, changes can be made in the color, design, graphics or any other component to create a unique layout.
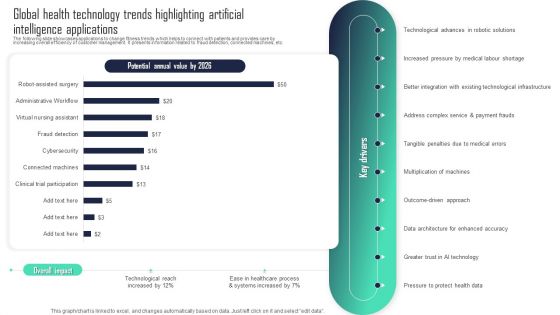
Global Health Technology Trends Highlighting Artificial Intelligence Applications Formats PDF
The following slide showcases applications to change fitness trends which helps to connect with patients and provides care by increasing overall efficiency of customer management. It presents information related to fraud detection, connected machines, etc. Pitch your topic with ease and precision using this Global Health Technology Trends Highlighting Artificial Intelligence Applications Formats PDF. This layout presents information on Key Drivers, Solutions, Enhanced Accuracy. It is also available for immediate download and adjustment. So, changes can be made in the color, design, graphics or any other component to create a unique layout.
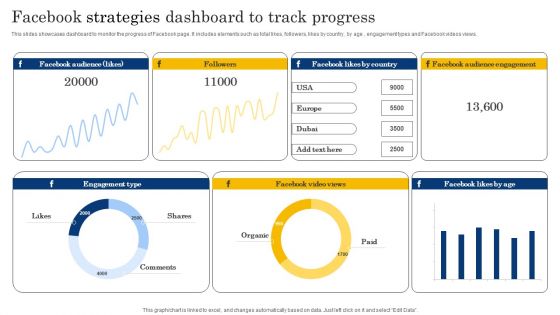
Facebook Strategies Dashboard To Track Progress Structure PDF
This slides showcases dashboard to monitor the progress of Facebook page. It includes elements such as total likes, followers, likes by country, by age , engagement types and Facebook videos views. Pitch your topic with ease and precision using this Facebook Strategies Dashboard To Track Progress Structure PDF. This layout presents information on Followers, Engagement Type, Shares. It is also available for immediate download and adjustment. So, changes can be made in the color, design, graphics or any other component to create a unique layout.

KPI Dashboard To Assess Deals In Mergers And Acquisitions Strategy Rules PDF
Following slide showcases dashboard for mergers and acquisitions to measure effects of milestones to confirm integration plan accordingly. It presents information related to deals by types, country, etc. Pitch your topic with ease and precision using this KPI Dashboard To Assess Deals In Mergers And Acquisitions Strategy Rules PDF. This layout presents information on Status, Strategy, Minority Equity Stake. It is also available for immediate download and adjustment. So, changes can be made in the color, design, graphics or any other component to create a unique layout.

Cybersecurity Statistical Data Insights Sample PDF
The given below slide presents the number of organizations being victim of cyber attacks in the previous year. It also includes category wise attack data in the form of donut chart. Pitch your topic with ease and precision using this Cybersecurity Statistical Data Insights Sample PDF. This layout presents information on Social Media Attacks, Malware Attacks, Phishing Attacks. It is also available for immediate download and adjustment. So, changes can be made in the color, design, graphics or any other component to create a unique layout.

Product Data Insights Analysis Sheet Infographics PDF
The following slide depicts the annual performance of multiple products in terms of profit or loss to track whether they are doing well or not. The analysis sheet includes element such as cost, units, selling price, sales etc. Pitch your topic with ease and precision using this Product Data Insights Analysis Sheet Infographics PDF. This layout presents information on Unit Sold, Selling Price, Total Sales. It is also available for immediate download and adjustment. So, changes can be made in the color, design, graphics or any other component to create a unique layout.
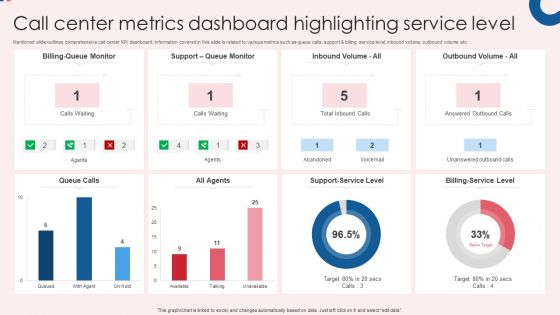
Call Center Metrics Dashboard Highlighting Service Level Infographics PDF
Mentioned slide outlines comprehensive call center KPI dashboard. Information covered in this slide is related to various metrics such as queue calls, support and billing service level, inbound volume, outbound volume etc. Pitch your topic with ease and precision using this Call Center Metrics Dashboard Highlighting Service Level Infographics PDF. This layout presents information on All Agents, Queue Calls, Billing Service Level. It is also available for immediate download and adjustment. So, changes can be made in the color, design, graphics or any other component to create a unique layout.
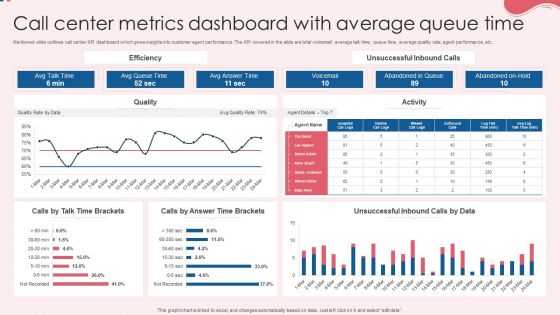
Call Center Metrics Dashboard With Average Queue Time Topics PDF
Mentioned slide outlines call center KPI dashboard which gives insights into customer agent performance. The KPI covered in the slide are total voicemail, average talk time, queue time, average quality rate, agent performance, etc. Pitch your topic with ease and precision using this Call Center Metrics Dashboard With Average Queue Time Topics PDF. This layout presents information on Efficiency, Quality, Activity. It is also available for immediate download and adjustment. So, changes can be made in the color, design, graphics or any other component to create a unique layout.
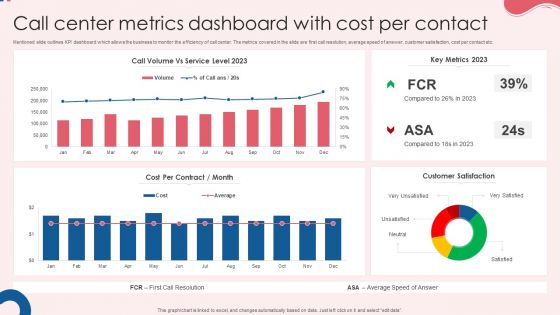
Call Center Metrics Dashboard With Cost Per Contact Rules PDF
Mentioned slide outlines KPI dashboard which allows the business to monitor the efficiency of call center. The metrics covered in the slide are first call resolution, average speed of answer, customer satisfaction, cost per contact etc. Pitch your topic with ease and precision using this Call Center Metrics Dashboard With Cost Per Contact Rules PDF. This layout presents information on Cost Per Contract, Key Metrics, Customer Satisfaction. It is also available for immediate download and adjustment. So, changes can be made in the color, design, graphics or any other component to create a unique layout.

Call Center Metrics Dashboard With First Response Time Background PDF
Mentioned slide outlines a KPI dashboard which can be used by call centers for the ticket system. Tickets created, unassigned, open, solved, escalated, tickets solved by agents, first response and full resolution time are the key metrics highlighted in the slide. Pitch your topic with ease and precision using this Call Center Metrics Dashboard With First Response Time Background PDF. This layout presents information on First Response Time, First Resolution Time, Response Time. It is also available for immediate download and adjustment. So, changes can be made in the color, design, graphics or any other component to create a unique layout.
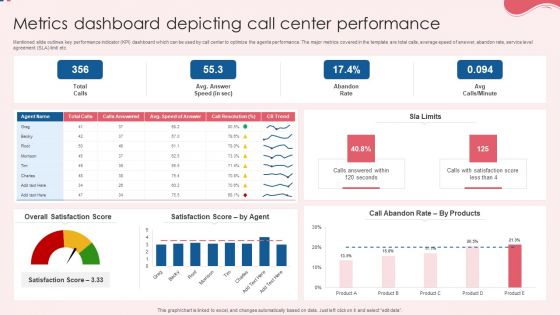
Metrics Dashboard Depicting Call Center Performance Pictures PDF
Mentioned slide outlines key performance indicator KPI dashboard which can be used by call center to optimize the agents performance. The major metrics covered in the template are total calls, average speed of answer, abandon rate, service level agreement SLA limit etc. Pitch your topic with ease and precision using this Metrics Dashboard Depicting Call Center Performance Pictures PDF. This layout presents information on Overall Satisfaction Score, Satisfaction Score, Performance. It is also available for immediate download and adjustment. So, changes can be made in the color, design, graphics or any other component to create a unique layout.

Business Survey Analysis Dashboard Based On Demographics Data Microsoft PDF
The purpose of this template is to explain the analysis of business survey conduct based on demographics. The slide provides information about support team, respondents and product preference. Pitch your topic with ease and precision using this Business Survey Analysis Dashboard Based On Demographics Data Microsoft PDF. This layout presents information on Support, Team Performance, Product Preference It is also available for immediate download and adjustment. So, changes can be made in the color, design, graphics or any other component to create a unique layout.
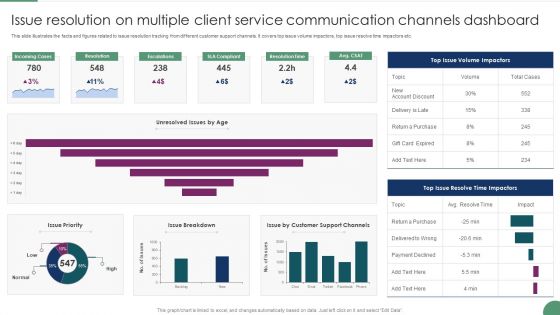
Issue Resolution On Multiple Client Service Communication Channels Dashboard Microsoft PDF
This slide illustrates the facts and figures related to issue resolution tracking from different customer support channels. It covers top issue volume impactors, top issue resolve time impactors etc. Pitch your topic with ease and precision using this Issue Resolution On Multiple Client Service Communication Channels Dashboard Microsoft PDF This layout presents information on Incoming Cases, Resolution, Escalations. It is also available for immediate download and adjustment. So, changes can be made in the color, design, graphics or any other component to create a unique layout.
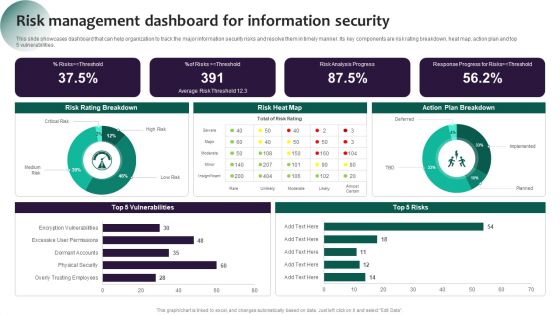
Information Systems Security And Risk Management Plan Risk Management Dashboard For Information Security Pictures PDF
This slide showcases dashboard that can help organization to track the major information security risks and resolve them in timely manner. Its key components are risk rating breakdown, heat map, action plan and top 5 vulnerabilities. The best PPT templates are a great way to save time, energy, and resources. Slidegeeks have 100 percent editable powerpoint slides making them incredibly versatile. With these quality presentation templates, you can create a captivating and memorable presentation by combining visually appealing slides and effectively communicating your message. Download Information Systems Security And Risk Management Plan Risk Management Dashboard For Information Security Pictures PDF from Slidegeeks and deliver a wonderful presentation.

Overview Of Factors Driving Operational Risk Administration Summary PDF
This slide highlights a country specific statistical data showing multiple factors driving operating risk management. It includes key factors including regulation trends, development of compressive risk perspectives, protection from losses, process improvement, etc. Pitch your topic with ease and precision using this Overview Of Factors Driving Operational Risk Administration Summary PDF This layout presents information on Key Takeaways, Risk Management, Administration. It is also available for immediate download and adjustment. So, changes can be made in the color, design, graphics or any other component to create a unique layout.
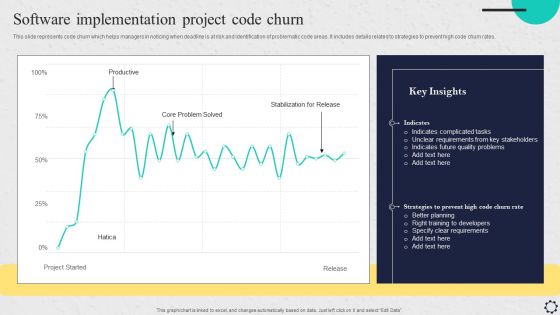
Software Implementation Project Code Churn Introduction PDF
This slide represents code churn which helps managers in noticing when deadline is at risk and identification of problematic code areas. It includes details related to strategies to prevent high code churn rates. This Software Implementation Project Code Churn Introduction PDF from Slidegeeks makes it easy to present information on your topic with precision. It provides customization options, so you can make changes to the colors, design, graphics, or any other component to create a unique layout. It is also available for immediate download, so you can begin using it right away. Slidegeeks has done good research to ensure that you have everything you need to make your presentation stand out. Make a name out there for a brilliant performance.
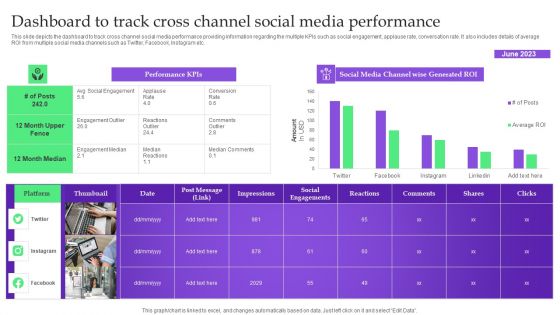
Analysis Plan For E Commerce Promotion Tactics Dashboard To Track Cross Channel Social Media Performance Demonstration PDF
This slide depicts the dashboard to track cross channel social media performance providing information regarding the multiple KPIs such as social engagement, applause rate, conversation rate. It also includes details of average ROI from multiple social media channels such as Twitter, Facebook, Instagram etc. This Analysis Plan For E Commerce Promotion Tactics Dashboard To Track Cross Channel Social Media Performance Demonstration PDF is perfect for any presentation, be it in front of clients or colleagues. It is a versatile and stylish solution for organizing your meetings. The Analysis Plan For E Commerce Promotion Tactics Dashboard To Track Cross Channel Social Media Performance Demonstration PDF features a modern design for your presentation meetings. The adjustable and customizable slides provide unlimited possibilities for acing up your presentation. Slidegeeks has done all the homework before launching the product for you. So, do not wait, grab the presentation templates today.
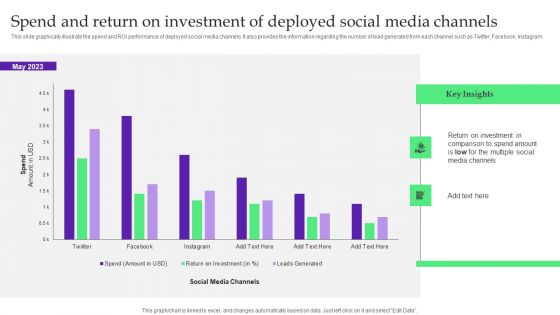
Analysis Plan For E Commerce Promotion Tactics Spend And Return On Investment Of Deployed Social Media Channels Mockup PDF
This slide graphically illustrate the spend and ROI performance of deployed social media channels. It also provides the information regarding the number of lead generated from each channel such as Twitter, Facebook, Instagram. Are you searching for a Analysis Plan For E Commerce Promotion Tactics Spend And Return On Investment Of Deployed Social Media Channels Mockup PDF that is uncluttered, straightforward, and original Its easy to edit, and you can change the colors to suit your personal or business branding. For a presentation that expresses how much effort you have put in, this template is ideal With all of its features, including tables, diagrams, statistics, and lists, its perfect for a business plan presentation. Make your ideas more appealing with these professional slides. Download Analysis Plan For E Commerce Promotion Tactics Spend And Return On Investment Of Deployed Social Media Channels Mockup PDF from Slidegeeks today.
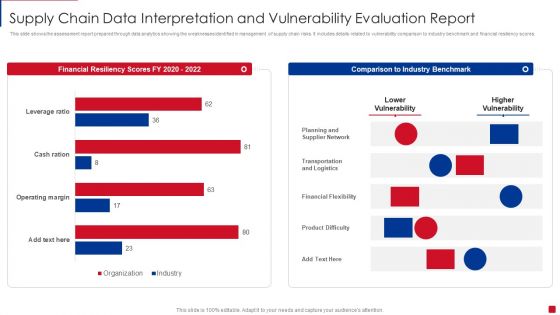
Supply Chain Data Interpretation And Vulnerability Evaluation Report Pictures PDF
This slide shows the assessment report prepared through data analytics showing the weaknesses identified in management of supply chain risks. It includes details related to vulnerability comparison to industry benchmark and financial resiliency scores Showcasing this set of slides titled Supply Chain Data Interpretation And Vulnerability Evaluation Report Pictures PDF. The topics addressed in these templates are Planning And Supplier Network, Transportation And Logistics, Financial Flexibility. All the content presented in this PPT design is completely editable. Download it and make adjustments in color, background, font etc. as per your unique business setting.
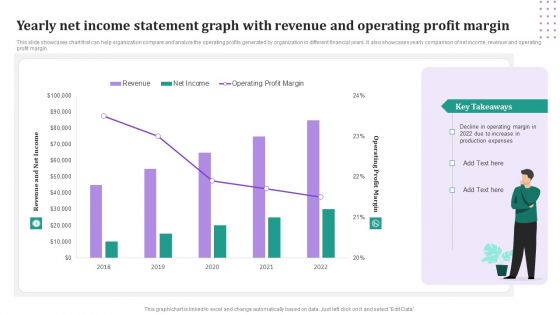
Yearly Net Income Statement Graph With Revenue And Operating Profit Margin Download PDF
This slide showcases chart that can help organization compare and analyze the operating profits generated by organization in different financial years. It also showcases yearly comparison of net income, revenue and operating profit margin. Pitch your topic with ease and precision using this Yearly Net Income Statement Graph With Revenue And Operating Profit Margin Download PDF. This layout presents information on Revenue, Net Income, Operating Profit Margin. It is also available for immediate download and adjustment. So, changes can be made in the color, design, graphics or any other component to create a unique layout.
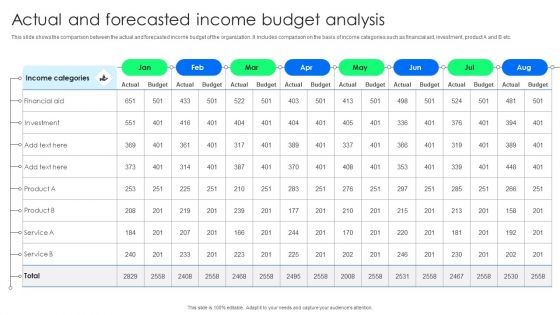
Actual And Forecasted Income Budget Analysis Elements PDF
This slide shows the comparison between the actual and forecasted income budget of the organization. It includes comparison on the basis of income categories such as financial aid, investment, product A and B etc. Pitch your topic with ease and precision using this Actual And Forecasted Income Budget Analysis Elements PDF. This layout presents information on Investment, Financial Aid. It is also available for immediate download and adjustment. So, changes can be made in the color, design, graphics or any other component to create a unique layout.
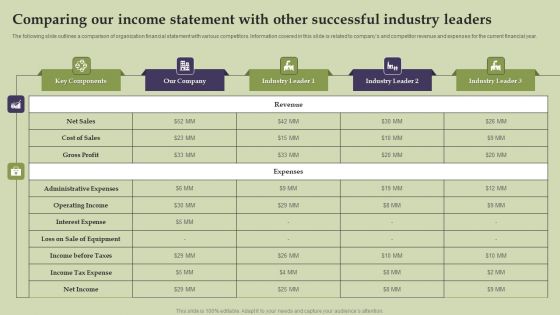
Methods And Approaches To Assess Comparing Our Income Statement With Other Successful Elements PDF
The following slide outlines a comparison of organization financial statement with various competitors. Information covered in this slide is related to companys and competitor revenue and expenses for the current financial year. The Methods And Approaches To Assess Comparing Our Income Statement With Other Successful Elements PDF is a compilation of the most recent design trends as a series of slides. It is suitable for any subject or industry presentation, containing attractive visuals and photo spots for businesses to clearly express their messages. This template contains a variety of slides for the user to input data, such as structures to contrast two elements, bullet points, and slides for written information. Slidegeeks is prepared to create an impression.

Comparing Our Income Statement With Other Successful Competitors Information PDF
The following slide outlines a comparison of organization financial statement with various competitors. Information covered in this slide is related to companys and competitor revenue and expenses for the current financial year. Do you have to make sure that everyone on your team knows about any specific topic I yes, then you should give Comparing Our Income Statement With Other Successful Competitors Information PDF a try. Our experts have put a lot of knowledge and effort into creating this impeccable Comparing Our Income Statement With Other Successful Competitors Information PDF. You can use this template for your upcoming presentations, as the slides are perfect to represent even the tiniest detail. You can download these templates from the Slidegeeks website and these are easy to edit. So grab these today.

Comparing Our Income Statement With Other Successful Competitors Topics PDF
The following slide outlines a comparison of organization financial statement with various competitors. Information covered in this slide is related to companys and competitor revenue and expenses for the current financial year. Crafting an eye catching presentation has never been more straightforward. Let your presentation shine with this tasteful yet straightforward Comparing Our Income Statement With Other Successful Competitors Topics PDF template. It offers a minimalistic and classy look that is great for making a statement. The colors have been employed intelligently to add a bit of playfulness while still remaining professional. Construct the ideal Comparing Our Income Statement With Other Successful Competitors Topics PDF that effortlessly grabs the attention of your audience Begin now and be certain to wow your customers.
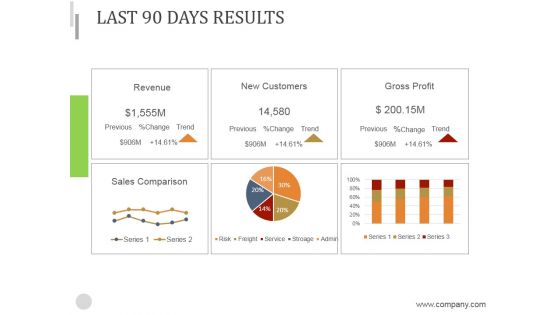
Last 90 Days Results Ppt PowerPoint Presentation Introduction
This is a last 90 days results ppt powerpoint presentation introduction. This is a six stage process. The stages in this process are revenue, new customers, gross profit, sales comparison.

Our Channel Sales Numbers Ppt PowerPoint Presentation Inspiration Graphics Design
This is a our channel sales numbers ppt powerpoint presentation inspiration graphics design. This is a four stage process. The stages in this process are business, finance, management, comparison, marketing.

Comparative Analysis Of Regional Sales Management Software Background Pdf
This slide provides different types of software to manage data of multiple branches automatically and automate transactions between branches. This comparison includes software features such as financial analysis report, resource planning, contact management, etc. Pitch your topic with ease and precision using this Comparative Analysis Of Regional Sales Management Software Background Pdf. This layout presents information on Solutions, Features, Pricing. It is also available for immediate download and adjustment. So, changes can be made in the color, design, graphics or any other component to create a unique layout.
Software Development Project Comparative Analysis Of Actual Cost And Budget Table Mockup PDF
Presenting Software Development Project Comparative Analysis Of Actual Cost And Budget Table Mockup PDF to dispense important information. This template comprises three stages. It also presents valuable insights into the topics including Software Development, Project Comparative Analysis, Budget Table. This is a completely customizable PowerPoint theme that can be put to use immediately. So, download it and address the topic impactfully.
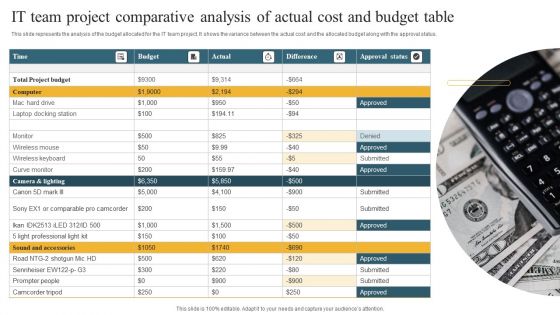
IT Team Project Comparative Analysis Of Actual Cost And Budget Table Template PDF
This slide represents the analysis of the budget allocated for the IT team project. It shows the variance between the actual cost and the allocated budget along with the approval status. Persuade your audience using this IT Team Project Comparative Analysis Of Actual Cost And Budget Table Template PDF. This PPT design covers one stages, thus making it a great tool to use. It also caters to a variety of topics including Budget Table, Actual Cost, Approval Status. Download this PPT design now to present a convincing pitch that not only emphasizes the topic but also showcases your presentation skills.
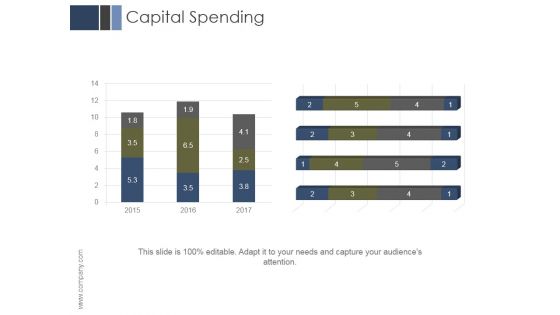
Capital Spending Ppt PowerPoint Presentation Designs
This is a capital spending ppt powerpoint presentation designs. This is a two stage process. The stages in this process are business, marketing, management, capital, compare.

Profitable Business Model For Fintech Platform Ppt Professional Skills PDF
This slide caters details about profitable business model for FinTech platform through which it generate revenues in terms of monthly subscription, transaction fee and cash back. This is a profitable business model for fintech platform ppt professional skills pdf template with various stages. Focus and dispense information on three stages using this creative set, that comes with editable features. It contains large content boxes to add your information on topics like profitable business model for fintech platform. You can also showcase facts, figures, and other relevant content using this PPT layout. Grab it now.
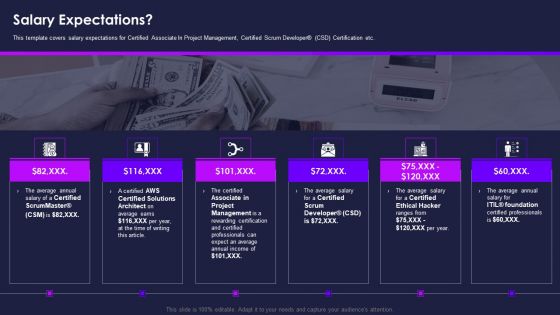
Certification Information Technology Professionals Salary Expectations Summary PDF
This template covers salary expectations for Certified Associate In Project Management, Certified Scrum Developer CSD Certification etc. This is a certification information technology professionals salary expectations summary pdf template with various stages. Focus and dispense information on six stages using this creative set, that comes with editable features. It contains large content boxes to add your information on topics like project, management, rewarding, salary. You can also showcase facts, figures, and other relevant content using this PPT layout. Grab it now.

Utilizing Cyber Technology For Change Process Measuring ROI Of Digital Healthcare Formats PDF
What changes do you wish to see after digital transformation List out the performance indicators. This is a utilizing cyber technology for change process measuring roi of digital healthcare formats pdf template with various stages. Focus and dispense information on eight stages using this creative set, that comes with editable features. It contains large content boxes to add your information on topics like profit, consumer centricity, consumer satisfaction, savings with early detection of health issues, prodctivity, innovation, employee turnover, early diagnosis of life-threatening diseases. You can also showcase facts, figures, and other relevant content using this PPT layout. Grab it now.
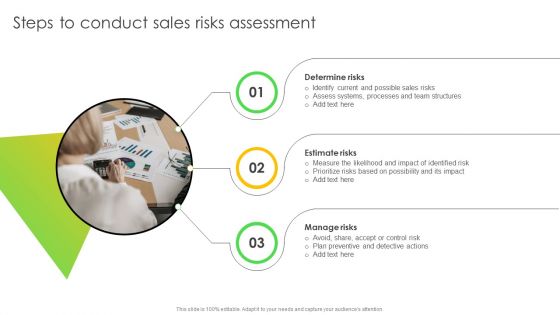
Steps To Conduct Sales Risks Assessment Ppt Summary Graphics Download PDF
Are you searching for a Steps To Conduct Sales Risks Assessment Ppt Summary Graphics Download PDF that is uncluttered, straightforward, and original Its easy to edit, and you can change the colors to suit your personal or business branding. For a presentation that expresses how much effort you have put in, this template is ideal With all of its features, including tables, diagrams, statistics, and lists, its perfect for a business plan presentation. Make your ideas more appealing with these professional slides. Download Steps To Conduct Sales Risks Assessment Ppt Summary Graphics Download PDF from Slidegeeks today.
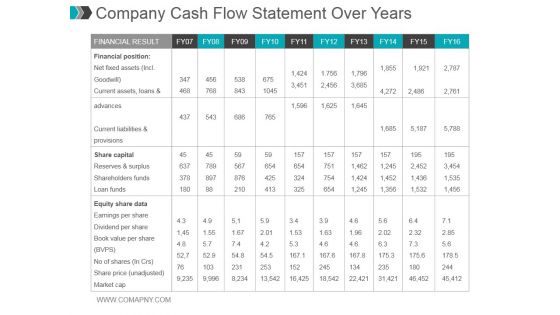
Company Cash Flow Statement Over Years Ppt PowerPoint Presentation Gallery
This is a company cash flow statement over years ppt powerpoint presentation gallery. This is ten stage process. The stages in this process are financial result, financial position, share capital, equity share data.

Buyer Behavior Ppt PowerPoint Presentation Images
This is a buyer behavior ppt powerpoint presentation images. This is a two stage process. The stages in this process are comparison, percentage, people, finance, business.

Location Ppt PowerPoint Presentation Pictures Mockup
This is a location ppt powerpoint presentation pictures mockup. This is a two stage process. The stages in this process are business, location, comparison, finance, global.
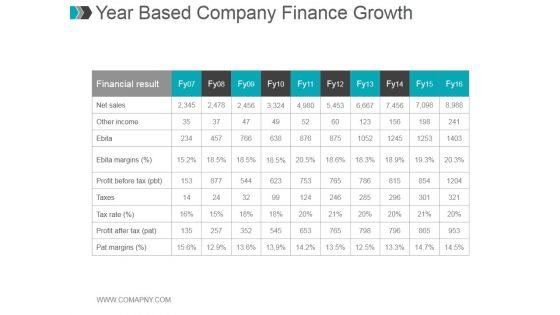
Year Based Company Finance Growth Ppt PowerPoint Presentation Layouts
This is a year based company finance growth ppt powerpoint presentation layouts. This is a ten stage process. The stages in this process are financial result, net sales, other income, ebita, ebita margins, profit before tax, taxes, tax rate, profit after tax, pat margins.

Donut Pie Chart Ppt PowerPoint Presentation Infographic Template Diagrams
This is a donut pie chart ppt powerpoint presentation infographic template diagrams. This is a three stage process. The stages in this process are business, strategy, analysis, pretention, comparison.
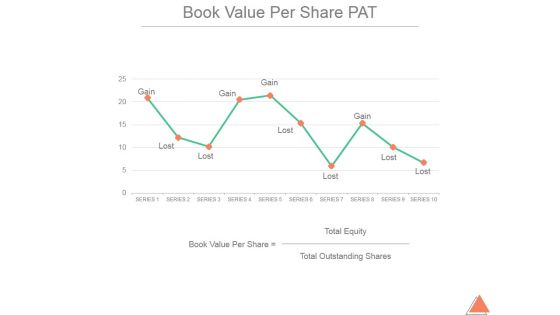
Book Value Per Share Pat Ppt PowerPoint Presentation Rules
This is a book value per share pat ppt powerpoint presentation rules. This is a ten stage process. The stages in this process are business, marketing, comparison, finance, analysis.
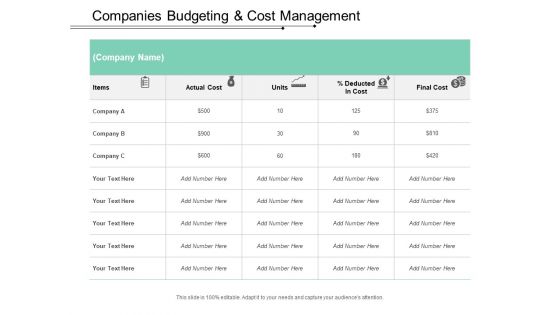
Companies Budgeting And Cost Management Ppt PowerPoint Presentation Portfolio Slide
This is a companies budgeting and cost management ppt powerpoint presentation portfolio slide. This is a five stage process. The stages in this process are cost control, money control, price control.

Company Annual Report Table With Percentages Ppt PowerPoint Presentation Slides
This is a company annual report table with percentages ppt powerpoint presentation slides. This is ten stage process. The stages in this process are send date time, email name, recipients, delivered, spam, opt out, open, transactions, revenue.
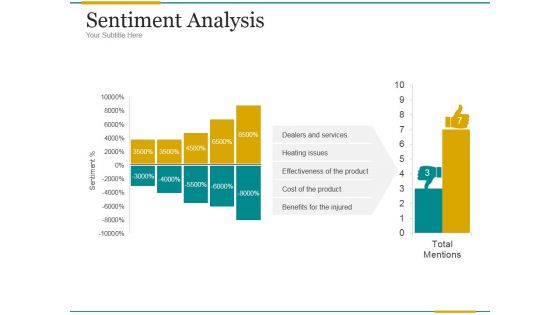
Sentiment Analysis Ppt PowerPoint Presentation Example File
This is a sentiment analysis ppt powerpoint presentation example file. This is a two stage process. The stages in this process are dealers and services, heating issues, effectiveness of the product, cost of the product, benefits for the injured.
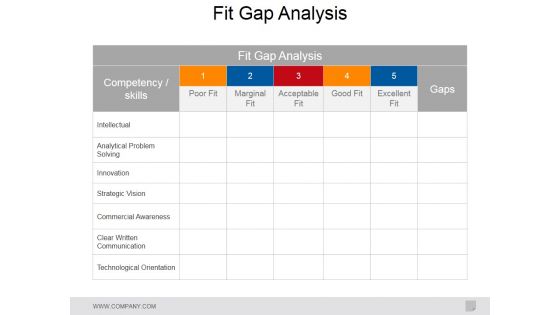
Fit Gap Analysis Ppt PowerPoint Presentation File Graphics Tutorials
This is a fit gap analysis ppt powerpoint presentation file graphics tutorials. This is a five stage process. The stages in this process are intellectual, analytical problem solving, innovation, strategic vision, commercial awareness, clear written communication, technological orientation.

Balance Sheet For Cash Management And Liquidity Analysis Ppt PowerPoint Presentation Inspiration Maker
This is a balance sheet for cash management and liquidity analysis ppt powerpoint presentation inspiration maker. This is a two stage process. The stages in this process are liquidity, cash assets, solvency.

Project Cost Management Budgeting And Control Ppt PowerPoint Presentation File Skills
This is a project cost management budgeting and control ppt powerpoint presentation file skills. This is a one stage process. The stages in this process are cost control, money control, price control.
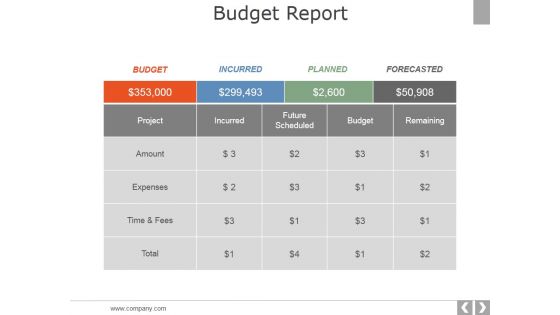
Budget Report Ppt PowerPoint Presentation Outline Examples
This is a budget report ppt powerpoint presentation outline examples. This is a five stage process. The stages in this process are project, amount, expenses, future scheduled, remaining.

 Home
Home