Financial Comparison

Year Over Year Revenue Growth Comparison Diagrams PDF
The given slide depicts the year over year comparison of quarterly revenue growth between two years, especially with the sources of revenue in order to track the profitability and incurring losses in the business. Showcasing this set of slides titled Year Over Year Revenue Growth Comparison Diagrams PDF. The topics addressed in these templates are Year Over Year, Revenue Growth, Comparison. All the content presented in this PPT design is completely editable. Download it and make adjustments in color, background, font etc. as per your unique business setting.

Raising Company Capital From Public Funding Sources Comparison Portrait PDF
This is a raising company capital from public funding sources comparison portrait pdf template with various stages. Focus and dispense information on two stages using this creative set, that comes with editable features. It contains large content boxes to add your information on topics like comparison, male, female. You can also showcase facts, figures, and other relevant content using this PPT layout. Grab it now.

Revenue And Expenses Comparison Historical And Projection Designs PDF
The slide provides the comparative graph of companys revenue and expenses for last 5 years historical and coming 4 years forecasted. Deliver an awe inspiring pitch with this creative revenue and expenses comparison historical and projection designs pdf bundle. Topics like revenue and expenses comparison historical and projection can be discussed with this completely editable template. It is available for immediate download depending on the needs and requirements of the user.

Actual And Forecasted E Commerce Revenue Analysis Comparison Clipart PDF
This slide shows the comparison between actual and forecasted revenue of e-commerce company products. Showcasing this set of slides titled Actual And Forecasted E Commerce Revenue Analysis Comparison Clipart PDF. The topics addressed in these templates are Actual Revenue, Forecasted Revenue, Bearish Market. All the content presented in this PPT design is completely editable. Download it and make adjustments in color, background, font etc. as per your unique business setting.
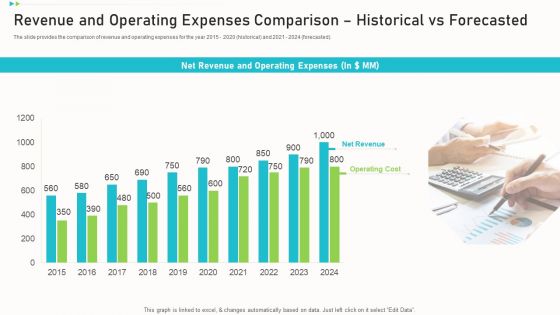
Revenue And Operating Expenses Comparison Historical Vs Forecasted Summary PDF
The slide provides the comparison of revenue and operating expenses for the year 2015 - 2020 historical and 2021 - 2024 forecasted. Deliver an awe inspiring pitch with this creative revenue and operating expenses comparison historical vs forecasted summary pdf bundle. Topics like net revenue, operating cost, operating expenses can be discussed with this completely editable template. It is available for immediate download depending on the needs and requirements of the user.
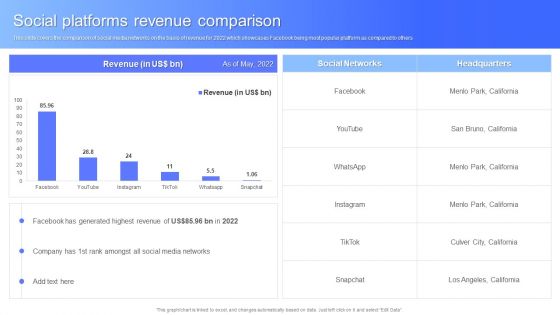
Social Platforms Revenue Comparison Facebook Business Outline Download PDF
This slide covers the comparison of social media networks on the basis of revenue for 2022 which showcases Facebook being most popular platform as compared to others. Deliver an awe inspiring pitch with this creative Social Platforms Revenue Comparison Facebook Business Outline Download PDF bundle. Topics like Revenue, Social Media Networks can be discussed with this completely editable template. It is available for immediate download depending on the needs and requirements of the user.
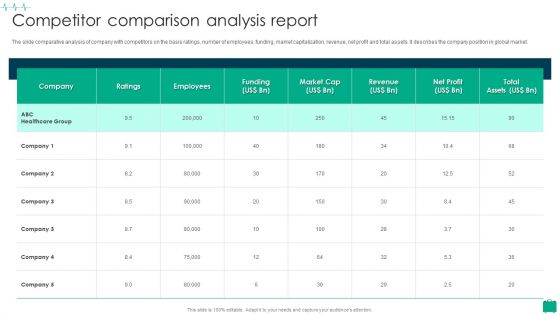
Healthcare Services Company Profile Competitor Comparison Analysis Report Summary PDF
The slide comparative analysis of company with competitors on the basis ratings, number of employees, funding, market capitalization, revenue, net profit and total assets. It describes the company position in global market.Deliver an awe inspiring pitch with this creative Healthcare Services Company Profile Competitor Comparison Analysis Report Summary PDF bundle. Topics like Competitor Comparison, Analysis Report can be discussed with this completely editable template. It is available for immediate download depending on the needs and requirements of the user.

Fiscal And Operational Assessment Valuation Methods Comparison Rules PDF
Presenting fiscal and operational assessment valuation methods comparison rules pdf to provide visual cues and insights. Share and navigate important information on three stages that need your due attention. This template can be used to pitch topics like valuation method, results, comments. In addtion, this PPT design contains high resolution images, graphics, etc, that are easily editable and available for immediate download.
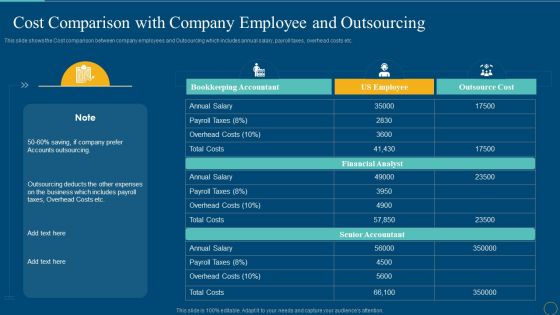
Cost Comparison With Company Employee And Outsourcing Sample PDF
This slide shows the Cost comparison between company employees and Outsourcing which includes annual salary, payroll taxes, overhead costs etc.Deliver an awe inspiring pitch with this creative cost comparison with company employee and outsourcing sample pdf bundle. Topics like bookkeeping accountant, accounts outsourcing, outsourcing deducts can be discussed with this completely editable template. It is available for immediate download depending on the needs and requirements of the user.

Cost Comparison Of In House Employee And Outsourcing Sample PDF
This slide represents the cost comparison between employees and outsourcing. It includes factors such as annual salary, payroll taxes and overhead costs. Showcasing this set of slides titled Cost Comparison Of In House Employee And Outsourcing Sample PDF. The topics addressed in these templates are Payroll Taxes, Overhead Costs, Web Designer. All the content presented in this PPT design is completely editable. Download it and make adjustments in color, background, font etc. as per your unique business setting.
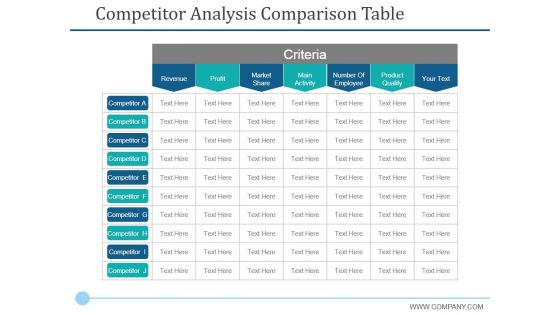
Competitor Analysis Comparison Table Ppt PowerPoint Presentation Infographic Template Graphics
This is a competitor analysis comparison table ppt powerpoint presentation infographic template graphics. This is a seven stage process. The stages in this process are profit, revenue, market share, main activity, criteria.
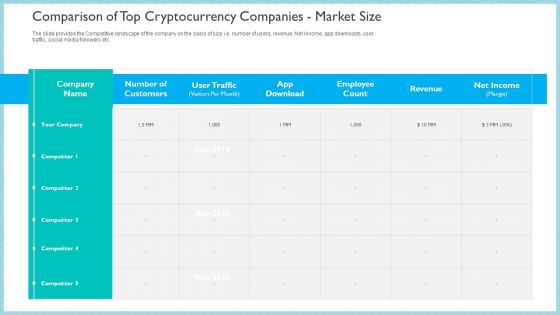
Comparison Of Top Cryptocurrency Companies Market Size Topics PDF
The slide provides the Competitive landscape of the company on the basis of size i.e. number of users, revenue, Net income, app downloads, user traffic, social media followers etc.Deliver an awe-inspiring pitch with this creative comparison of top cryptocurrency companies market size topics pdf bundle. Topics like comparison of top cryptocurrency companies market size topics pdf can be discussed with this completely editable template. It is available for immediate download depending on the needs and requirements of the user.
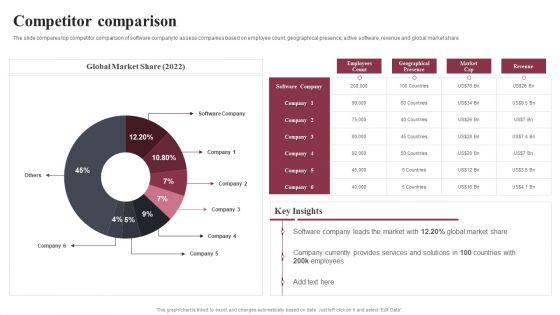
Business Software Development Company Profile Competitor Comparison Summary PDF
The slide compares top competitor comparison of software company to assess companies based on employee count, geographical presence, active software, revenue and global market share. Deliver and pitch your topic in the best possible manner with this Business Software Development Company Profile Competitor Comparison Summary PDF. Use them to share invaluable insights on Global Market Share, Software Company, Employees and impress your audience. This template can be altered and modified as per your expectations. So, grab it now.
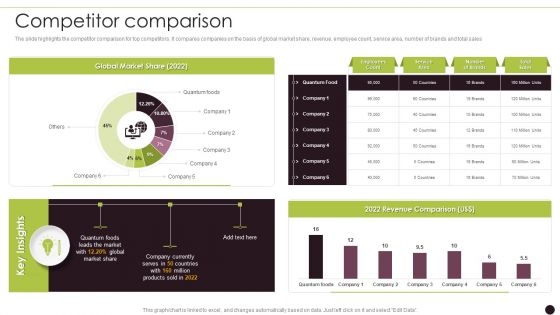
Canned Food Company Profile Competitor Comparison Topics PDF
The slide highlights the competitor comparison for top competitors. It compares companies on the basis of global market share, revenue, employee count, service area, number of brands and total sales Deliver and pitch your topic in the best possible manner with this Canned Food Company Profile Competitor Comparison Topics PDF. Use them to share invaluable insights on Global Market, Employees Count, Service Area and impress your audience. This template can be altered and modified as per your expectations. So, grab it now.

Engineering Solutions Company Detail Competitor Comparison Demonstration PDF
The slide highlights the competitor comparison for top competitors. It compares companies on the basis of global market share, revenue, employee count, location served and services offered.Deliver an awe inspiring pitch with this creative Engineering Solutions Company Detail Competitor Comparison Demonstration PDF bundle. Topics like Quantum Engineering, Quantum Engineering, Service Offered can be discussed with this completely editable template. It is available for immediate download depending on the needs and requirements of the user.
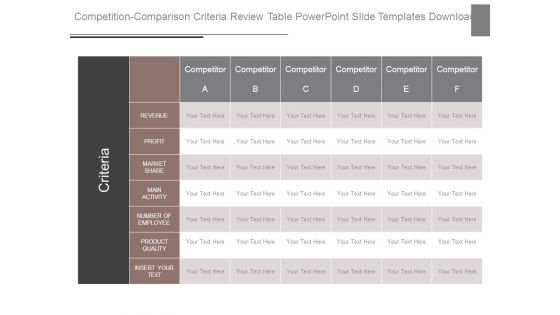
Competition Comparison Criteria Review Table Powerpoint Slide Templates Download
This is a competition comparison criteria review table powerpoint slide templates download. This is a six stage process. The stages in this process are criteria, competitor revenue, profit, market share, main activity, number of employee, product quality, insert your text.

Competition Comparison Table For New Business Presentation Powerpoint Templates
This is a competition comparison table for new business presentation powerpoint templates. This is a seven stage process. The stages in this process are criteria, revenue, profit, market share, main activity, number of employee, product quality, insert your text.

Comparison Based On Criteria Ppt PowerPoint Presentation File Templates
This is a comparison based on criteria ppt powerpoint presentation file templates. This is a seven stage process. The stages in this process are revenue, market share, main activity, number of employees, product quality, insert your own text.

Software Products And Solutions Firm Details Competitor Comparison Formats PDF
The slide compares top competitor comparison of software company to assess companies based on employee count, geographical presence, active software, revenue and global market share. Deliver and pitch your topic in the best possible manner with this Software Products And Solutions Firm Details Competitor Comparison Formats PDF. Use them to share invaluable insights on Global Market Share, 2022, Employees Count and impress your audience. This template can be altered and modified as per your expectations. So, grab it now.
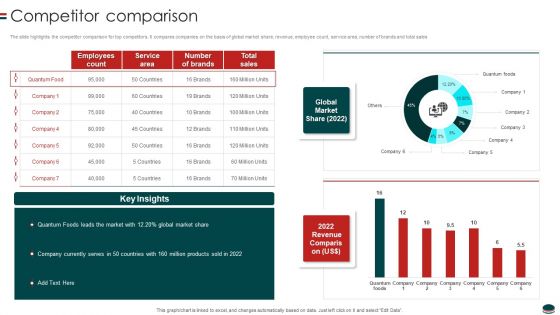
Instant Snacks And Food Firm Details Competitor Comparison Formats PDF
The slide highlights the competitor comparison for top competitors. It compares companies on the basis of global market share, revenue, employee count, service area, number of brands and total sales.Deliver and pitch your topic in the best possible manner with this Instant Snacks And Food Firm Details Competitor Comparison Formats PDF Use them to share invaluable insights on Employees Count, Service Area, Total Sales and impress your audience. This template can be altered and modified as per your expectations. So, grab it now.
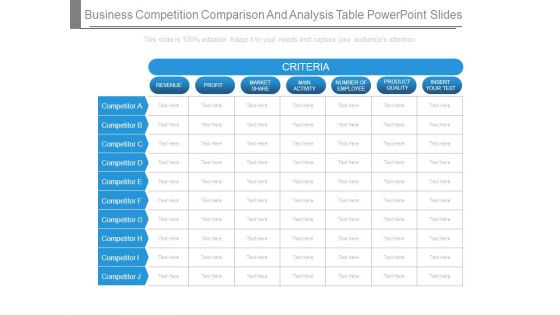
Business Competition Comparison And Analysis Table Powerpoint Slides
This is a business competition comparison and analysis table powerpoint slides. This is a six stage process. The stages in this process are criteria, revenue, profit, market share, main activity, number of employee, product quality, competitor.

Competitor Analysis Comparison Table Ppt PowerPoint Presentation Infographics Design Inspiration
This is a competitor analysis comparison table ppt powerpoint presentation infographics design inspiration. This is a seven stage process. The stages in this process are revenue, profit, market share, main activity.
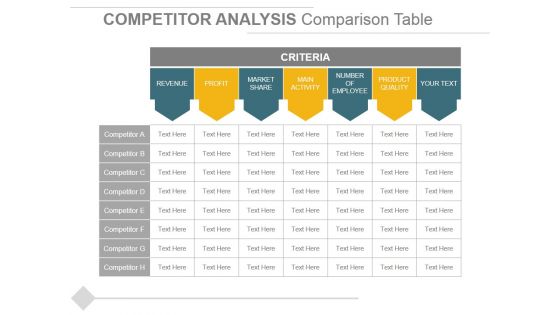
Competitor Analysis Comparison Table Ppt PowerPoint Presentation Outline Slides
This is a competitor analysis comparison table ppt powerpoint presentation outline slides. This is a two stage process. The stages in this process are revenue, profit, market share, main activity, number of employee, product quality.
Competitor Analysis Comparison Table Ppt PowerPoint Presentation Icon Designs Download
This is a competitor analysis comparison table ppt powerpoint presentation icon designs download. This is a seven stage process. The stages in this process are revenue, profit, market share, main activity, number of employee, product quality.
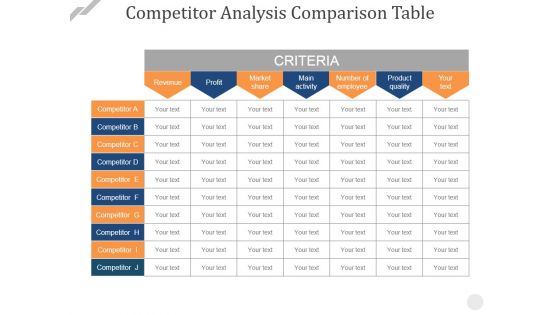
Competitor Analysis Comparison Table Ppt PowerPoint Presentation Show Grid
This is a competitor analysis comparison table ppt powerpoint presentation show grid. This is a seven stage process. The stages in this process are revenue, profit, market share, main activity, number of employee.

Competition Comparison Table For New Business Ppt PowerPoint Presentation Slides
This is a competition comparison table for new business ppt powerpoint presentation slides. This is a seven stage process. The stages in this process are criteria, revenue, profit, market share, main activity, number of employee, product quality, competitor.
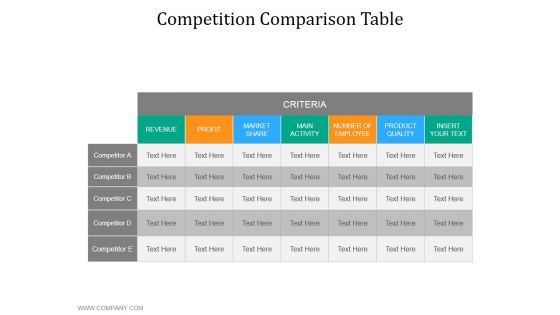
Competition Comparison Table Ppt PowerPoint Presentation Pictures File Formats
This is a competition comparison table ppt powerpoint presentation pictures file formats. This is a seven stage process. The stages in this process are revenue, profit, market share, main activity, number of employee, product quality.
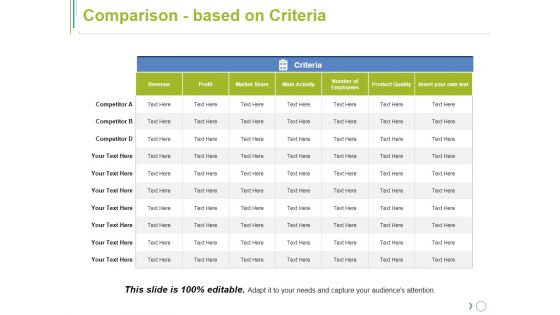
Comparison Based On Criteria Ppt PowerPoint Presentation Model Inspiration
This is a comparison based on criteria ppt powerpoint presentation model inspiration. This is a seven stage process. The stages in this process are revenue, profit, market share, number of employees, product quality.

Competition Comparison Table Ppt PowerPoint Presentation Visual Aids
This is a competition comparison table ppt powerpoint presentation visual aids. This is a six stage process. The stages in this process are revenue, profit, market share, main activity, number of employee, product quality.

Year Over Year Growth Comparison Brand Techniques Structure Designs PDF
Following slide displays yearly growth comparison informational statistics. It includes details about revenues, operating profit and net profit. Deliver an awe inspiring pitch with this creative year over year growth comparison brand techniques structure designs pdf bundle. Topics like revenue, growth, profit can be discussed with this completely editable template. It is available for immediate download depending on the needs and requirements of the user.
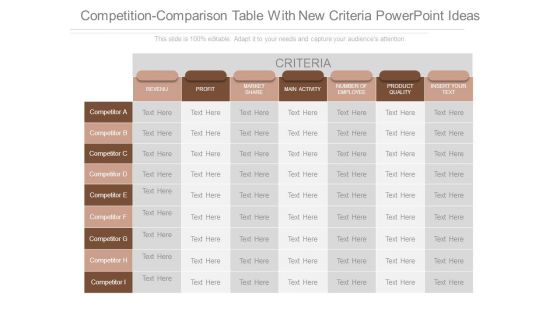
Competition Comparison Table With New Criteria Powerpoint Ideas
This is a competition comparison table with new criteria powerpoint ideas. This is a seven stage process. The stages in this process are revenu, profit, market share, main activity, number of employee, product quality, insert your text.

competition comparison table ppt powerpoint presentation infographics design inspiration
This is a competition comparison table ppt powerpoint presentation infographics design inspiration. This is a seven stage process. The stages in this process are revenue, profit, market share, main activity, number of employee.
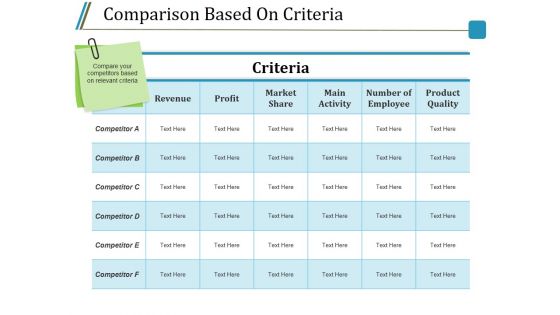
Comparison Based On Criteria Ppt PowerPoint Presentation Outline Pictures
This is a comparison based on criteria ppt powerpoint presentation outline pictures. This is a six stage process. The stages in this process are revenue, profit, market share, main activity, number of employee.
Comparison Based On Criteria Ppt PowerPoint Presentation Show Icon
This is a comparison based on criteria ppt powerpoint presentation show icon. This is a six stage process. The stages in this process are revenue, profit, market share, main activity, number of employee.

Comparison Based On Criteria Ppt PowerPoint Presentation Gallery Themes
This is a comparison based on criteria ppt powerpoint presentation gallery themes. This is a seven stage process. The stages in this process are revenue, profit, market share, main activity, product quality.

Comparison Based On Criteria Ppt PowerPoint Presentation Gallery Sample
This is a comparison based on criteria ppt powerpoint presentation gallery sample. This is a six stage process. The stages in this process are revenue, profit, market share, main activity, number of employee.
Comparison Based On Criteria Ppt PowerPoint Presentation Icon Example Introduction
This is a comparison based on criteria ppt powerpoint presentation icon example introduction. This is a six stage process. The stages in this process are criteria, revenue, profit, market share, main activity.
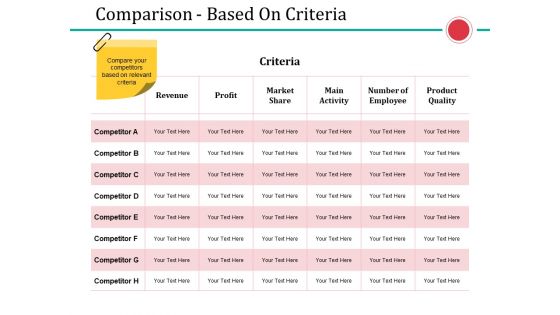
Comparison Based On Criteria Ppt PowerPoint Presentation Show File Formats
This is a comparison based on criteria ppt powerpoint presentation show file formats. This is a six stage process. The stages in this process are revenue, profit, market share, main activity, number of employee.
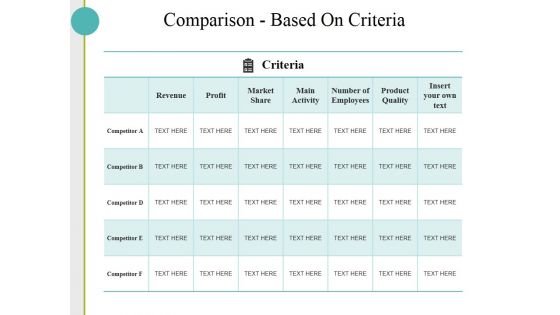
Comparison Based On Criteria Ppt PowerPoint Presentation Slides Skills
This is a comparison based on criteria ppt powerpoint presentation slides skills. This is a five stage process. The stages in this process are revenue, profit, market share, main activity, number of employees, product quality.
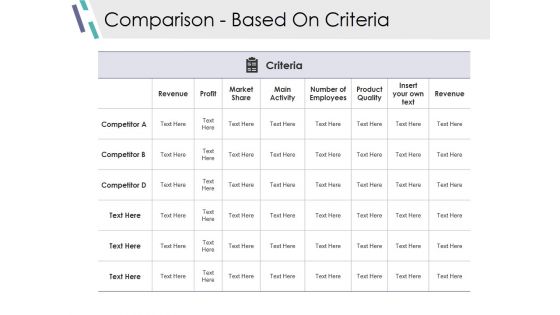
Comparison Based On Criteria Ppt PowerPoint Presentation Show Outline
This is a comparison based on criteria ppt powerpoint presentation show outline. This is a six stage process. The stages in this process are revenue, profit, market share, main activity, number of employees.
Comparison Based On Criteria Ppt PowerPoint Presentation Show Graphics Pictures
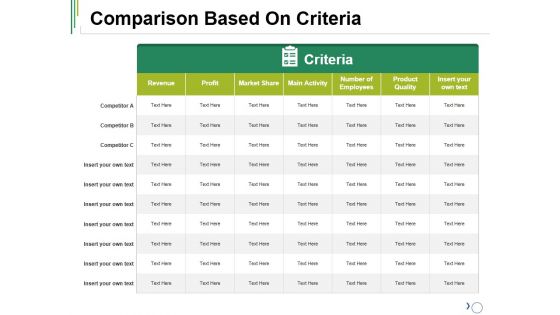
This is a comparison based on criteria ppt powerpoint presentation show graphics pictures. This is a seven stage process. The stages in this process are competitor, revenue, profit, market share, main activity.

Comparison Based On Criteria Ppt PowerPoint Presentation Styles Picture
This is a comparison based on criteria ppt powerpoint presentation styles picture. This is a five stage process. The stages in this process are competitor, revenue, profit, criteria, market share.

Comparison Based On Criteria Ppt PowerPoint Presentation Styles Designs
This is a comparison based on criteria ppt powerpoint presentation styles designs. This is a three stage process. The stages in this process are revenue, profit, market share, main activity, number of employees, product quality.

Comparison Based On Criteria Ppt PowerPoint Presentation Show Background Image
This is a comparison based on criteria ppt powerpoint presentation show background image. This is a seven stage process. The stages in this process are revenue, market share, main activity, number of employees, product quality, insert your own text.

Comparison Based On Criteria Ppt PowerPoint Presentation Model Layouts
This is a comparison based on criteria ppt powerpoint presentation model layouts. This is a seven stage process. The stages in this process are revenue, profit, market share, main activity, product quality.
Comparison Based On Criteria Ppt PowerPoint Presentation Gallery Information
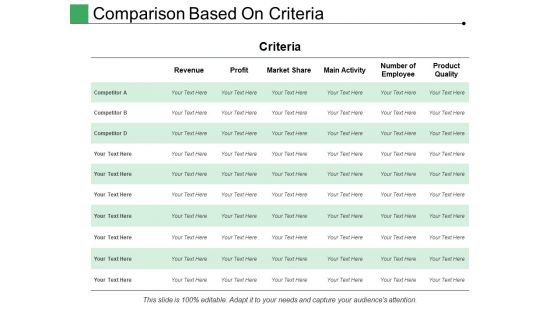
This is a comparison based on criteria ppt powerpoint presentation gallery information. This is a six stage process. The stages in this process are criteria, revenue, profit, business, competitor.
Actual And Forecasted Online Sales Comparison Pictures PDF
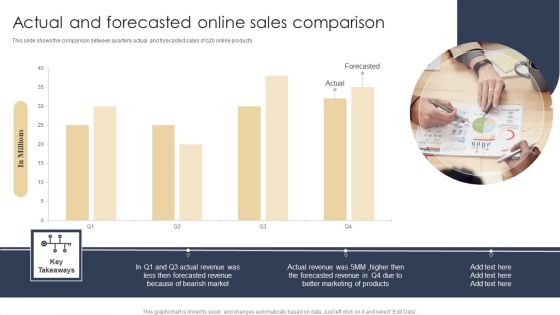
This slide shows the comparison between quarterly actual and forecasted sales of b2b online products. Showcasing this set of slides titled Actual And Forecasted Online Sales Comparison Pictures PDF. The topics addressed in these templates are Revenue, Marketing Of Products. All the content presented in this PPT design is completely editable. Download it and make adjustments in color, background, font etc. as per your unique business setting.
Business PowerPoint Template Comparison Between Dollar And Euros Ppt Templates
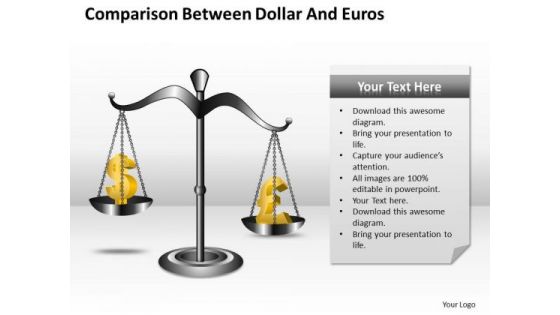
Analyse ailments on our Business powerpoint template comparison between dollar and euros ppt templates. Bring out the thinking doctor in you. Dock your thoughts with our Marketing PowerPoint Templates. They will launch them into orbit. Get out of the dock with our Targets PowerPoint Templates. Your mind will be set free.
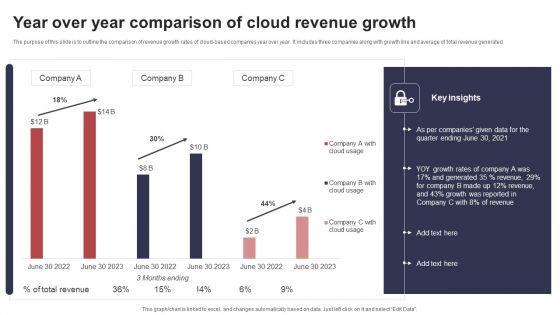
Year Over Year Comparison Of Cloud Revenue Growth Sample PDF
The purpose of this slide is to outline the comparison of revenue growth rates of cloud based companies year over year. It includes three companies along with growth line and average of total revenue generated. Showcasing this set of slides titled Year Over Year Comparison Of Cloud Revenue Growth Sample PDF. The topics addressed in these templates are Yoy Growth Rates, Generated, Growth Reported. All the content presented in this PPT design is completely editable. Download it and make adjustments in color, background, font etc. as per your unique business setting.
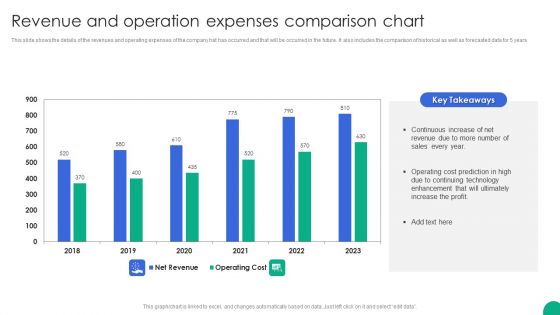
Revenue And Operation Expenses Comparison Chart Slides PDF
This slide shows the details of the revenues and operating expenses of the company hat has occurred and that will be occurred in the future. It also includes the comparison of historical as well as forecasted data for 5 years.Showcasing this set of slides titled Revenue And Operation Expenses Comparison Chart Slides PDF. The topics addressed in these templates are Continuous Increase, Operating Cost, Enhancement Ultimately. All the content presented in this PPT design is completely editable. Download it and make adjustments in color, background, font etc. as per your unique business setting.
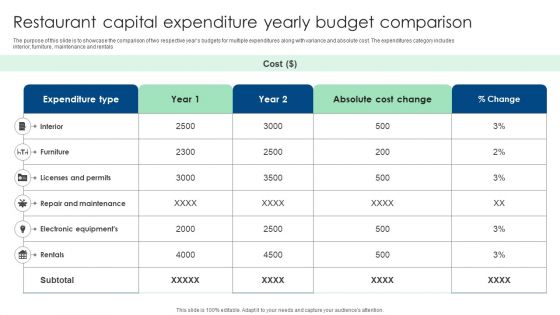
Restaurant Capital Expenditure Yearly Budget Comparison Ppt Professional Guide PDF
The purpose of this slide is to showcase the comparison of two respective years budgets for multiple expenditures along with variance and absolute cost. The expenditures category includes interior, furniture, maintenance and rentals. Showcasing this set of slides titled Restaurant Capital Expenditure Yearly Budget Comparison Ppt Professional Guide PDF. The topics addressed in these templates are Expenditure Type, Licenses And Permits, Absolute Cost Change. All the content presented in this PPT design is completely editable. Download it and make adjustments in color, background, font etc. as per your unique business setting.

Equity Capital Funding Product Comparison Ppt Infographics Example File PDF
Deliver and pitch your topic in the best possible manner with this equity capital funding product comparison ppt infographics example file pdf. Use them to share invaluable insights on indirect competitor, company and impress your audience. This template can be altered and modified as per your expectations. So, grab it now.
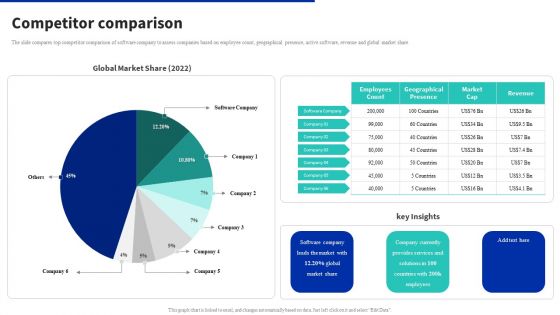
Digital Products Company Outline Competitor Comparison Ideas PDF
The slide compares top competitor comparison of software company to assess companies based on employee count, geographical presence, active software, revenue and global market share. Here you can discover an assortment of the finest PowerPoint and Google Slides templates. With these templates, you can create presentations for a variety of purposes while simultaneously providing your audience with an eye catching visual experience. Download Digital Products Company Outline Competitor Comparison Ideas PDF to deliver an impeccable presentation. These templates will make your job of preparing presentations much quicker, yet still, maintain a high level of quality. Slidegeeks has experienced researchers who prepare these templates and write high quality content for you. Later on, you can personalize the content by editing the Digital Products Company Outline Competitor Comparison Ideas PDF.
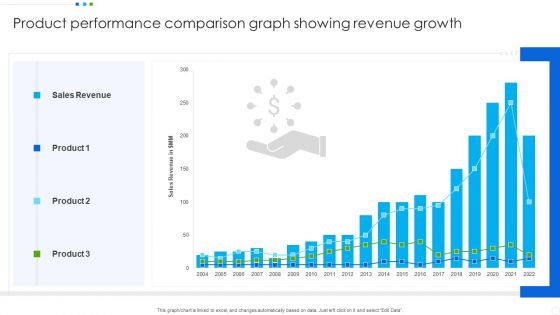
Product Performance Comparison Graph Showing Revenue Growth Portrait PDF
Showcasing this set of slides titled Product Performance Comparison Graph Showing Revenue Growth Portrait PDF. The topics addressed in these templates are Sales Revenue, Product. All the content presented in this PPT design is completely editable. Download it and make adjustments in color, background, font etc. as per your unique business setting.

Fitbit Venture Capital Investment Elevator Comparison Topics PDF
This is a fitbit venture capital investment elevator comparison topics pdf template with various stages. Focus and dispense information on two stages using this creative set, that comes with editable features. It contains large content boxes to add your information on topics like women, men. You can also showcase facts, figures, and other relevant content using this PPT layout. Grab it now.

Competitor Comparison Health And Property Insurance Company Profile Slides PDF
The slide highlights top competitors of insurance company in global market. It depicts company comparison on the basis of total policy holders, revenue per customer, cost per claim, return on surplus, renewal rate and policy sales growth. Deliver and pitch your topic in the best possible manner with this Competitor Comparison Health And Property Insurance Company Profile Slides PDF. Use them to share invaluable insights on Company, Revenue, Sales Growth and impress your audience. This template can be altered and modified as per your expectations. So, grab it now.
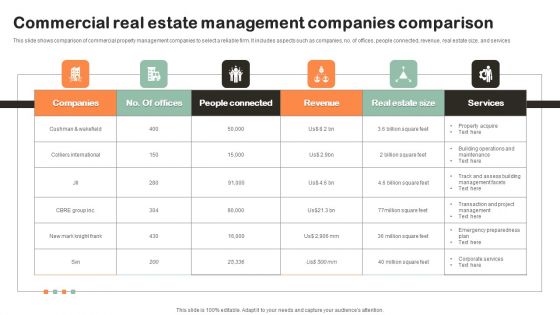
Commercial Real Estate Management Companies Comparison Themes PDF
This slide shows comparison of commercial property management companies to select a reliable firm. It includes aspects such as companies, no. of offices, people connected, revenue, real estate size, and services. Pitch your topic with ease and precision using this Commercial Real Estate Management Companies Comparison Themes PDF. This layout presents information on Revenue, Real Estate Size, Services. It is also available for immediate download and adjustment. So, changes can be made in the color, design, graphics or any other component to create a unique layout.
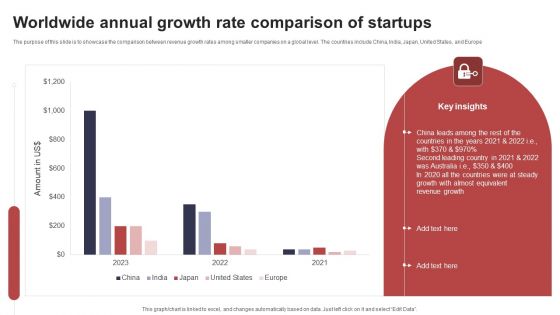
Worldwide Annual Growth Rate Comparison Of Startups Template PDF
The purpose of this slide is to showcase the comparison between revenue growth rates among smaller companies on a global level. The countries include China, India, Japan, United States, and Europe. Pitch your topic with ease and precision using this Worldwide Annual Growth Rate Comparison Of Startups Template PDF. This layout presents information on China Leads Among, Almost Equivalent, Revenue Growth. It is also available for immediate download and adjustment. So, changes can be made in the color, design, graphics or any other component to create a unique layout.

Insurance Services Firm Profile Competitor Comparison Clipart PDF
The slide highlights top competitors of insurance company in global market. It depicts company comparison on the basis of total policy holders, revenue per customer, cost per claim, return on surplus, renewal rate and policy sales growth. Deliver an awe inspiring pitch with this creative Insurance Services Firm Profile Competitor Comparison Clipart PDF bundle. Topics like Revenue, Average Cost, Renewal Rate can be discussed with this completely editable template. It is available for immediate download depending on the needs and requirements of the user.

Comparison Of Top Smartphone Companies Ppt Professional Show PDF
The following slide exhibits the comparative assessment of major players in the smartphone industry such as Apple, Nokia, Samsung, LG and Sony-Ericson. The comparison is made on the basis of products offered and no. of units sold. Make sure to capture your audiences attention in your business displays with our gratis customizable Comparison Of Top Smartphone Companies Ppt Professional Show PDF. These are great for business strategies, office conferences, capital raising or task suggestions. If you desire to acquire more customers for your tech business and ensure they stay satisfied, create your own sales presentation with these plain slides.

 Home
Home