Finance Kpi
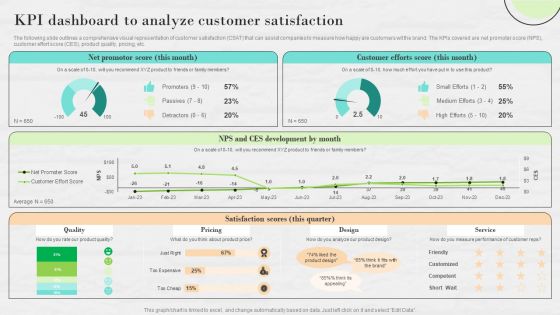
Market Research To Determine Business Opportunities KPI Dashboard To Analyze Customer Satisfaction Graphics PDF
The following slide outlines a comprehensive visual representation of customer satisfaction CSAT that can assist companies to measure how happy are customers wit the brand. The KPIs covered are net promoter score NPS, customer effort score CES, product quality, pricing, etc.Are you in need of a template that can accommodate all of your creative concepts This one is crafted professionally and can be altered to fit any style. Use it with Google Slides or PowerPoint. Include striking photographs, symbols, depictions, and other visuals. Fill, move around, or remove text boxes as desired. Test out color palettes and font mixtures. Edit and save your work, or work with colleagues. Download Market Research To Determine Business Opportunities KPI Dashboard To Analyze Customer Satisfaction Graphics PDF and observe how to make your presentation outstanding. Give an impeccable presentation to your group and make your presentation unforgettable.

KPI Dashboard To Track Digital Transformation Initiatives Ppt Show Backgrounds PDF
Following slide provides dashboard that can be used by the businesses to measure the performance of digital transformation initiatives with the help of different KPIs. KPIs covered are social presence, click through rate, sales revenue, churn amount etc. The KPI Dashboard To Track Digital Transformation Initiatives Ppt Show Backgrounds PDF is a compilation of the most recent design trends as a series of slides. It is suitable for any subject or industry presentation, containing attractive visuals and photo spots for businesses to clearly express their messages. This template contains a variety of slides for the user to input data, such as structures to contrast two elements, bullet points, and slides for written information. Slidegeeks is prepared to create an impression.
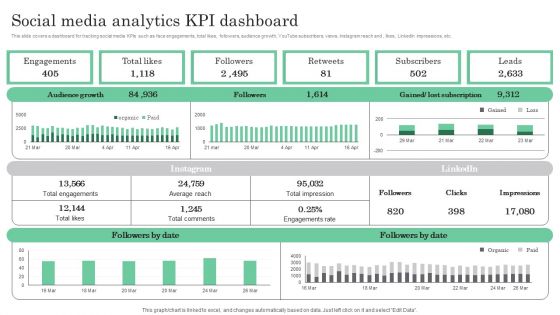
Online Marketing Analytics To Enhance Business Growth Social Media Analytics KPI Dashboard Brochure PDF
This slide covers a dashboard for tracking social media KPIs such as face engagements, total likes, followers, audience growth, YouTube subscribers, views, Instagram reach and , likes, LinkedIn impressions, etc. Slidegeeks is here to make your presentations a breeze with Online Marketing Analytics To Enhance Business Growth Social Media Analytics KPI Dashboard Brochure PDF With our easy to use and customizable templates, you can focus on delivering your ideas rather than worrying about formatting. With a variety of designs to choose from, you are sure to find one that suits your needs. And with animations and unique photos, illustrations, and fonts, you can make your presentation pop. So whether you are giving a sales pitch or presenting to the board, make sure to check out Slidegeeks first.
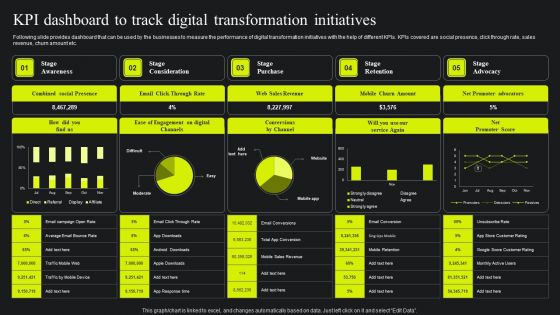
KPI Dashboard To Track Digital Transformation Initiatives Ppt Styles Graphics PDF
Following slide provides dashboard that can be used by the businesses to measure the performance of digital transformation initiatives with the help of different KPIs. KPIs covered are social presence, click through rate, sales revenue, churn amount etc. Take your projects to the next level with our ultimate collection of KPI Dashboard To Track Digital Transformation Initiatives Ppt Styles Graphics PDF. Slidegeeks has designed a range of layouts that are perfect for representing task or activity duration, keeping track of all your deadlines at a glance. Tailor these designs to your exact needs and give them a truly corporate look with your own brand colors they will make your projects stand out from the rest.
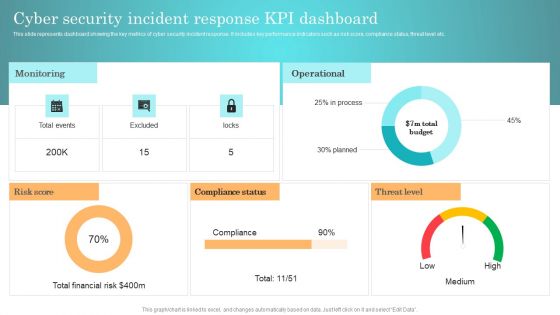
Incident Response Techniques Deployement Cyber Security Incident Response KPI Dashboard Background PDF
This slide represents dashboard showing the key metrics of cyber security incident response. It includes key performance indicators such as risk score, compliance status, threat level etc. From laying roadmaps to briefing everything in detail, our templates are perfect for you. You can set the stage with your presentation slides. All you have to do is download these easy to edit and customizable templates. Incident Response Techniques Deployement Cyber Security Incident Handler Contact Information Guidelines PDF will help you deliver an outstanding performance that everyone would remember and praise you for. Do download this presentation today.
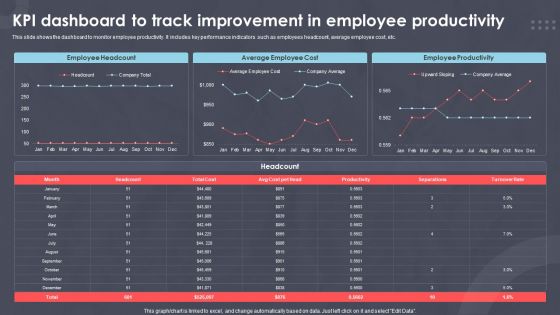
Kpi Dashboard To Track Improvement In Employee Productivity Ppt PowerPoint Presentation Outline Samples PDF
This slide shows the dashboard to monitor employee productivity. It includes key performance indicators such as employees headcount, average employee cost, etc.Showcasing this set of slides titled XXXXXXXXX. The topics addressed in these templates are Employee Headcount, Average Employee, Employee Productivity. All the content presented in this PPT design is completely editable. Download it and make adjustments in color, background, font etc. as per your unique business setting.
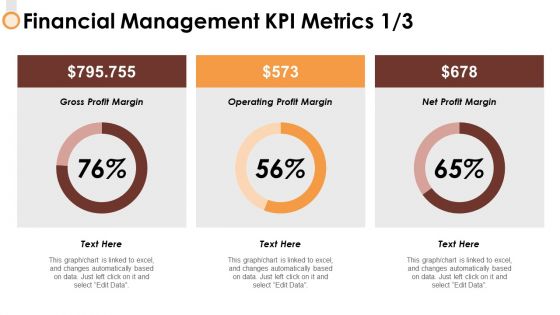
Financial Management Kpi Metrics 1 3 Ppt PowerPoint Presentation Ideas Mockup
This is a financial management kpi metrics 1 3 ppt powerpoint presentation ideas mockup. This is a three stage process. The stages in this process are finance, strategy, marketing, compare, business.
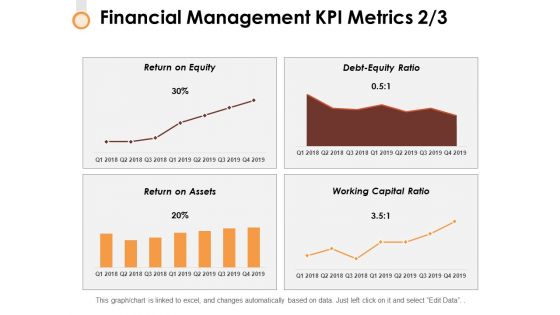
Financial Management Kpi Metrics 2 3 Ppt PowerPoint Presentation Professional Objects
This is a financial management kpi metrics 2 3 ppt powerpoint presentation professional objects. This is a four stage process. The stages in this process are finance, strategy, marketing, management, business.
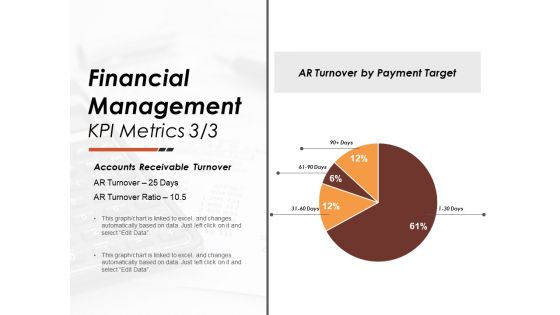
Financial Management Kpi Metrics 3 3 Ppt PowerPoint Presentation Summary Themes
This is a financial management kpi metrics 3 3 ppt powerpoint presentation summary themes. This is a four stage process. The stages in this process are finance, strategy, marketing, management, business.

Financial Management Kpi Dashboards Strategy Ppt Powerpoint Presentation Gallery Graphics Template
This is a financial management kpi dashboards strategy ppt powerpoint presentation gallery graphics template. This is a six stage process. The stages in this process are finance, marketing, management, investment, analysis.

Financial Management Kpi Metrics Management Ppt Powerpoint Presentation Infographic Template Graphic Images
This is a financial management kpi metrics management ppt powerpoint presentation infographic template graphic images. This is a four stage process. The stages in this process are finance, marketing, management, investment, analysis.
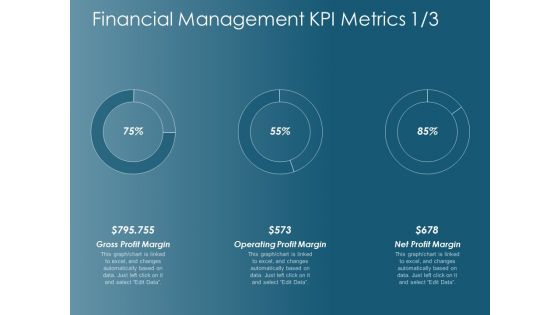
Financial Management Kpi Metrics Operating Profit Margin Ppt Powerpoint Presentation Infographic Template Images
This is a financial management kpi metrics operating profit margin ppt powerpoint presentation infographic template images. This is a three stage process. The stages in this process are finance, marketing, management, investment, analysis.

Retail Kpi Dashboard Showing Revenue Vs Units Sold Ppt PowerPoint Presentation File Formats
This is a retail kpi dashboard showing revenue vs units sold ppt powerpoint presentation file formats. This is a three stage process. The stages in this process are finance, marketing, management, investment, analysis.
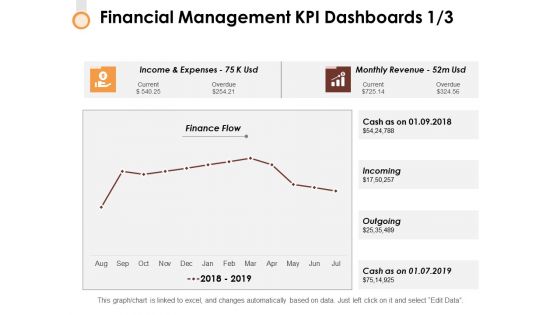
Financial Management Kpi Dashboards 1 3 Ppt PowerPoint Presentation Outline Background
This is a financial management kpi dashboards 1 3 ppt powerpoint presentation outline background. This is a four stage process. The stages in this process are finance, strategy, marketing, compare, business.

Financial Management Kpi Dashboards 2 3 Ppt PowerPoint Presentation Infographic Template Format Ideas
This is a financial management kpi dashboards 2 3 ppt powerpoint presentation infographic template format ideas. This is a two stage process. The stages in this process are finance, strategy, marketing, compare, business.
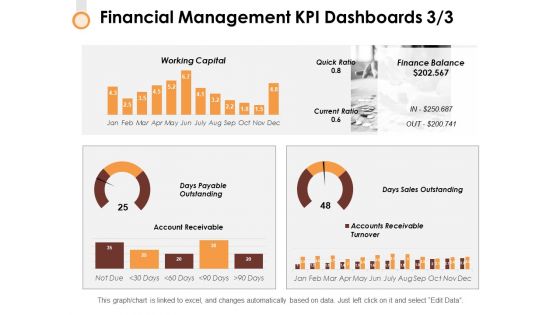
Financial Management Kpi Dashboards 3 3 Ppt PowerPoint Presentation Layouts Graphics Template
This is a financial management kpi dashboards 3 3 ppt powerpoint presentation layouts graphics template. This is a two stage process. The stages in this process are finance, strategy, marketing, compare, business.

Information Technology Functions Management Infrastructure KPI Metrics Showing Square Meter Area Summary PDF
Presenting information technology functions management infrastructure kpi metrics showing square meter area summary pdf to provide visual cues and insights. Share and navigate important information on three stages that need your due attention. This template can be used to pitch topics like square meter price, actual construction time, no activities starting time. In addition, this PPT design contains high-resolution images, graphics, etc, that are easily editable and available for immediate download.

Retail KPI Metrics Showing Average Purchase Value And Online Sales Template PDF
This is a retail kpi metrics showing average purchase value and online sales template pdf. template with various stages. Focus and dispense information on four stages using this creative set, that comes with editable features. It contains large content boxes to add your information on topics like sales per square foot, average purchase, value customers satisfied, online sales. You can also showcase facts, figures, and other relevant content using this PPT layout. Grab it now.

KPI Dashboard To Assess Deals In Mergers And Acquisitions Strategy Rules PDF
Following slide showcases dashboard for mergers and acquisitions to measure effects of milestones to confirm integration plan accordingly. It presents information related to deals by types, country, etc. Pitch your topic with ease and precision using this KPI Dashboard To Assess Deals In Mergers And Acquisitions Strategy Rules PDF. This layout presents information on Status, Strategy, Minority Equity Stake. It is also available for immediate download and adjustment. So, changes can be made in the color, design, graphics or any other component to create a unique layout.
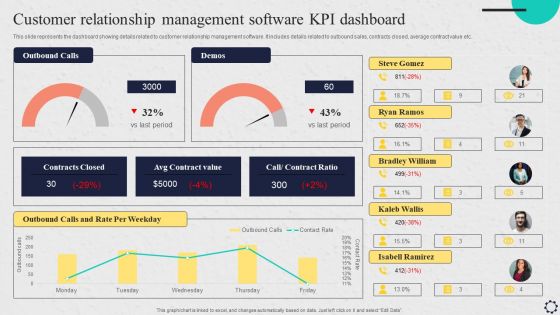
Software Implementation Strategy Customer Relationship Management Software Kpi Dashboard Clipart PDF
This slide represents the dashboard showing details related to customer relationship management software. It includes details related to outbound sales, contracts closed, average contract value etc. Are you in need of a template that can accommodate all of your creative concepts This one is crafted professionally and can be altered to fit any style. Use it with Google Slides or PowerPoint. Include striking photographs, symbols, depictions, and other visuals. Fill, move around, or remove text boxes as desired. Test out color palettes and font mixtures. Edit and save your work, or work with colleagues. Download Software Implementation Strategy Customer Relationship Management Software Kpi Dashboard Clipart PDF and observe how to make your presentation outstanding. Give an impeccable presentation to your group and make your presentation unforgettable.

Financial Management Kpi Metrics Business Ppt Powerpoint Presentation Gallery File Formats
This is a financial management kpi metrics business ppt powerpoint presentation gallery file formats. This is a four stage process. The stages in this process are finance, marketing, management, investment, analysis.

Financial Management Kpi Metrics Process Ppt Powerpoint Presentation Slides Graphics Download
This is a financial management kpi metrics process ppt powerpoint presentation slides graphics download. This is a four stage process. The stages in this process are finance, marketing, management, investment, analysis.
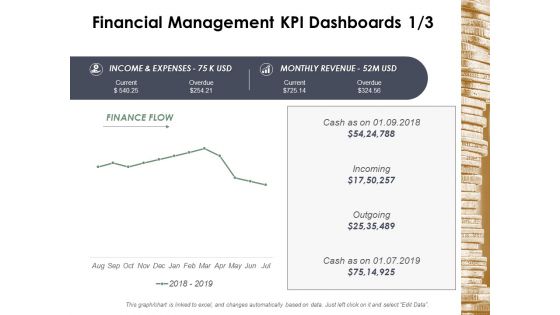
Financial Management Kpi Dashboards Business Ppt Powerpoint Presentation Infographic Template Deck
This is a financial management kpi dashboards business ppt powerpoint presentation infographic template deck. This is a four stage process. The stages in this process are finance, marketing, management, investment, analysis.
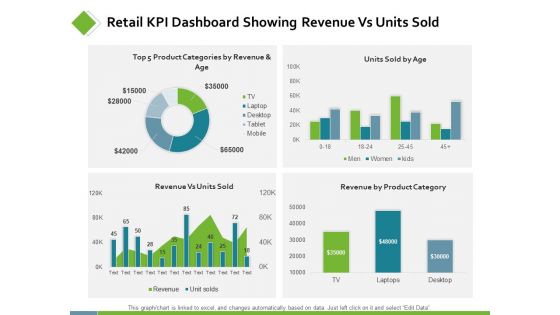
Retail KPI Dashboard Showing Revenue Vs Units Sold Ppt PowerPoint Presentation Professional Smartart
This is a retail kpi dashboard showing revenue vs units sold ppt powerpoint presentation professional smartart. This is a four stage process. The stages in this process are finance, analysis, business, investment, marketing.

Retail KPI Dashboard Showing Sales Revenue Customers Ppt PowerPoint Presentation Show Background Designs
This is a retail kpi dashboard showing sales revenue customers ppt powerpoint presentation show background designs. This is a six stage process. The stages in this process are finance, analysis, business, investment, marketing.
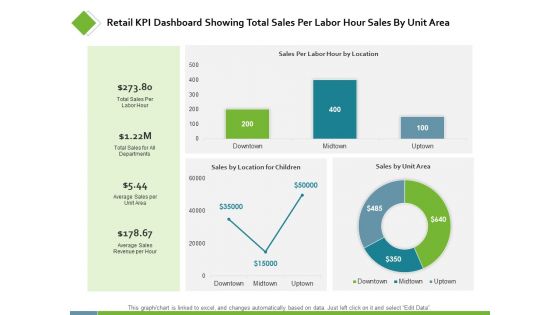
Retail KPI Dashboard Showing Total Sales Per Labor Ppt PowerPoint Presentation Styles Examples
This is a retail kpi dashboard showing total sales per labor ppt powerpoint presentation styles examples. This is a three stage process. The stages in this process are finance, analysis, business, investment, marketing.
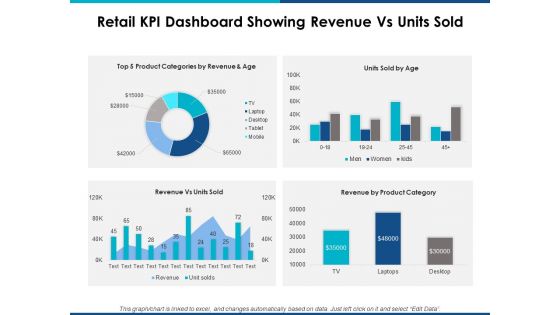
Retail Kpi Dashboard Showing Revenue Vs Units Sold Ppt Powerpoint Presentation Layouts Show
This is a retail kpi dashboard showing revenue vs units sold ppt powerpoint presentation layouts show. This is a four stage process. The stages in this process are finance, marketing, management, investment, analysis.

KPI Dashboard With Financial Analysis Of Company Ppt PowerPoint Presentation Backgrounds
This is a kpi dashboard with financial analysis of company ppt powerpoint presentation backgrounds. This is a four stage process. The stages in this process are business, strategy, marketing, line graph, finance.
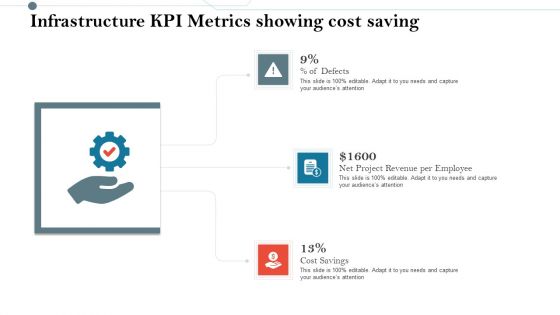
Construction Management Services And Action Plan Infrastructure KPI Metrics Showing Cost Saving Pictures PDF
Presenting construction management services and action plan infrastructure kpi metrics showing cost saving pictures pdf to provide visual cues and insights. Share and navigate important information on three stages that need your due attention. This template can be used to pitch topics like infrastructure kpi metrics showing cost saving. In addtion, this PPT design contains high resolution images, graphics, etc, that are easily editable and available for immediate download.
Talent Management Systems KPI Metrics And Dashboard Ppt File Vector PDF
This is a talent management systems kpi metrics and dashboard ppt file vector pdf template with various stages. Focus and dispense information on one stage using this creative set, that comes with editable features. It contains large content boxes to add your information on topics like kpi metrics and dashboard. You can also showcase facts, figures, and other relevant content using this PPT layout. Grab it now.
Service Level Agreement KPI Dashboard With Graph And Analytics Icon Inspiration PDF
Persuade your audience using this Service Level Agreement KPI Dashboard With Graph And Analytics Icon Inspiration PDF. This PPT design covers three stages, thus making it a great tool to use. It also caters to a variety of topics including Service Level, Agreement KPI Dashboard, Graph And Analytics, Icon. Download this PPT design now to present a convincing pitch that not only emphasizes the topic but also showcases your presentation skills.
Vendor Performance KPI Analytical Dashboard Icon For Data Management Background PDF
Persuade your audience using this Vendor Performance KPI Analytical Dashboard Icon For Data Management Background PDF. This PPT design covers three stages, thus making it a great tool to use. It also caters to a variety of topics including Vendor Performance, KPI Analytical Dashboard, Icon Data Management. Download this PPT design now to present a convincing pitch that not only emphasizes the topic but also showcases your presentation skills.

Healthcare Management KPI Metrics Showing Treatment Cost And Waiting Time Ppt PowerPoint Presentation Ideas Files
Presenting this set of slides with name healthcare management kpi metrics showing treatment cost and waiting time ppt powerpoint presentation ideas files. This is a three stage process. The stages in this process are business, management, planning, strategy, marketing. This is a completely editable PowerPoint presentation and is available for immediate download. Download now and impress your audience.

Construction Production Facilities Infrastructure KPI Metrics Showing Cost Saving Background PDF
Presenting this set of slides with name construction production facilities infrastructure kpi metrics showing cost saving background pdf. This is a three stage process. The stages in this process are net project revenue per employee, cost savings, defects. This is a completely editable PowerPoint presentation and is available for immediate download. Download now and impress your audience.

Firm Productivity Administration Business Intelligence KPI Metrics Average Ppt PowerPoint Presentation Infographics Guidelines PDF
Presenting this set of slides with name firm productivity administration business intelligence kpi metrics average ppt powerpoint presentation infographics guidelines pdf. This is a four stage process. The stages in this process are average purchase value, average lifetime value, average unit price, category id max. This is a completely editable PowerPoint presentation and is available for immediate download. Download now and impress your audience.
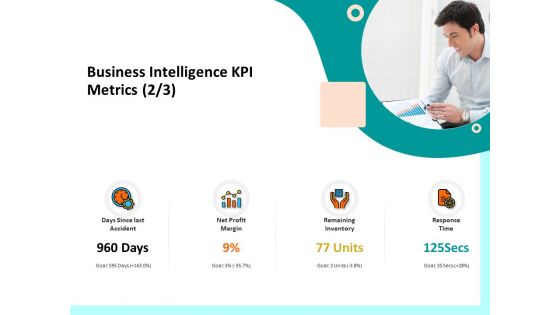
Firm Productivity Administration Business Intelligence KPI Metrics Inventory Ppt PowerPoint Presentation Inspiration Guide PDF
Presenting this set of slides with name firm productivity administration business intelligence kpi metrics inventory ppt powerpoint presentation inspiration guide pdf. This is a four stage process. The stages in this process are days since last accident, net profit margin, remaining inventory, response time. This is a completely editable PowerPoint presentation and is available for immediate download. Download now and impress your audience.

Firm Productivity Administration Business Intelligence KPI Metrics SEO Ppt PowerPoint Presentation File Visual Aids PDF
Presenting this set of slides with name firm productivity administration business intelligence kpi metrics seo ppt powerpoint presentation file visual aids pdf. This is a four stage process. The stages in this process are seo traffic weekly, trip distance, usa clients, ytd revenue millions. This is a completely editable PowerPoint presentation and is available for immediate download. Download now and impress your audience.
Healthcare Management KPI Metrics Showing Incidents Length Of Stay Ppt PowerPoint Presentation Icon Background
Presenting this set of slides with name healthcare management kpi metrics showing incidents length of stay ppt powerpoint presentation icon background. This is a four stage process. The stages in this process are incidents, average waiting time, overall patient satisfaction, management, marketing. This is a completely editable PowerPoint presentation and is available for immediate download. Download now and impress your audience.
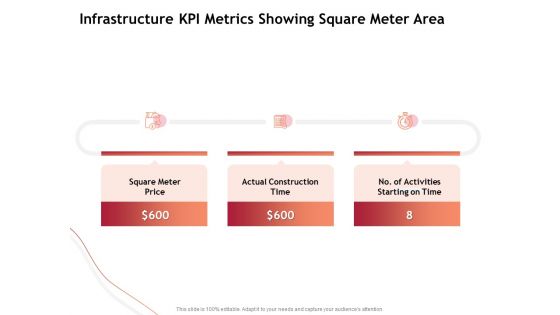
Performance Measuement Of Infrastructure Project Infrastructure KPI Metrics Showing Square Meter Area Download PDF
Presenting this set of slides with name performance measuement of infrastructure project infrastructure kpi metrics showing square meter area download pdf. This is a three stage process. The stages in this process are square meter price, actual construction time, number of activities starting on time. This is a completely editable PowerPoint presentation and is available for immediate download. Download now and impress your audience.

Introducing CRM Framework Within Organization Customer Relationship Management KPI Metrics Orders Background PDF
Presenting this set of slides with name introducing crm framework within organization customer relationship management kpi metrics orders background pdf. This is a four stage process. The stages in this process are customer, feedback form, total orders, mails 30 days. This is a completely editable PowerPoint presentation and is available for immediate download. Download now and impress your audience.

Facts Assessment Business Intelligence KPI Dashboard Processing Ppt PowerPoint Presentation Summary Graphics Template PDF
Presenting this set of slides with name facts assessment business intelligence kpi dashboard processing ppt powerpoint presentation summary graphics template pdf. This is a one stage process. The stages in this process are brand awareness, web traffic, social media, grp, mind, processing. This is a completely editable PowerPoint presentation and is available for immediate download. Download now and impress your audience.

Firm Productivity Administration Business Intelligence KPI Dashboard Mind Ppt PowerPoint Presentation Outline Graphics PDF
Presenting this set of slides with name firm productivity administration business intelligence kpi dashboard mind ppt powerpoint presentation outline graphics pdf. This is a four stage process. The stages in this process are social media, web traffic, grp, brand awareness, mind, processing. This is a completely editable PowerPoint presentation and is available for immediate download. Download now and impress your audience.

Business Activities Assessment Examples Infrastructure KPI Metrics Showing Cost Saving Infographics PDF
Presenting business activities assessment examples infrastructure kpi metrics showing cost saving infographics pdf to provide visual cues and insights. Share and navigate important information on three stages that need your due attention. This template can be used to pitch topics like net project revenue per employee, cost savings . In addtion, this PPT design contains high resolution images, graphics, etc, that are easily editable and available for immediate download.

IT And Cloud Facilities Management Infrastructure KPI Metrics Showing Cost Saving Information PDF
This is a it and cloud facilities management infrastructure kpi metrics showing cost saving information pdf template with various stages. Focus and dispense information on three stages using this creative set, that comes with editable features. It contains large content boxes to add your information on topics like defects, net project revenue per employee, cost savings. You can also showcase facts, figures, and other relevant content using this PPT layout. Grab it now.

IT Infrastructure Governance Infrastructure KPI Metrics Showing Cost Saving Ppt Infographic Template Graphic Images PDF
This is a it infrastructure governance infrastructure kpi metrics showing cost saving ppt infographic template graphic images pdf. template with various stages. Focus and dispense information on three stages using this creative set, that comes with editable features. It contains large content boxes to add your information on topics like defects, net project revenue per employee, cost savings. You can also showcase facts, figures, and other relevant content using this PPT layout. Grab it now
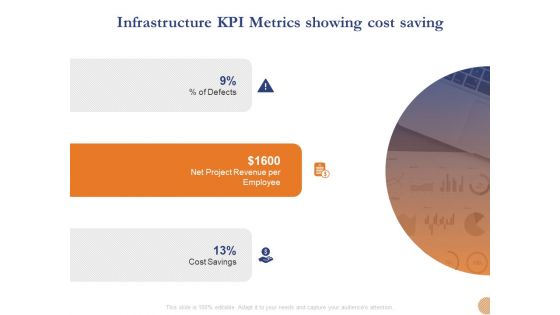
Substructure Segment Analysis Infrastructure KPI Metrics Showing Cost Saving Ppt Ideas Background Designs PDF
Presenting substructure segment analysis infrastructure kpi metrics showing cost saving ppt ideas background designs pdf to provide visual cues and insights. Share and navigate important information on three stages that need your due attention. This template can be used to pitch topics like cost savings, net project revenue per employee, defects. In addition, this PPT design contains high-resolution images, graphics, etc, that are easily editable and available for immediate download.
Facility Management Infrastructure KPI Metrics Showing Cost Saving Ppt Icon Skills PDF
This is a facility management infrastructure kpi metrics showing cost saving ppt icon skills pdf template with various stages. Focus and dispense information on three stages using this creative set, that comes with editable features. It contains large content boxes to add your information on topics like percent of defects, net project revenue per employee, cost savings. You can also showcase facts, figures, and other relevant content using this PPT layout. Grab it now.

Infrastructure Strategies Infrastructure KPI Metrics Showing Cost Saving Ppt Ideas Maker PDF
This is a infrastructure strategies infrastructure kpi metrics showing cost saving ppt ideas maker pdf template with various stages. Focus and dispense information on three stages using this creative set, that comes with editable features. It contains large content boxes to add your information on topics like percent of defects, net project revenue per employee, cost savings. You can also showcase facts, figures, and other relevant content using this PPT layout. Grab it now.

IT Infrastructure Administration Infrastructure KPI Metrics Showing Cost Saving Graphics PDF
This is a it infrastructure administration infrastructure kpi metrics showing cost saving graphics pdf template with various stages. Focus and dispense information on three stages using this creative set, that comes with editable features. It contains large content boxes to add your information on topics like percent of defects, net project revenue per employee, cost savings. You can also showcase facts, figures, and other relevant content using this PPT layout. Grab it now.
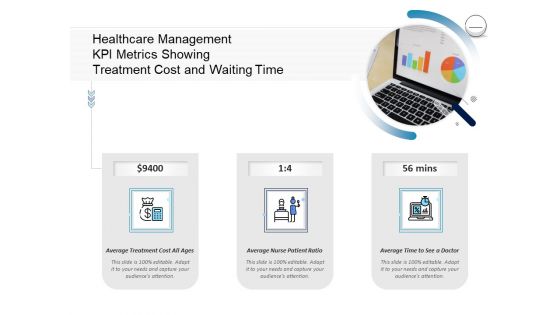
Pharmaceutical Management Healthcare Management KPI Metrics Showing Treatment Cost And Waiting Time Portrait PDF
This is a pharmaceutical management healthcare management kpi metrics showing treatment cost and waiting time portrait pdf template with various stages. Focus and dispense information on three stages using this creative set, that comes with editable features. It contains large content boxes to add your information on topics like average treatment cost ages, average nurse patient ratio, average time see doctor. You can also showcase facts, figures, and other relevant content using this PPT layout. Grab it now.

Information Technology Functions Management Infrastructure KPI Metrics Showing Cost Saving Ppt File Topics PDF
This is a information technology functions management infrastructure kpi metrics showing cost saving ppt file topics pdf template with various stages. Focus and dispense information on three stages using this creative set, that comes with editable features. It contains large content boxes to add your information on topics like percent defects, net project revenue per employee, cost savings. You can also showcase facts, figures, and other relevant content using this PPT layout. Grab it now.

Utilizing Infrastructure Management Using Latest Methods Infrastructure KPI Metrics Showing Cost Saving Background PDF
This is a utilizing infrastructure management using latest methods infrastructure kpi metrics showing cost saving background pdf template with various stages. Focus and dispense information on three stages using this creative set, that comes with editable features. It contains large content boxes to add your information on topics like percent defects, net project revenue per employee, cost savings. You can also showcase facts, figures, and other relevant content using this PPT layout. Grab it now.

Infrastructure Designing And Administration Infrastructure KPI Metrics Showing Cost Saving Download PDF
This is a infrastructure designing and administration infrastructure kpi metrics showing cost saving download pdf template with various stages. Focus and dispense information on three stages using this creative set, that comes with editable features. It contains large content boxes to add your information on topics like percent of defects, net project revenue per employee, cost savings. You can also showcase facts, figures, and other relevant content using this PPT layout. Grab it now.

Support Services Management Infrastructure KPI Metrics Showing Cost Saving Diagrams PDF
This is a support services management infrastructure kpi metrics showing cost saving diagrams pdf template with various stages. Focus and dispense information on three stages using this creative set, that comes with editable features. It contains large content boxes to add your information on topics like percent of defects, net project revenue per employee, cost savings. You can also showcase facts, figures, and other relevant content using this PPT layout. Grab it now.

B2B Trade Management Ecommerce Management KPI Metrics Average Order Value Summary PDF
This is a b2b trade management ecommerce management kpi metrics average order value summary pdf template with various stages. Focus and dispense information on four stages using this creative set, that comes with editable features. It contains large content boxes to add your information on topics like product views per session, coupon conversion, new customer first visit, on time delivery. You can also showcase facts, figures, and other relevant content using this PPT layout. Grab it now.

IT And Cloud Facilities Management Infrastructure KPI Metrics Showing Square Meter Area Designs PDF
Presenting it and cloud facilities management infrastructure kpi metrics showing square meter area designs pdf to provide visual cues and insights. Share and navigate important information on three stages that need your due attention. This template can be used to pitch topics like square meter, price actual, construction time, activities starting time. In addition, this PPT design contains high-resolution images, graphics, etc, that are easily editable and available for immediate download.
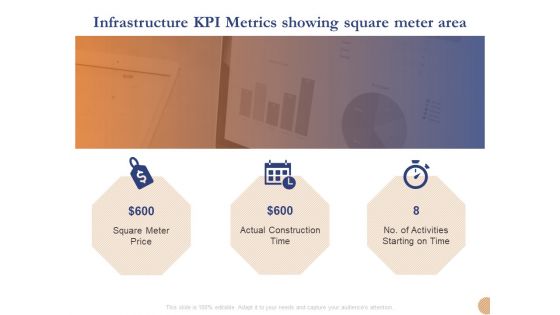
Substructure Segment Analysis Infrastructure KPI Metrics Showing Square Meter Area Diagrams PDF
This is a substructure segment analysis infrastructure kpi metrics showing square meter area diagrams pdf template with various stages. Focus and dispense information on three stages using this creative set, that comes with editable features. It contains large content boxes to add your information on topics like square meter price, actual construction time, activities starting on time. You can also showcase facts, figures, and other relevant content using this PPT layout. Grab it now.

Online Distribution Services Ecommerce Management KPI Metrics Delivery Ppt Visual Aids Inspiration PDF
This is a online distribution services ecommerce management kpi metrics delivery ppt visual aids inspiration pdf template with various stages. Focus and dispense information on four stages using this creative set, that comes with editable features. It contains large content boxes to add your information on topics like average order value, gross profit margin, cart abandonment, viral coefficient. You can also showcase facts, figures, and other relevant content using this PPT layout. Grab it now.
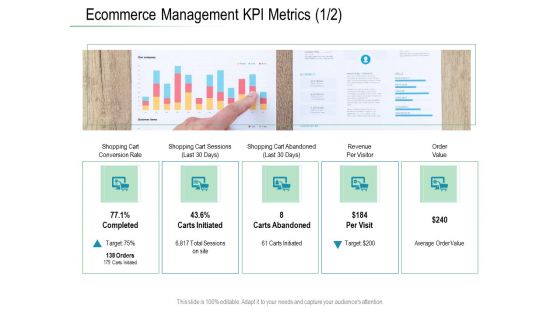
Online Distribution Services Ecommerce Management KPI Metrics Visitor Ppt Gallery Skills PDF
Presenting online distribution services ecommerce management kpi metrics visitor ppt gallery skills pdf to provide visual cues and insights. Share and navigate important information on five stages that need your due attention. This template can be used to pitch topics like conversion rate, revenue, value, target. In addtion, this PPT design contains high resolution images, graphics, etc, that are easily editable and available for immediate download.

Digital Products And Services Ecommerce Management KPI Metrics Delivery Ppt Summary Images PDF
This is a digital products and services ecommerce management kpi metrics delivery ppt summary images pdf template with various stages. Focus and dispense information on four stages using this creative set, that comes with editable features. It contains large content boxes to add your information on topics like average order value, gross profit margin, cart abandonment, viral coefficient. You can also showcase facts, figures, and other relevant content using this PPT layout. Grab it now.

 Home
Home