Executive Summary Metrics
Market Penetration Dashboard With Sales Metrics Ppt Icon Examples PDF
This slide shows market penetration dashboard for sales team. It provides information about regions, emerging markets, planned sales, actual sales, revenue, gender wise sales, etc. Pitch your topic with ease and precision using this Market Penetration Dashboard With Sales Metrics Ppt Icon Examples PDF. This layout presents information on Emerging Markets, Sales Gender, Actual Sales. It is also available for immediate download and adjustment. So, changes can be made in the color, design, graphics or any other component to create a unique layout.

Marketing Pipeline Analysis Framework And Metrics Brochure PDF
The mentioned slide showcases a five step framework through which businesses can set goals and understand customer journey. It includes acquisition, activation, retention, revenue and referral and KPIs. Presenting Marketing Pipeline Analysis Framework And Metrics Brochure PDF to dispense important information. This template comprises five stages. It also presents valuable insights into the topics including Acquisition, Retention, Referral. This is a completely customizable PowerPoint theme that can be put to use immediately. So, download it and address the topic impactfully.

Data Assimilation Business Intelligence KPI Metrics Miles Ppt Ideas PDF
Presenting data assimilation business intelligence kpi metrics miles ppt ideas pdf to provide visual cues and insights. Share and navigate important information on four stages that need your due attention. This template can be used to pitch topics like seo traffic weekly, trip distance, usa clients, ytd revenue . In addtion, this PPT design contains high resolution images, graphics, etc, that are easily editable and available for immediate download.
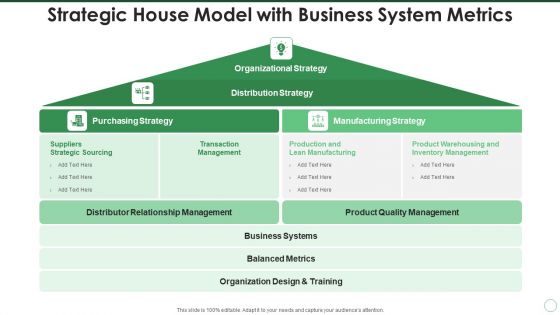
Strategic House Model With Business System Metrics Professional PDF
Persuade your audience using this strategic house model with business system metrics professional pdf. This PPT design covers four stages, thus making it a great tool to use. It also caters to a variety of topics including organizational strategy, distribution strategy, purchasing strategy, manufacturing strategy. Download this PPT design now to present a convincing pitch that not only emphasizes the topic but also showcases your presentation skills.

Fleet Management Operations Metrics For Logistics Organization Graphics PDF
This slide exhibits logistics operations KPIs dashboard for fleet management. It includes vehicle status, maintenance cost, fuel cost, cost breakdown, and insurance by vehicle type. Pitch your topic with ease and precision using this Fleet Management Operations Metrics For Logistics Organization Graphics PDF. This layout presents information on Cost Breakdown, Vehicle Status, Vehicle By Life Span. It is also available for immediate download and adjustment. So, changes can be made in the color, design, graphics or any other component to create a unique layout.

Yearly Project Engineering Performance Metrics Dashboard Information PDF
This slide covers project engineering KPI dashboard on yearly basis. It involves KPIs such as total revenue, support cost, research and development cost and units economics. Pitch your topic with ease and precision using this Yearly Project Engineering Performance Metrics Dashboard Information PDF. This layout presents information on Support Cost, Revenue, Measures. It is also available for immediate download and adjustment. So, changes can be made in the color, design, graphics or any other component to create a unique layout.

Human Capital Metrics For New Hire Ppt Pictures Brochure PDF
This graph or chart is linked to excel, and changes automatically based on data. Just left click on it and select Edit Data. Pitch your topic with ease and precision using this Human Capital Metrics For New Hire Ppt Pictures Brochure PDF. This layout presents information on Active Employee Count, New Hire Count, New Hire. It is also available for immediate download and adjustment. So, changes can be made in the color, design, graphics or any other component to create a unique layout.

Client Life Cycle Marketing Metrics Ppt Portfolio Graphic Tips PDF
This slide shows the key marketing KPIs such as conversion rate, impressions etc. in customer journey cycle. Persuade your audience using this client life cycle marketing metrics ppt portfolio graphic tips pdf. This PPT design covers five stages, thus making it a great tool to use. It also caters to a variety of topics including awareness, consideration, decision, retention, advocacy. Download this PPT design now to present a convincing pitch that not only emphasizes the topic but also showcases your presentation skills.

Finance Metrics Dashboard Indicating Portfolio Performance Microsoft PDF
This graph or chart is linked to excel, and changes automatically based on data. Just left click on it and select edit data. Pitch your topic with ease and precision using this Finance Metrics Dashboard Indicating Portfolio Performance Microsoft PDF. This layout presents information on Portfolio Performance Portfolio, Asset Management Manager, Top 10 Assets. It is also available for immediate download and adjustment. So, changes can be made in the color, design, graphics or any other component to create a unique layout.
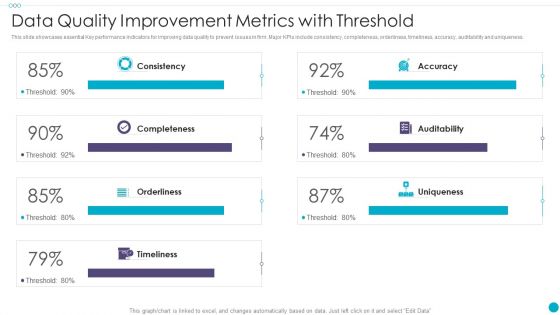
Data Quality Improvement Metrics With Threshold Formats PDF
This slide showcases essential Key performance indicators for improving data quality to prevent issues in firm. Major KPIs include consistency, completeness, orderliness, timeliness, accuracy, auditability and uniqueness. Pitch your topic with ease and precision using this Data Quality Improvement Metrics With Threshold Formats PDF This layout presents information on Auditability, Completeness, Consistency It is also available for immediate download and adjustment. So, changes can be made in the color, design, graphics or any other component to create a unique layout.

Education Dashboard With Student Attendance And Detention Metrics Inspiration PDF
This slide showcases the student enrollment and suspension KPI tracker. It includes KPIs such as enrollment status, attendance percentage, suspension rate, etc. Pitch your topic with ease and precision using this Education Dashboard With Student Attendance And Detention Metrics Inspiration PDF. This layout presents information on Student Attendance, Suspension Rate YTD, Current Enrollment. It is also available for immediate download and adjustment. So, changes can be made in the color, design, graphics or any other component to create a unique layout.

Customer Service Metrics Dashboard With Average Response Time Formats PDF
This slide showcases KPI dashboard for customer service that can help to evaluate the performance of call center agents and identify issues arising from different channels. Its key components are number of issues in last 1 day, average time to closes, first call resolution, daily average response time, average time to close by channel and top performing call agents. Pitch your topic with ease and precision using this Customer Service Metrics Dashboard With Average Response Time Formats PDF. This layout presents information on Customer Service, Metrics Dashboard, Average Response Time. It is also available for immediate download and adjustment. So, changes can be made in the color, design, graphics or any other component to create a unique layout.

Customer Service Kpis Metrics With Objectives Introduction PDF
The purpose of this slide is to showcase KPIs and objectives of customer service department. Customer satisfaction score, first response time, average handle time and cost per resolution are some of the key KPI mentioned in the slide. Persuade your audience using this Customer Service Kpis Metrics With Objectives Introduction PDF. This PPT design covers one stages, thus making it a great tool to use. It also caters to a variety of topics including Customer Satisfaction, Target, Average Handle. Download this PPT design now to present a convincing pitch that not only emphasizes the topic but also showcases your presentation skills.
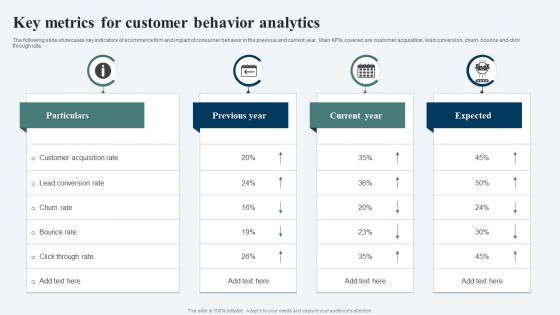
Key Metrics For Customer Behavior Analytics Ppt Model Introduction PDF
The following slide showcases key indicators of ecommerce firm and impact of consumer behavior in the previous and current year. Main KPIs covered are customer acquisition, lead conversion, churn, bounce and click through rate. Showcasing this set of slides titled Key Metrics For Customer Behavior Analytics Ppt Model Introduction PDF. The topics addressed in these templates are Particulars, Previous Year, Current Year. All the content presented in this PPT design is completely editable. Download it and make adjustments in color, background, font etc. as per your unique business setting.

Risk Metrics Dashboard And Mitigation Expenditure Dashboard Ideas PDF
This slide illustrates facts and figures of expenditure incurred on different risks. It includes financial risk, operational risks and competition risks. Pitch your topic with ease and precision using this Risk Metrics Dashboard And Mitigation Expenditure Dashboard Ideas PDF. This layout presents information on Management, Expenditure, Risk. It is also available for immediate download and adjustment. So, changes can be made in the color, design, graphics or any other component to create a unique layout.
Project Tracking Dashboard With Multiple Metrics Pictures PDF
The following slide highlights the KPI of project management to avoid deviations. It includes elements such as schedule, tasks, issue assessment, budget and risk analysis etc. Pitch your topic with ease and precision using this Project Tracking Dashboard With Multiple Metrics Pictures PDF. This layout presents information on Projected Budget Analysis, Risk Analysis, Quality Affirmation. It is also available for immediate download and adjustment. So, changes can be made in the color, design, graphics or any other component to create a unique layout.
Five Years Go Commodity Roadmap With Features And Metrics Icons
Introducing our five years go commodity roadmap with features and metrics icons. This PPT presentation is Google Slides compatible, therefore, you can share it easily with the collaborators for measuring the progress. Also, the presentation is available in both standard screen and widescreen aspect ratios. So edit the template design by modifying the font size, font type, color, and shapes as per your requirements. As this PPT design is fully editable it can be presented in PDF, JPG and PNG formats.
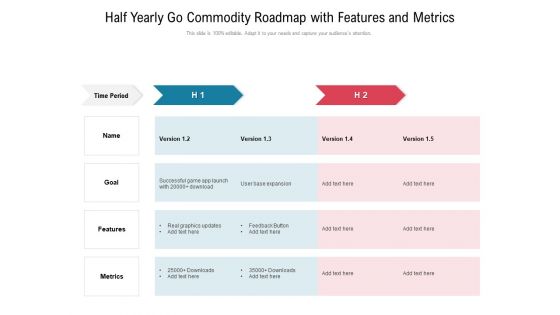
Half Yearly Go Commodity Roadmap With Features And Metrics Diagrams
Introducing our half yearly go commodity roadmap with features and metrics diagrams. This PPT presentation is Google Slides compatible, therefore, you can share it easily with the collaborators for measuring the progress. Also, the presentation is available in both standard screen and widescreen aspect ratios. So edit the template design by modifying the font size, font type, color, and shapes as per your requirements. As this PPT design is fully editable it can be presented in PDF, JPG and PNG formats.
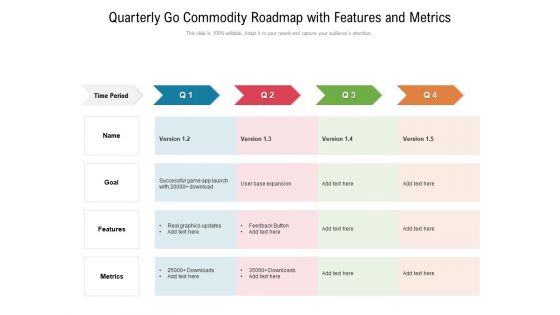
Quarterly Go Commodity Roadmap With Features And Metrics Ideas
Introducing our quarterly go commodity roadmap with features and metrics ideas. This PPT presentation is Google Slides compatible, therefore, you can share it easily with the collaborators for measuring the progress. Also, the presentation is available in both standard screen and widescreen aspect ratios. So edit the template design by modifying the font size, font type, color, and shapes as per your requirements. As this PPT design is fully editable it can be presented in PDF, JPG and PNG formats.

Six Months Go Commodity Roadmap With Features And Metrics Formats
Introducing our six months go commodity roadmap with features and metrics formats. This PPT presentation is Google Slides compatible, therefore, you can share it easily with the collaborators for measuring the progress. Also, the presentation is available in both standard screen and widescreen aspect ratios. So edit the template design by modifying the font size, font type, color, and shapes as per your requirements. As this PPT design is fully editable it can be presented in PDF, JPG and PNG formats.

Three Months Go Commodity Roadmap With Features And Metrics Sample
Introducing our three months go commodity roadmap with features and metrics sample. This PPT presentation is Google Slides compatible, therefore, you can share it easily with the collaborators for measuring the progress. Also, the presentation is available in both standard screen and widescreen aspect ratios. So edit the template design by modifying the font size, font type, color, and shapes as per your requirements. As this PPT design is fully editable it can be presented in PDF, JPG and PNG formats.
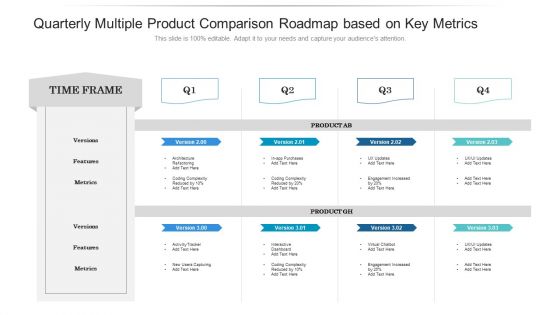
Quarterly Multiple Product Comparison Roadmap Based On Key Metrics Structure
Introducing our quarterly multiple product comparison roadmap based on key metrics structure. This PPT presentation is Google Slides compatible, therefore, you can share it easily with the collaborators for measuring the progress. Also, the presentation is available in both standard screen and widescreen aspect ratios. So edit the template design by modifying the font size, font type, color, and shapes as per your requirements. As this PPT design is fully editable it can be presented in PDF, JPG and PNG formats.
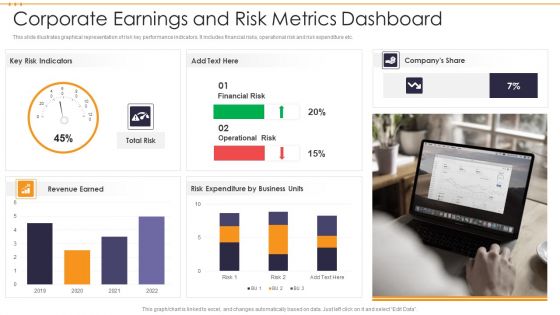
Corporate Earnings And Risk Metrics Dashboard Guidelines PDF
This slide illustrates graphical representation of risk key performance indicators. It includes financial risks, operational risk and risk expenditure etc. Pitch your topic with ease and precision using this Corporate Earnings And Risk Metrics Dashboard Guidelines PDF. This layout presents information on Financial Risk, Operational Risk Expenditure. It is also available for immediate download and adjustment. So, changes can be made in the color, design, graphics or any other component to create a unique layout.
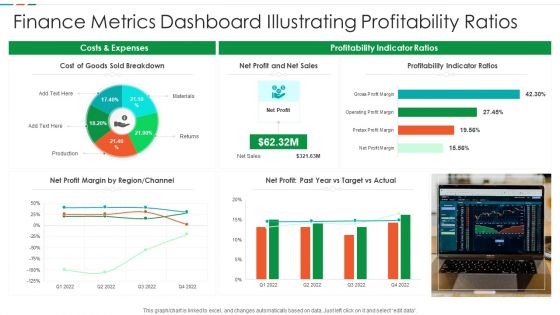
Finance Metrics Dashboard Illustrating Profitability Ratios Diagrams PDF
This graph or chart is linked to excel, and changes automatically based on data. Just left click on it and select edit data. Pitch your topic with ease and precision using this Finance Metrics Dashboard Illustrating Profitability Ratios Diagrams PDF. This layout presents information on Cost Goods Sold, Net Profit Net, Sales Profitability Indicator. It is also available for immediate download and adjustment. So, changes can be made in the color, design, graphics or any other component to create a unique layout.
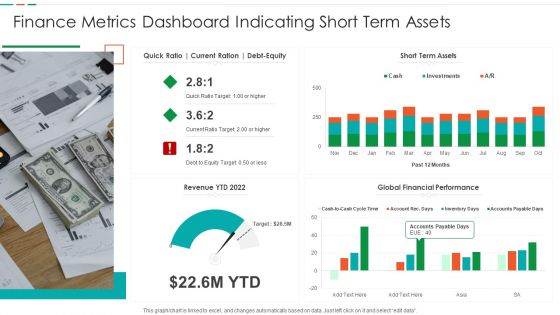
Finance Metrics Dashboard Indicating Short Term Assets Download PDF
This graph or chart is linked to excel, and changes automatically based on data. Just left click on it and select edit data. Pitch your topic with ease and precision using this Finance Metrics Dashboard Indicating Short Term Assets Download PDF. This layout presents information on Short Term Assets, Global Financial Performance, Revenue YTD 2022. It is also available for immediate download and adjustment. So, changes can be made in the color, design, graphics or any other component to create a unique layout.

Logistics Operations Metrics With Fleet And Delivery Status Slides PDF
This slide illustrates logistics operations dashboard. It includes total revenue, cost, profit, fleet status, delivery status, deliveries by countries, profit by countries etc. Pitch your topic with ease and precision using this Logistics Operations Metrics With Fleet And Delivery Status Slides PDF. This layout presents information on Fleet Status, Delivery Status, Deliveries By Country. It is also available for immediate download and adjustment. So, changes can be made in the color, design, graphics or any other component to create a unique layout.
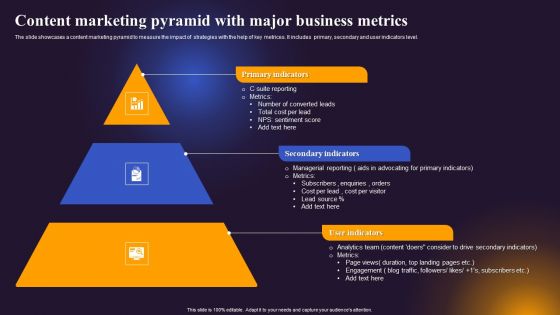
Content Marketing Pyramid With Major Business Metrics Formats PDF
The slide showcases a content marketing pyramid to measure the impact of strategies with the help of key metrices. It includes primary, secondary and user indicators level. Persuade your audience using this Content Marketing Pyramid With Major Business Metrics Formats PDF. This PPT design covers three stages, thus making it a great tool to use. It also caters to a variety of topics including Primary Indicators, Secondary Indicators, User Indicators. Download this PPT design now to present a convincing pitch that not only emphasizes the topic but also showcases your presentation skills.
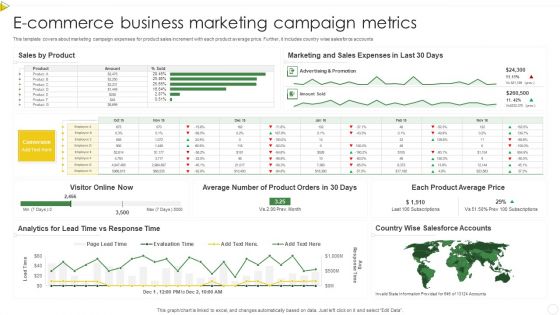
E Commerce Business Marketing Campaign Metrics Structure PDF
This template covers about marketing campaign expenses for product sales increment with each product average price. Further, it includes country wise salesforce accounts. Showcasing this set of slides titled E Commerce Business Marketing Campaign Metrics Structure PDF. The topics addressed in these templates are Sales By Product, Sales Expenses, Marketing. All the content presented in this PPT design is completely editable. Download it and make adjustments in color, background, font etc. as per your unique business setting.
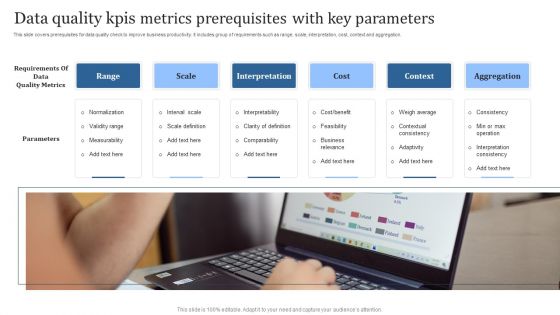
Data Quality Kpis Metrics Prerequisites With Key Parameters Introduction PDF
This slide covers prerequisites for data quality check to improve business productivity. It includes group of requirements such as range, scale, interpretation, cost, context and aggregation. Persuade your audience using this Data Quality Kpis Metrics Prerequisites With Key Parameters Introduction PDF. This PPT design covers Six stages, thus making it a great tool to use. It also caters to a variety of topics including Range, Scale, Interpretation. Download this PPT design now to present a convincing pitch that not only emphasizes the topic but also showcases your presentation skills.
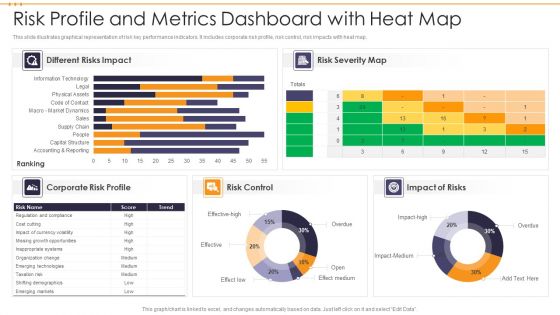
Risk Profile And Metrics Dashboard With Heat Map Brochure PDF
This slide illustrates graphical representation of risk key performance indicators. It includes corporate risk profile, risk control, risk impacts with heat map. Showcasing this set of slides titled Risk Profile And Metrics Dashboard With Heat Map Brochure PDF. The topics addressed in these templates are Risk Control, Impact Of Risks, Risk Severity Map. All the content presented in this PPT design is completely editable. Download it and make adjustments in color, background, font etc. as per your unique business setting.
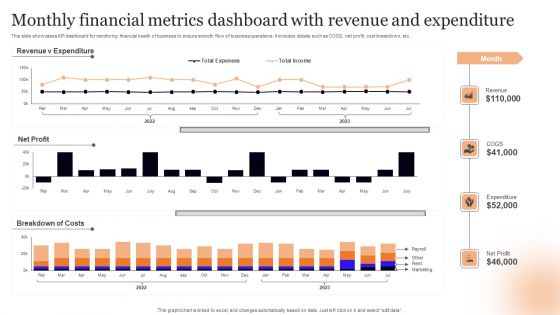
Monthly Financial Metrics Dashboard With Revenue And Expenditure Rules PDF
This slide showcases KPI dashboard for monitoring financial health of business to ensure smooth flow of business operations. It includes details such as COGS, net profit, cost breakdown, etc. Showcasing this set of slides titled Monthly Financial Metrics Dashboard With Revenue And Expenditure Rules PDF. The topics addressed in these templates are Net Profit, Costs, Expenditure. All the content presented in this PPT design is completely editable. Download it and make adjustments in color, background, font etc. as per your unique business setting.
Booting Brand Image By Tracking KPI Metrics Diagrams PDF
This slide consists of key performance indicators to be used by mangers to track the brand awareness . Key metrices covered are content reach, brand mention, blog shares, search volume data, repeat purchase and organic traffic. Showcasing this set of slides titled Booting Brand Image By Tracking KPI Metrics Diagrams PDF. The topics addressed in these templates are Content Reach, Brand Mentions, Blog Shares. All the content presented in this PPT design is completely editable. Download it and make adjustments in color, background, font etc. as per your unique business setting.

Project Metrics Dashboard With Monthly Timeline Pictures PDF
This slide covers the project management dashboard which focuses on project objective, main focus,, issues and risks, key discussion points, project status, primary resources with roles, monthly timeline depicting milestones sch as charter, coding, designing, etc. Showcasing this set of slides titled Project Metrics Dashboard With Monthly Timeline Pictures PDF. The topics addressed in these templates are Primary Resources, Risk, Requirements. All the content presented in this PPT design is completely editable. Download it and make adjustments in color, background, font etc. as per your unique business setting.

Three Year Marketing Business Plan With Key Metrics Diagrams PDF
The slide showcases a marketing plan to optimize performance and improve profitability. It covers setting annual target, budget allocation, feedbacks, strategies and key metrices to focus on. Presenting Three Year Marketing Business Plan With Key Metrics Diagrams PDF to dispense important information. This template comprises three stages. It also presents valuable insights into the topics including Attract Target Segment, Analyses, Product Or Service. This is a completely customizable PowerPoint theme that can be put to use immediately. So, download it and address the topic impactfully.

Essential Metrics For Effective Instagram Promotion Strategy Portrait PDF
The slide highlights various Instagram metrices that enable you to devise a smarter plan for optimizing Instagram marketing strategies. It includes impression, engagement rate, trending or branding hashtags and click-through bio.Presenting Essential Metrics For Effective Instagram Promotion Strategy Portrait PDF to dispense important information. This template comprises five stages. It also presents valuable insights into the topics including Engagement Rate, Branding Hashtags, According Connect. This is a completely customizable PowerPoint theme that can be put to use immediately. So, download it and address the topic impactfully.
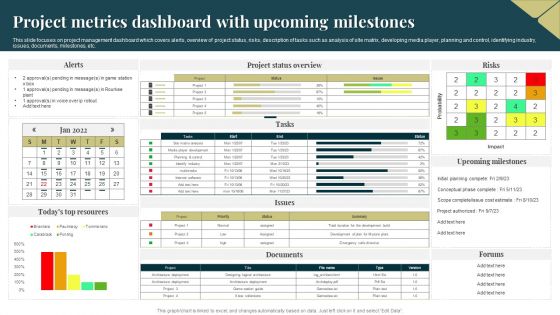
Project Metrics Dashboard With Upcoming Milestones Demonstration PDF
This slide focuses on project management dashboard which covers alerts, overview of project status, risks, description of tasks such as analysis of site matrix, developing media player, planning and control, identifying industry, issues, documents, milestones, etc. Pitch your topic with ease and precision using this Project Metrics Dashboard With Upcoming Milestones Demonstration PDF. This layout presents information on Probability, Project, Risks. It is also available for immediate download and adjustment. So, changes can be made in the color, design, graphics or any other component to create a unique layout.
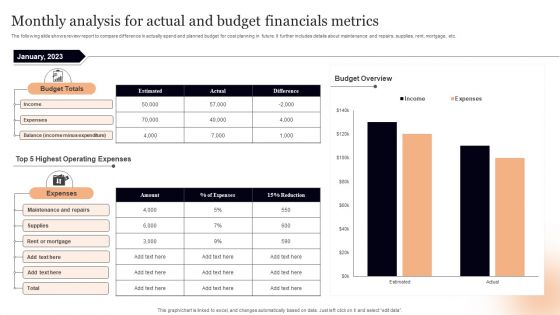
Monthly Analysis For Actual And Budget Financials Metrics Professional PDF
The following slide shows review report to compare difference in actually spend and planned budget for cost planning in future. It further includes details about maintenance and repairs, supplies, rent, mortgage, etc. Pitch your topic with ease and precision using this Monthly Analysis For Actual And Budget Financials Metrics Professional PDF. This layout presents information on Budget Totals, Expenses, Budget Overview. It is also available for immediate download and adjustment. So, changes can be made in the color, design, graphics or any other component to create a unique layout.

Critical Violations Security Dashboard With KPI Metrics Graphics PDF
This slide shows dashboard of security to mitigate violation by prioritizing KPIs. It includes application control, operating systems, restrict admin privileges, multi factor authentication and backup of important data. Showcasing this set of slides titled Critical Violations Security Dashboard With KPI Metrics Graphics PDF. The topics addressed in these templates are Risk Model, Application Components, Technologies Overview. All the content presented in this PPT design is completely editable. Download it and make adjustments in color, background, font etc. as per your unique business setting.

Cost Management Metrics For Software Development And Management Formats PDF
This slide displays post application lunch analytical report for organization to track total maintenance expenditure and revenues earned from project. It further includes detail about return on investment and breakdown percentage for planning design, testing and development.Showcasing this set of slides titled Cost Management Metrics For Software Development And Management Formats PDF. The topics addressed in these templates are Revenue, Department, Budget. All the content presented in this PPT design is completely editable. Download it and make adjustments in color, background, font etc. as per your unique business setting.
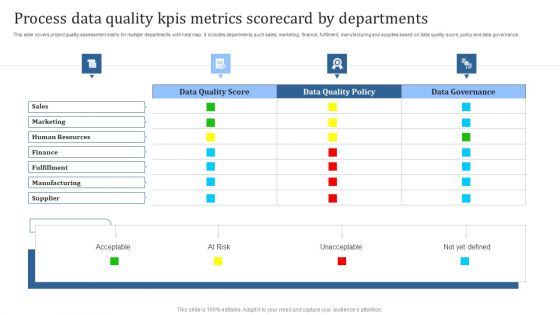
Process Data Quality Kpis Metrics Scorecard By Departments Template PDF
This slide covers project quality assessment matrix for multiple departments with heat map. It includes departments such sales, marketing, finance, fulfilment, manufacturing and supplies based on data quality score, policy and data governance. Showcasing this set of slides titled Process Data Quality Kpis Metrics Scorecard By Departments Template PDF. The topics addressed in these templates are Acceptable, At Risk, Unacceptable. All the content presented in this PPT design is completely editable. Download it and make adjustments in color, background, font etc. as per your unique business setting.
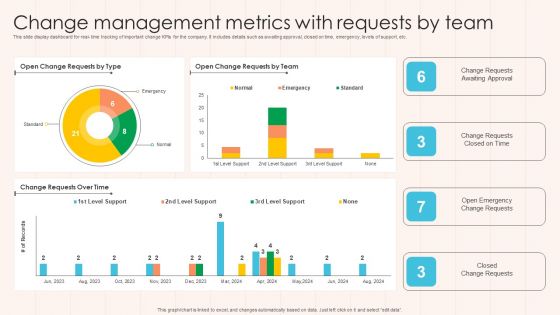
Change Management Metrics With Requests By Team Designs PDF
This slide display dashboard for real- time tracking of important change KPIs for the company. It includes details such as awaiting approval, closed on time, emergency, levels of support, etc. Pitch your topic with ease and precision using this Change Management Metrics With Requests By Team Designs PDF This layout presents information on Change Requests, Approval, Team. It is also available for immediate download and adjustment. So, changes can be made in the color, design, graphics or any other component to create a unique layout.
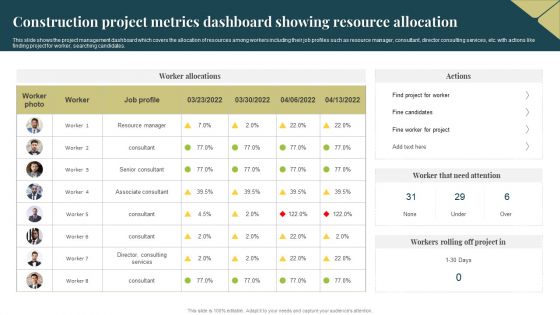
Construction Project Metrics Dashboard Showing Resource Allocation Professional PDF
This slide shows the project management dashboard which covers the allocation of resources among workers including their job profiles such as resource manager, consultant, director consulting services, etc. with actions like finding project for worker, searching candidates. Showcasing this set of slides titled Construction Project Metrics Dashboard Showing Resource Allocation Professional PDF. The topics addressed in these templates are Resource Manager, Services, Project. All the content presented in this PPT design is completely editable. Download it and make adjustments in color, background, font etc. as per your unique business setting.
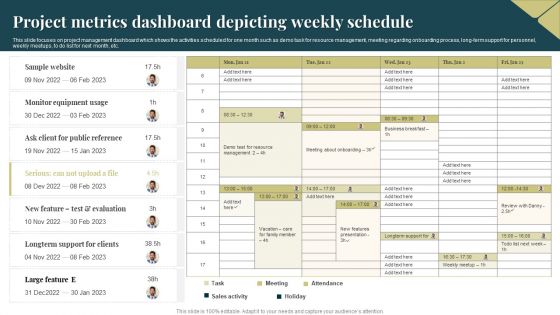
Project Metrics Dashboard Depicting Weekly Schedule Graphics PDF
This slide focuses on project management dashboard which shows the activities scheduled for one month such as demo task for resource management, meeting regarding onboarding process, long term support for personnel, weekly meetups, to do list for next month, etc. Showcasing this set of slides titled Project Metrics Dashboard Depicting Weekly Schedule Graphics PDF. The topics addressed in these templates are Equipment, Sales Activity, Resource. All the content presented in this PPT design is completely editable. Download it and make adjustments in color, background, font etc. as per your unique business setting.
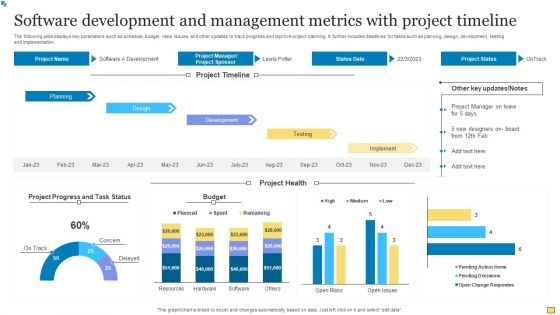
Software Development And Management Metrics With Project Timeline Slides PDF
The following slide displays key parameters such as schedule, budget, risks, issues, and other updates to track progress and improve project planning. It further includes deadlines for tasks such as planning, design, development, testing and implementation. Showcasing this set of slides titled Software Development And Management Metrics With Project Timeline Slides PDF. The topics addressed in these templates are Planning, Development, Design. All the content presented in this PPT design is completely editable. Download it and make adjustments in color, background, font etc. as per your unique business setting.
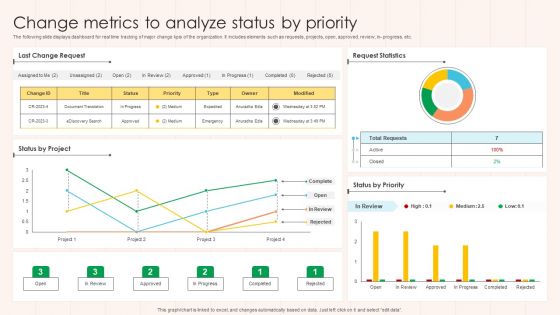
Change Metrics To Analyze Status By Priority Formats PDF
The following slide displays dashboard for real time tracking of major change kpis of the organization. It includes elements such as requests, projects, open, approved, review, in- progress, etc. Pitch your topic with ease and precision using this Change Metrics To Analyze Status By Priority Formats PDF This layout presents information on Project, Request Statistics, Priority. It is also available for immediate download and adjustment. So, changes can be made in the color, design, graphics or any other component to create a unique layout.
Customer Service Metrics Dashboard With Customer Retention Rate Icons PDF
This slide showcases KPIs dashboard for customer service that can help organization to track the consumer satisfaction score and improve product or service by improving customer loyalty. Its key components are net promoter score, customer retention and support costs. Showcasing this set of slides titled Customer Service Metrics Dashboard With Customer Retention Rate Icons PDF. The topics addressed in these templates are Customer Retention, Net Promoter Score, Service Level. All the content presented in this PPT design is completely editable. Download it and make adjustments in color, background, font etc. as per your unique business setting.

Project Metrics Dashboard For Software Development Designs PDF
This slide shows the project management dashboard for developing software which focuses on health status such as time, cost, workload, risks, issues and changes with comparison of actual and planned expenses with budget. It also shows the risks, issues ad changes. Pitch your topic with ease and precision using this Project Metrics Dashboard For Software Development Designs PDF. This layout presents information on Risks, Budget, Cost. It is also available for immediate download and adjustment. So, changes can be made in the color, design, graphics or any other component to create a unique layout.
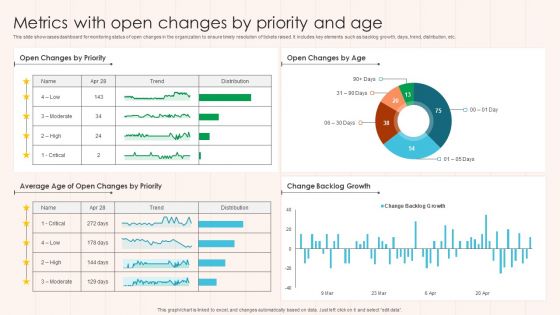
Metrics With Open Changes By Priority And Age Guidelines PDF
This slide showcases dashboard for monitoring status of open changes in the organization to ensure timely resolution of tickets raised. It includes key elements such as backlog growth, days, trend, distribution, etc. Pitch your topic with ease and precision using this Metrics With Open Changes By Priority And Age Guidelines PDF This layout presents information on Change Backlog Growth, Priority, Age. It is also available for immediate download and adjustment. So, changes can be made in the color, design, graphics or any other component to create a unique layout.
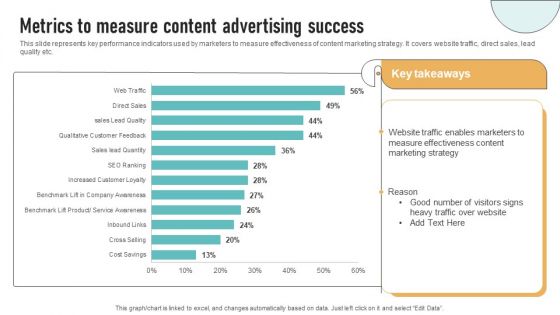
Metrics To Measure Content Advertising Success Demonstration PDF
This slide represents key performance indicators used by marketers to measure effectiveness of content marketing strategy. It covers website traffic, direct sales, lead quality etc. The Metrics To Measure Content Advertising Success Demonstration PDF is a compilation of the most recent design trends as a series of slides. It is suitable for any subject or industry presentation, containing attractive visuals and photo spots for businesses to clearly express their messages. This template contains a variety of slides for the user to input data, such as structures to contrast two elements, bullet points, and slides for written information. Slidegeeks is prepared to create an impression.

Project Metrics Dashboard Showing Organizational Progress Demonstration PDF
This slide covers the project management dashboard that shows the two year timeline of project tasks and activities such as hiring survey consultants, writing curriculum, creating employees training programs with initiative, its description, budget, end date, milestones, etc. Pitch your topic with ease and precision using this Project Metrics Dashboard Showing Organizational Progress Demonstration PDF. This layout presents information on Budget, Survey, Employees. It is also available for immediate download and adjustment. So, changes can be made in the color, design, graphics or any other component to create a unique layout.

Change Metrics Showcasing Time Consumption Analysis By Status Clipart PDF
This slide showcases dashboard to analyze and monitor overall time consumption by various change cases in the organization. It includes elements such as escalated, solution proposed, waiting for customer approval, etc. Showcasing this set of slides titled Change Metrics Showcasing Time Consumption Analysis By Status Clipart PDF The topics addressed in these templates are Consuming, Status Analysis, Record Count. All the content presented in this PPT design is completely editable. Download it and make adjustments in color, background, font etc. as per your unique business setting.
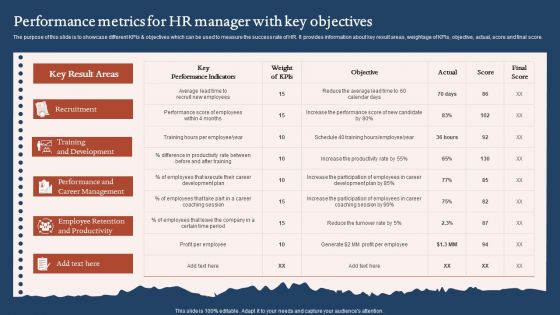
Performance Metrics For HR Manager With Key Objectives Demonstration PDF
The purpose of this slide is to showcase different KPIs and objectives which can be used to measure the success rate of HR. It provides information about key result areas, weightage of KPIs, objective, actual, score and final score. Showcasing this set of slides titled Performance Metrics For HR Manager With Key Objectives Demonstration PDF. The topics addressed in these templates are Training And Development, Recruitment, Performance Career Management. All the content presented in this PPT design is completely editable. Download it and make adjustments in color, background, font etc. as per your unique business setting.
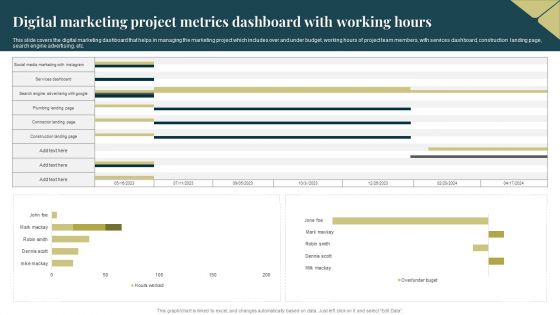
Digital Marketing Project Metrics Dashboard With Working Hours Download PDF
This slide covers the digital marketing dashboard that helps in managing the marketing project which includes over and under budget, working hours of project team members, with services dashboard, construction landing page, search engine advertising, etc. Showcasing this set of slides titled Digital Marketing Project Metrics Dashboard With Working Hours Download PDF. The topics addressed in these templates are Advertising, Social Media Marketing. All the content presented in this PPT design is completely editable. Download it and make adjustments in color, background, font etc. as per your unique business setting.
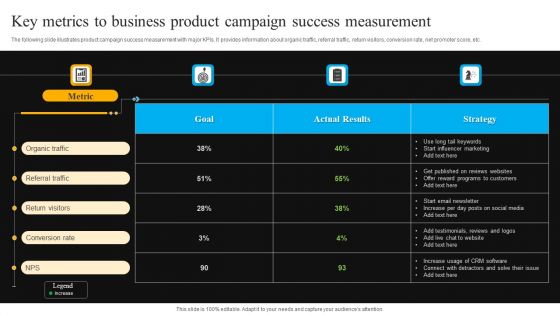
Key Metrics To Business Product Campaign Success Measurement Clipart PDF
The following slide illustrates product campaign success measurement with major KPIs. It provides information about organic traffic, referral traffic, return visitors, conversion rate, net promoter score, etc. Pitch your topic with ease and precision using this Key Metrics To Business Product Campaign Success Measurement Clipart PDF. This layout presents information on Organic Traffic, Referral Traffic, Return Visitors. It is also available for immediate download and adjustment. So, changes can be made in the color, design, graphics or any other component to create a unique layout.
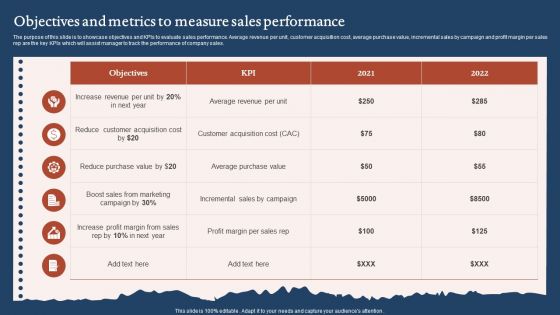
Objectives And Metrics To Measure Sales Performance Sample PDF
The purpose of this slide is to showcase objectives and KPIs to evaluate sales performance. Average revenue per unit, customer acquisition cost, average purchase value, incremental sales by campaign and profit margin per sales rep are the key KPIs which will assist manager to track the performance of company sales. Showcasing this set of slides titled Objectives And Metrics To Measure Sales Performance Sample PDF. The topics addressed in these templates are Reduce Purchase Value, Increase Profit Margin, Customer Acquisition Cost. All the content presented in this PPT design is completely editable. Download it and make adjustments in color, background, font etc. as per your unique business setting.

Organizations Performance Management Pyramid With Key Metrics Professional PDF
This slide represents the pyramid showcasing the overall performance of the organization. It includes details related to the vision, strategy, objectives, csfs, kpis and actions taken by the organization to increase its performance. Presenting Organizations Performance Management Pyramid With Key Metrics Professional PDF to dispense important information. This template comprises six stages. It also presents valuable insights into the topics including Strategy, Vision, Objectives. This is a completely customizable PowerPoint theme that can be put to use immediately. So, download it and address the topic impactfully.
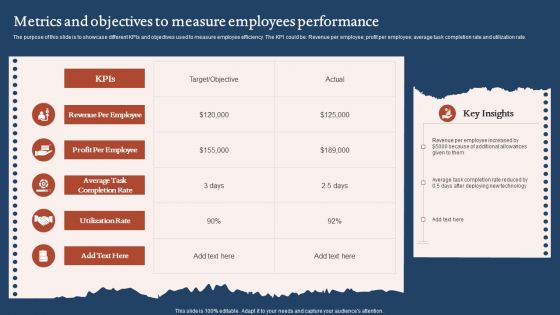
Metrics And Objectives To Measure Employees Performance Clipart PDF
The purpose of this slide is to showcase different KPIs and objectives used to measure employee efficiency. The KPI could be Revenue per employee profit per employee average task completion rate and utilization rate. Showcasing this set of slides titled Metrics And Objectives To Measure Employees Performance Clipart PDF. The topics addressed in these templates are Utilization Rate, Profit Per Employee, Revenue Per Employee. All the content presented in this PPT design is completely editable. Download it and make adjustments in color, background, font etc. as per your unique business setting.

Project Metrics Dashboard With Workload Percentage Ideas PDF
This slide shows the project management dashboard which focuses on overall progress, projected launch date, name of tasks assigned to the employees responsible for managing project such as interactive dashboard features, setup test environment, finalize the testing plan. Showcasing this set of slides titled Project Metrics Dashboard With Workload Percentage Ideas PDF. The topics addressed in these templates are Environment, Plan, Dashboard. All the content presented in this PPT design is completely editable. Download it and make adjustments in color, background, font etc. as per your unique business setting.
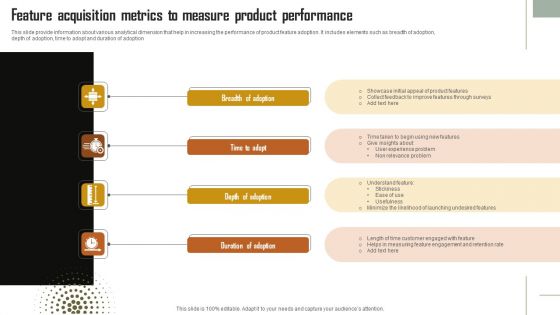
Feature Acquisition Metrics To Measure Product Performance Sample PDF
This slide provide information about various analytical dimension that help in increasing the performance of product feature adoption. It includes elements such as breadth of adoption,depth of adoption, time to adopt and duration of adoption. Presenting Feature Acquisition Metrics To Measure Product Performance Sample PDF to dispense important information. This template comprises four stages. It also presents valuable insights into the topics including Relevance Problem, Product Features, Retention Rate. This is a completely customizable PowerPoint theme that can be put to use immediately. So, download it and address the topic impactfully.

Project Metrics Dashboard With Launch Date Formats PDF
This slide covers the project management dashboard which includes status of project phases such as planning, designing, development and testing that also focuses on launch date of project, overdue tasks with date, deadline, etc. and workload on employees. Showcasing this set of slides titled Project Metrics Dashboard With Launch Date Formats PDF. The topics addressed in these templates are Budget, Project Launch Data, Development. All the content presented in this PPT design is completely editable. Download it and make adjustments in color, background, font etc. as per your unique business setting.

 Home
Home