Executive Summary Dashboard
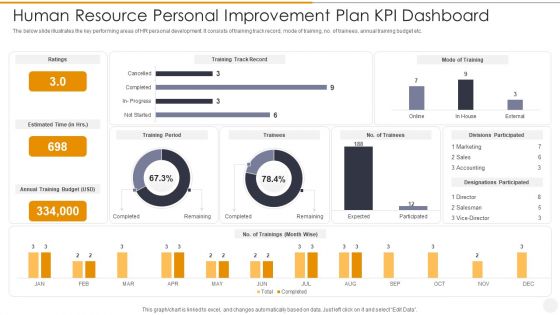
Human Resource Personal Improvement Plan Kpi Dashboard Topics PDF
The below slide illustrates the key performing areas of HR personal development. It consists of training track record, mode of training, no. of trainees, annual training budget etc. Showcasing this set of slides titled Human Resource Personal Improvement Plan Kpi Dashboard Topics PDF. The topics addressed in these templates are Sales, Marketing, Accounting. All the content presented in this PPT design is completely editable. Download it and make adjustments in color, background, font etc. as per your unique business setting.
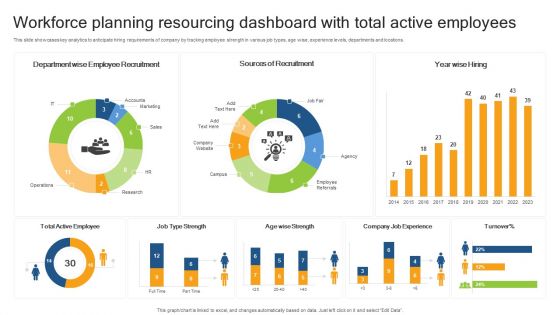
Workforce Planning Resourcing Dashboard With Total Active Employees Rules PDF
This slide showcases key analytics to anticipate hiring requirements of company by tracking employee strength in various job types, age wise, experience levels, departments and locations. Showcasing this set of slides titled Workforce Planning Resourcing Dashboard With Total Active Employees Rules PDF. The topics addressed in these templates are Employee Recruitment, Sources Recruitment, Active Employee . All the content presented in this PPT design is completely editable. Download it and make adjustments in color, background, font etc. as per your unique business setting.
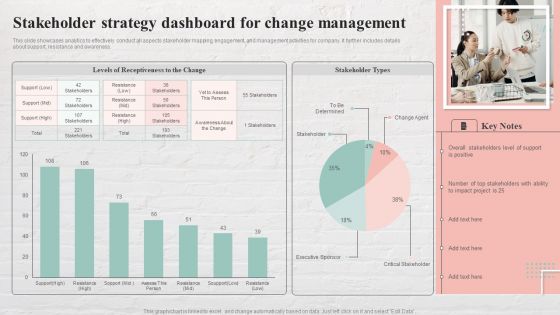
Stakeholder Strategy Dashboard For Change Management Brochure PDF
This slide showcases analytics to effectively conduct all aspects stakeholder mapping, engagement, and management activities for company. It further includes details about support, resistance and awareness. Showcasing this set of slides titled Stakeholder Strategy Dashboard For Change Management Brochure PDF. The topics addressed in these templates are Level Of Support, Stakeholders With Ability. All the content presented in this PPT design is completely editable. Download it and make adjustments in color, background, font etc. as per your unique business setting.
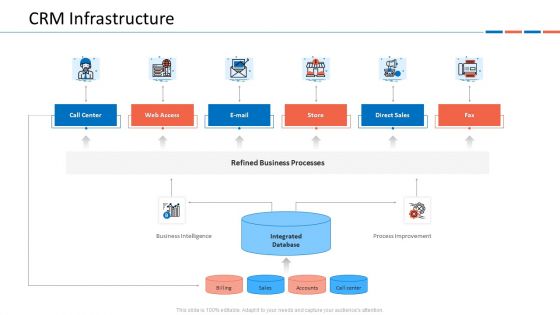
Customer Relationship Management Dashboard CRM Infrastructure Demonstration PDF
Presenting customer relationship management dashboard crm infrastructure demonstration pdf to provide visual cues and insights. Share and navigate important information on six stages that need your due attention. This template can be used to pitch topics like refined business processes, integrated database, business intelligence, process improvement. In addtion, this PPT design contains high resolution images, graphics, etc, that are easily editable and available for immediate download.

Customer Relationship Management Dashboard CRM Process Goals Professional PDF
Presenting customer relationship management dashboard crm process goals professional pdf to provide visual cues and insights. Share and navigate important information on six stages that need your due attention. This template can be used to pitch topics like set customer objectives, align organization, behind goals, measure programme effectiveness. In addtion, this PPT design contains high resolution images, graphics, etc, that are easily editable and available for immediate download.
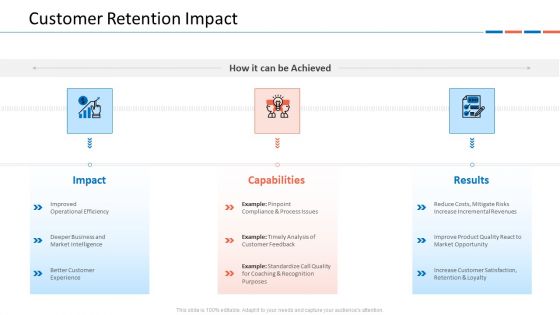
Customer Relationship Management Dashboard Customer Retention Impact Themes PDF
Presenting customer relationship management dashboard customer retention impact themes pdf to provide visual cues and insights. Share and navigate important information on three stages that need your due attention. This template can be used to pitch topics like improved operational efficiency, deeper business and market intelligence, better customer experience. In addtion, this PPT design contains high resolution images, graphics, etc, that are easily editable and available for immediate download.
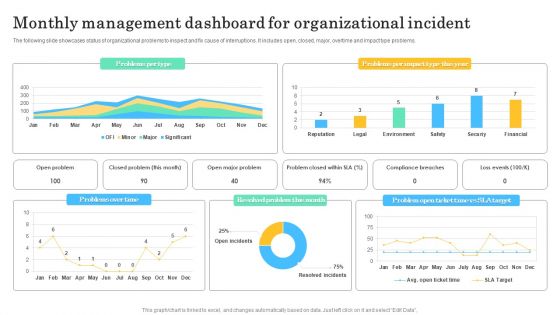
Monthly Management Dashboard For Organizational Incident Professional PDF
The following slide showcases status of organizational problems to inspect and fix cause of interruptions. It includes open, closed, major, overtime and impact type problems. Showcasing this set of slides titled Monthly Management Dashboard For Organizational Incident Professional PDF. The topics addressed in these templates are Problems Over Time, Resolved Problem Month. All the content presented in this PPT design is completely editable. Download it and make adjustments in color, background, font etc. as per your unique business setting.
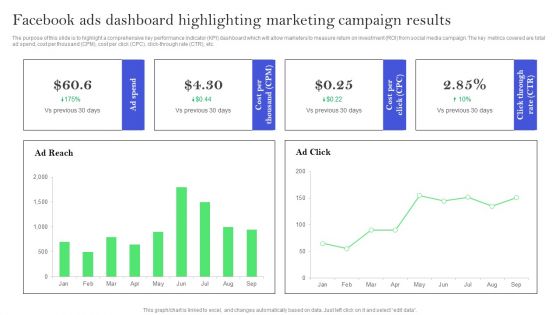
Facebook Ads Dashboard Highlighting Marketing Campaign Results Slides PDF
The purpose of this slide is to highlight a comprehensive key performance indicator KPI dashboard which will allow marketers to measure return on investment ROI from social media campaign. The key metrics covered are total ad spend, cost per thousand CPM, cost per click CPC, click through rate CTR, etc. From laying roadmaps to briefing everything in detail, our templates are perfect for you. You can set the stage with your presentation slides. All you have to do is download these easy to edit and customizable templates. Facebook Ads Dashboard Highlighting Marketing Campaign Results Slides PDF will help you deliver an outstanding performance that everyone would remember and praise you for. Do download this presentation today.
Dashboard For Tracking Aftersales Customer Services Team Performance Portrait PDF
This slide covers the KPI dashboard for ticket tracking. It includes metrics such as tickets by month, service level, and details of customer service department agents. Retrieve professionally designed Dashboard For Tracking Aftersales Customer Services Team Performance Portrait PDF to effectively convey your message and captivate your listeners. Save time by selecting pre-made slideshows that are appropriate for various topics, from business to educational purposes. These themes come in many different styles, from creative to corporate, and all of them are easily adjustable and can be edited quickly. Access them as PowerPoint templates or as Google Slides themes. You do not have to go on a hunt for the perfect presentation because Slidegeeks got you covered from everywhere.
Telehealth Dashboard For Tele Biomarkers Tracking Sample PDF
This slide represents the dashboard for digital biomarkers tracking, and it covers details about coughing, talking, physical activity, respiration, cardiac activity, body orientation, and snoring, including the date and time of these activities. Retrieve professionally designed Telehealth Dashboard For Tele Biomarkers Tracking Sample PDF to effectively convey your message and captivate your listeners. Save time by selecting pre-made slideshows that are appropriate for various topics, from business to educational purposes. These themes come in many different styles, from creative to corporate, and all of them are easily adjustable and can be edited quickly. Access them as PowerPoint templates or as Google Slides themes. You do not have to go on a hunt for the perfect presentation because Slidegeeks got you covered from everywhere.

KPI Dashboard To Measure Sales Divisional Strategy Growth Formats PDF
This slide signifies the key performance indicator to measure sales department strategy growth. It covers information regarding to the units sold, top 10 project, target per agent. Showcasing this set of slides titled KPI Dashboard To Measure Sales Divisional Strategy Growth Formats PDF. The topics addressed in these templates are Sales, Target. All the content presented in this PPT design is completely editable. Download it and make adjustments in color, background, font etc. as per your unique business setting.
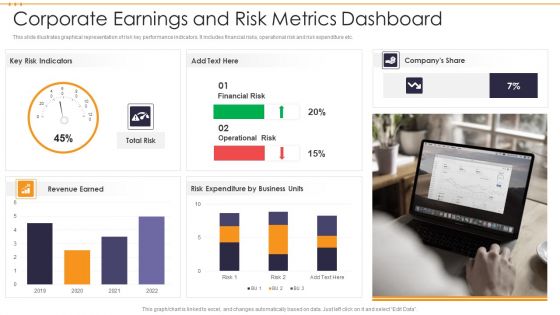
Corporate Earnings And Risk Metrics Dashboard Guidelines PDF
This slide illustrates graphical representation of risk key performance indicators. It includes financial risks, operational risk and risk expenditure etc. Pitch your topic with ease and precision using this Corporate Earnings And Risk Metrics Dashboard Guidelines PDF. This layout presents information on Financial Risk, Operational Risk Expenditure. It is also available for immediate download and adjustment. So, changes can be made in the color, design, graphics or any other component to create a unique layout.

Finance Metrics Dashboard Indicating Portfolio Performance Microsoft PDF
This graph or chart is linked to excel, and changes automatically based on data. Just left click on it and select edit data. Pitch your topic with ease and precision using this Finance Metrics Dashboard Indicating Portfolio Performance Microsoft PDF. This layout presents information on Portfolio Performance Portfolio, Asset Management Manager, Top 10 Assets. It is also available for immediate download and adjustment. So, changes can be made in the color, design, graphics or any other component to create a unique layout.

Corporate Social Responsibility Dashboard Highlighting Operational Performance Improvements Graphics PDF
Persuade your audience using this corporate social responsibility dashboard highlighting operational performance improvements graphics pdf. This PPT design covers three stages, thus making it a great tool to use. It also caters to a variety of topics including operational performance, materials innovations, social responsibility. Download this PPT design now to present a convincing pitch that not only emphasizes the topic but also showcases your presentation skills.
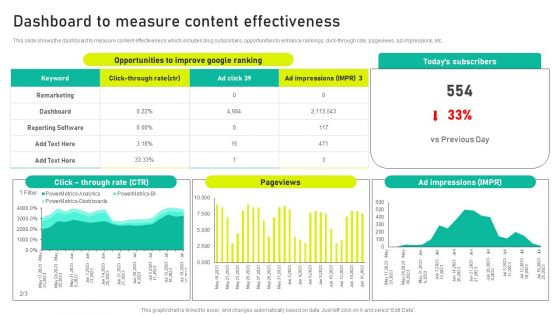
Dashboard To Measure Content Effectiveness Ppt Ideas Diagrams PDF
This slide shows the dashboard to measure content effectiveness which includes blog subscribers, opportunities to enhance rankings, click-through rate, pageviews, ad impressions, etc. Coming up with a presentation necessitates that the majority of the effort goes into the content and the message you intend to convey. The visuals of a PowerPoint presentation can only be effective if it supplements and supports the story that is being told. Keeping this in mind our experts created Dashboard To Measure Content Effectiveness Ppt Ideas Diagrams PDF to reduce the time that goes into designing the presentation. This way, you can concentrate on the message while our designers take care of providing you with the right template for the situation.

Dashboard For Software Defined Networking SDN Ppt Slides Images PDF
This slide depicts the dashboard for the software-defined network by covering details of bandwidth administrator, traffic quality, active flows, development tools, completed tasks, wide-area network bandwidth, and G drive. Coming up with a presentation necessitates that the majority of the effort goes into the content and the message you intend to convey. The visuals of a PowerPoint presentation can only be effective if it supplements and supports the story that is being told. Keeping this in mind our experts created Dashboard For Software Defined Networking SDN Ppt Slides Images PDF to reduce the time that goes into designing the presentation. This way, you can concentrate on the message while our designers take care of providing you with the right template for the situation.
Dashboard For Software Defined Networking SDN Ppt Icon Samples PDF
This slide depicts the dashboard for the software-defined network by covering details of bandwidth administrator, traffic quality, active flows, development tools, completed tasks, wide-area network bandwidth, and G drive. Coming up with a presentation necessitates that the majority of the effort goes into the content and the message you intend to convey. The visuals of a PowerPoint presentation can only be effective if it supplements and supports the story that is being told. Keeping this in mind our experts created Dashboard For Software Defined Networking SDN Ppt Icon Samples PDF to reduce the time that goes into designing the presentation. This way, you can concentrate on the message while our designers take care of providing you with the right template for the situation.

Social Media Artificial Intelligence Data Visualization Capabilities Dashboard Inspiration PDF
This slide illustrates graphical representation of visualization abilities of artificial intelligence on social media. It includes total impressions, total clicks, performance review etc. Pitch your topic with ease and precision using this Social Media Artificial Intelligence Data Visualization Capabilities Dashboard Inspiration PDF. This layout presents information on Artificial Intelligence, Data Visualization Capabilities. It is also available for immediate download and adjustment. So, changes can be made in the color, design, graphics or any other component to create a unique layout.
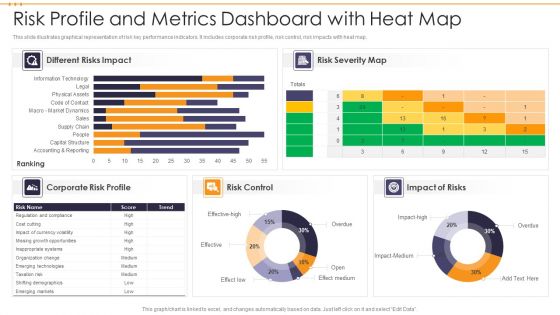
Risk Profile And Metrics Dashboard With Heat Map Brochure PDF
This slide illustrates graphical representation of risk key performance indicators. It includes corporate risk profile, risk control, risk impacts with heat map. Showcasing this set of slides titled Risk Profile And Metrics Dashboard With Heat Map Brochure PDF. The topics addressed in these templates are Risk Control, Impact Of Risks, Risk Severity Map. All the content presented in this PPT design is completely editable. Download it and make adjustments in color, background, font etc. as per your unique business setting.
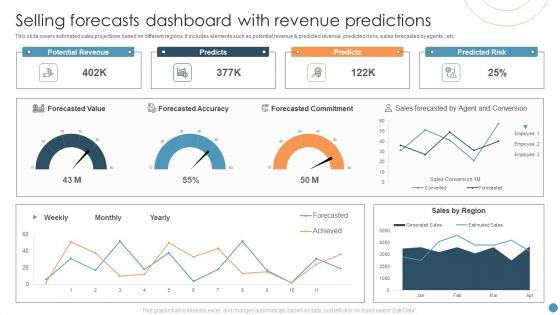
Selling Forecasts Dashboard With Revenue Predictions Elements PDF
This slide covers estimated sales projections based on different regions. It includes elements such as potential revenue and predicted revenue, predicted risks, sales forecasted by agents , etc. Showcasing this set of slides titled Selling Forecasts Dashboard With Revenue Predictions Elements PDF. The topics addressed in these templates are Forecasted Value, Potential Revenue, Predicted Risk. All the content presented in this PPT design is completely editable. Download it and make adjustments in color, background, font etc. as per your unique business setting.
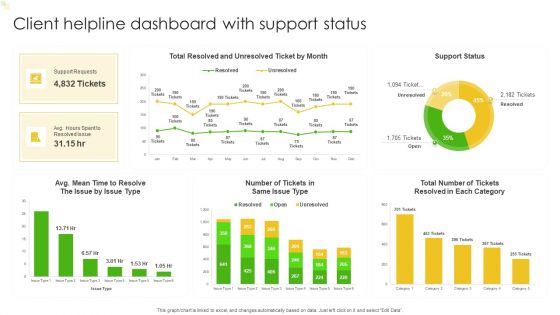
Client Helpline Dashboard With Support Status Ppt Portfolio Rules PDF
This graph or chart is linked to excel, and changes automatically based on data. Just left click on it and select Edit Data. Showcasing this set of slides titled Client Helpline Dashboard With Support Status Ppt Portfolio Rules PDF. The topics addressed in these templates are Total Number, Support Requests, Total Resolved, Support Status. All the content presented in this PPT design is completely editable. Download it and make adjustments in color, background, font etc. as per your unique business setting.
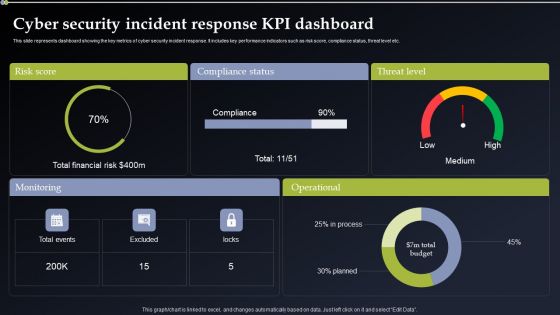
Cyber Security Incident Response KPI Dashboard Pictures PDF
This slide represents dashboard showing the key metrics of cyber security incident response. It includes key performance indicators such as risk score, compliance status, threat level etc. Do you know about Slidesgeeks Cyber Security Incident Response KPI Dashboard Pictures PDF These are perfect for delivering any kind od presentation. Using it, create PowerPoint presentations that communicate your ideas and engage audiences. Save time and effort by using our pre designed presentation templates that are perfect for a wide range of topic. Our vast selection of designs covers a range of styles, from creative to business, and are all highly customizable and easy to edit. Download as a PowerPoint template or use them as Google Slides themes.
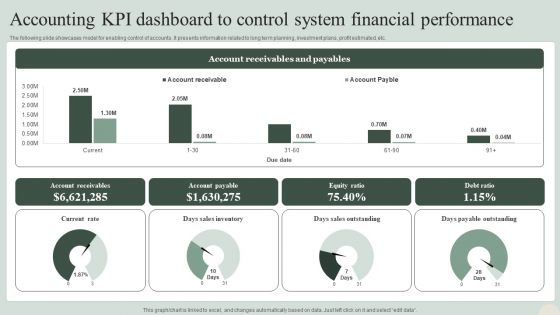
Accounting KPI Dashboard To Control System Financial Performance Formats PDF
The following slide showcases model for enabling control of accounts. It presents information related to long term planning, investment plans, profit estimated, etc. Pitch your topic with ease and precision using this Accounting KPI Dashboard To Control System Financial Performance Formats PDF. This layout presents information on Sales Outstanding, Payable Outstanding, Sales Inventory. It is also available for immediate download and adjustment. So, changes can be made in the color, design, graphics or any other component to create a unique layout.

Evaluating Impact Of Green Marketing With Kpi Dashboard Inspiration PDF
The following slide depicts dashboard to evaluate consequences of sustainable marketing on sales performance and plan future actions. It includes key performance indicators such as orders, net profit margin, sales by location, channel, packaging costs, sales price etc. This Evaluating Impact Of Green Marketing With Kpi Dashboard Inspiration PDF from Slidegeeks makes it easy to present information on your topic with precision. It provides customization options, so you can make changes to the colors, design, graphics, or any other component to create a unique layout. It is also available for immediate download, so you can begin using it right away. Slidegeeks has done good research to ensure that you have everything you need to make your presentation stand out. Make a name out there for a brilliant performance.
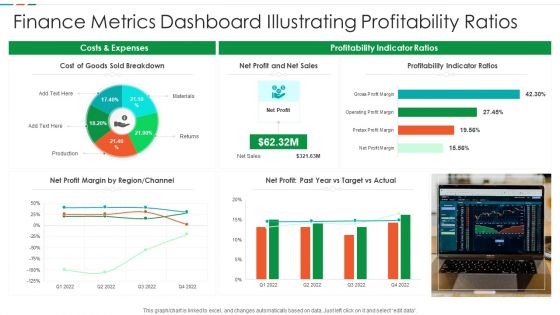
Finance Metrics Dashboard Illustrating Profitability Ratios Diagrams PDF
This graph or chart is linked to excel, and changes automatically based on data. Just left click on it and select edit data. Pitch your topic with ease and precision using this Finance Metrics Dashboard Illustrating Profitability Ratios Diagrams PDF. This layout presents information on Cost Goods Sold, Net Profit Net, Sales Profitability Indicator. It is also available for immediate download and adjustment. So, changes can be made in the color, design, graphics or any other component to create a unique layout.
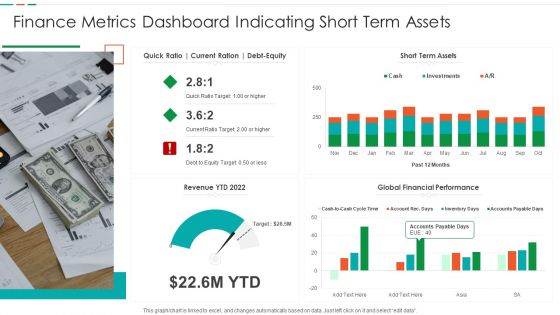
Finance Metrics Dashboard Indicating Short Term Assets Download PDF
This graph or chart is linked to excel, and changes automatically based on data. Just left click on it and select edit data. Pitch your topic with ease and precision using this Finance Metrics Dashboard Indicating Short Term Assets Download PDF. This layout presents information on Short Term Assets, Global Financial Performance, Revenue YTD 2022. It is also available for immediate download and adjustment. So, changes can be made in the color, design, graphics or any other component to create a unique layout.

Multiple Country Energy Consumption Statistics Comparison Dashboard Formats PDF
This graph or chart is linked to excel, and changes automatically based on data. Just left click on it and select edit data. Pitch your topic with ease and precision using this Multiple Country Energy Consumption Statistics Comparison Dashboard Formats PDF. This layout presents information on Nuclear, Renewables, Gas. It is also available for immediate download and adjustment. So, changes can be made in the color, design, graphics or any other component to create a unique layout.

Corporate Hospitality Administration Dashboard With Occupancy Rate Guidelines PDF
This slide illustrates facts and figures related to hotel chain bookings and occupancy data. It includes visitors, occupancy rate, revenue, bookings comparison, occupancy type, etc.Pitch your topic with ease and precision using this Corporate Hospitality Administration Dashboard With Occupancy Rate Guidelines PDF. This layout presents information on Occupancy Rate, Average Daily Rate, Bookings Comparison. It is also available for immediate download and adjustment. So, changes can be made in the color, design, graphics or any other component to create a unique layout.
KPI Metrics Dashboard Icon For Freelance Content Marketing Ideas PDF
Persuade your audience using this KPI Metrics Dashboard Icon For Freelance Content Marketing Ideas PDF. This PPT design covers four stages, thus making it a great tool to use. It also caters to a variety of topics including Kpi Metrics, Freelance Content Marketing. Download this PPT design now to present a convincing pitch that not only emphasizes the topic but also showcases your presentation skills.

Business Employee Demographics Dashboard With Turnover Graphics PDF
The slide showcases dashboard which provides insights on companys employee demographics and enables to connect recruitment, hiring, retention, and turnover data to demographics that helps to identify gaps and introduce targeted actions to mitigate this across the areas of recruitment, hiring and retention. It covers gender distribution, ethnicity distribution, hires by gender , hires by ethnicity, turnover by gender and turnover by ethnicity. Showcasing this set of slides titled Business Employee Demographics Dashboard With Turnover Graphics PDF The topics addressed in these templates are Ethnicity Distribution, Turnover Ethnicity, Gender Distribution. All the content presented in this PPT design is completely editable. Download it and make adjustments in color, background, font etc. as per your unique business setting.
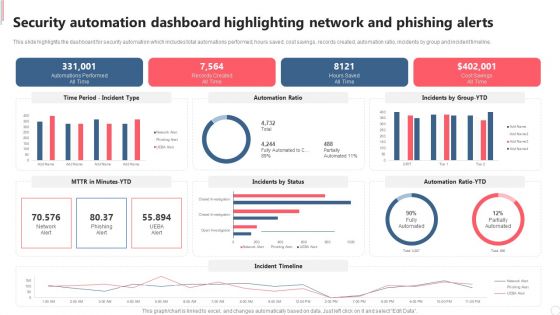
Security Automation Dashboard Highlighting Network And Phishing Alerts Demonstration PDF
This slide highlights the dashboard for security automation which includes total automations performed, hours saved, cost savings, records created, automation ratio, incidents by group and incident timeline. Welcome to our selection of the Security Automation Dashboard Highlighting Network And Phishing Alerts Demonstration PDF. These are designed to help you showcase your creativity and bring your sphere to life. Planning and Innovation are essential for any business that is just starting out. This collection contains the designs that you need for your everyday presentations. All of our PowerPoints are 100 percent editable, so you can customize them to suit your needs. This multi purpose template can be used in various situations. Grab these presentation templates today.

KPI Dashboard To Monitor Workforce Diversity Portrait PDF
This slide illustrates the KPI dashboard for workforce diversity providing details regarding headcount by seniority, gender and gender. It also provides information regarding monthly median age by gender and women at senior level forecast. Welcome to our selection of the KPI Dashboard To Monitor Workforce Diversity Portrait PDF. These are designed to help you showcase your creativity and bring your sphere to life. Planning and Innovation are essential for any business that is just starting out. This collection contains the designs that you need for your everyday presentations. All of our PowerPoints are 100 percent editable, so you can customize them to suit your needs. This multi purpose template can be used in various situations. Grab these presentation templates today.
Website Performance Tracking And Monitoring Dashboard Inspiration PDF
The following slide showcases a dashboard to track and measure website performance. It includes key elements such as visits, average session duration, bounce rate, page views, goal conversion, visits by week, traffic sources, top channels by conversions, etc. Welcome to our selection of the Website Performance Tracking And Monitoring Dashboard Inspiration PDF. These are designed to help you showcase your creativity and bring your sphere to life. Planning and Innovation are essential for any business that is just starting out. This collection contains the designs that you need for your everyday presentations. All of our PowerPoints are 100 percent editable, so you can customize them to suit your needs. This multi purpose template can be used in various situations. Grab these presentation templates today.
Project Tracking Dashboard With Multiple Metrics Pictures PDF
The following slide highlights the KPI of project management to avoid deviations. It includes elements such as schedule, tasks, issue assessment, budget and risk analysis etc. Pitch your topic with ease and precision using this Project Tracking Dashboard With Multiple Metrics Pictures PDF. This layout presents information on Projected Budget Analysis, Risk Analysis, Quality Affirmation. It is also available for immediate download and adjustment. So, changes can be made in the color, design, graphics or any other component to create a unique layout.
Monthly Sales Performance Tracking And Monitoring Dashboard Inspiration PDF
This slide showcases a dashboard presenting various metrics to measure and analyze sales performance for revenue growth. It includes key components such as number of sales, revenue, profit, cost, sales revenue, sales increment, cost analysis and cross sell. Coming up with a presentation necessitates that the majority of the effort goes into the content and the message you intend to convey. The visuals of a PowerPoint presentation can only be effective if it supplements and supports the story that is being told. Keeping this in mind our experts created Monthly Sales Performance Tracking And Monitoring Dashboard Inspiration PDF to reduce the time that goes into designing the presentation. This way, you can concentrate on the message while our designers take care of providing you with the right template for the situation.

Ecommerce KPI Dashboard With Pand L Statement Download PDF
This slide showcases ecommerce key performance indicators KPI dashboard with financial statement. It provides information about total sales, orders, net profit, net profit margin, average order value, channels, etc. This Ecommerce KPI Dashboard With Pand L Statement Download PDF from Slidegeeks makes it easy to present information on your topic with precision. It provides customization options, so you can make changes to the colors, design, graphics, or any other component to create a unique layout. It is also available for immediate download, so you can begin using it right away. Slidegeeks has done good research to ensure that you have everything you need to make your presentation stand out. Make a name out there for a brilliant performance.

Finance Metrics Dashboard Illustrating Monthly Gross Profit Formats PDF
This graph or chart is linked to excel, and changes automatically based on data. Just left click on it and select edit data. Showcasing this set of slides titled Finance Metrics Dashboard Illustrating Monthly Gross Profit Formats PDF. The topics addressed in these templates are Profit Metrics Gross, Profit Target Cum, Actual Cum Target. All the content presented in this PPT design is completely editable. Download it and make adjustments in color, background, font etc. as per your unique business setting.

Energy Consumption Statistics Dashboard With Production Costs Slides PDF
This graph or chart is linked to excel, and changes automatically based on data. Just left click on it and select edit data. Showcasing this set of slides titled Energy Consumption Statistics Dashboard With Production Costs Slides PDF. The topics addressed in these templates are Production Cost, Sales Energy, Number Power. All the content presented in this PPT design is completely editable. Download it and make adjustments in color, background, font etc. as per your unique business setting.

Energy Consumption Statistics Dashboard With Yearly Savings Guidelines PDF
This graph or chart is linked to excel, and changes automatically based on data. Just left click on it and select edit data. Showcasing this set of slides titled Energy Consumption Statistics Dashboard With Yearly Savings Guidelines PDF. The topics addressed in these templates are Production Consumption, Energy Savings, Performance Ratio. All the content presented in this PPT design is completely editable. Download it and make adjustments in color, background, font etc. as per your unique business setting.
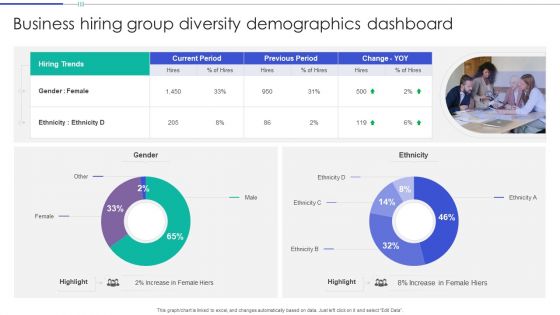
Business Hiring Group Diversity Demographics Dashboard Guidelines PDF
This graph or chart is linked to excel, and changes automatically based on data. Just left click on it and select Edit Data. Showcasing this set of slides titled Business Hiring Group Diversity Demographics Dashboard Guidelines PDF. The topics addressed in these templates are Hiring Trends, Current Period, Previous Period. All the content presented in this PPT design is completely editable. Download it and make adjustments in color, background, font etc. as per your unique business setting.

Education Dashboard With Student Attendance And Detention Metrics Inspiration PDF
This slide showcases the student enrollment and suspension KPI tracker. It includes KPIs such as enrollment status, attendance percentage, suspension rate, etc. Pitch your topic with ease and precision using this Education Dashboard With Student Attendance And Detention Metrics Inspiration PDF. This layout presents information on Student Attendance, Suspension Rate YTD, Current Enrollment. It is also available for immediate download and adjustment. So, changes can be made in the color, design, graphics or any other component to create a unique layout.

Kpi Dashboard To Track Business Performance Portrait PDF
Following slide exhibits dashboard to determine impact of environmental assessment on business performance. It include indicators such as business health, tasks, progress, cost , time etc. Do you know about Slidesgeeks Kpi Dashboard To Track Business Performance Portrait PDF These are perfect for delivering any kind od presentation. Using it, create PowerPoint presentations that communicate your ideas and engage audiences. Save time and effort by using our pre-designed presentation templates that are perfect for a wide range of topic. Our vast selection of designs covers a range of styles, from creative to business, and are all highly customizable and easy to edit. Download as a PowerPoint template or use them as Google Slides themes.

Optimizing Online Stores Customer Checkout Behavior KPI Dashboard Brochure PDF
This slide represents the dashboard to help management in analyzing the point at which customers leave the checkout process. It includes details related to KPIs such as shipping drop-off, payment drop-off etc. Slidegeeks is here to make your presentations a breeze with Optimizing Online Stores Customer Checkout Behavior KPI Dashboard Brochure PDF With our easy-to-use and customizable templates, you can focus on delivering your ideas rather than worrying about formatting. With a variety of designs to choose from, youre sure to find one that suits your needs. And with animations and unique photos, illustrations, and fonts, you can make your presentation pop. So whether youre giving a sales pitch or presenting to the board, make sure to check out Slidegeeks first.
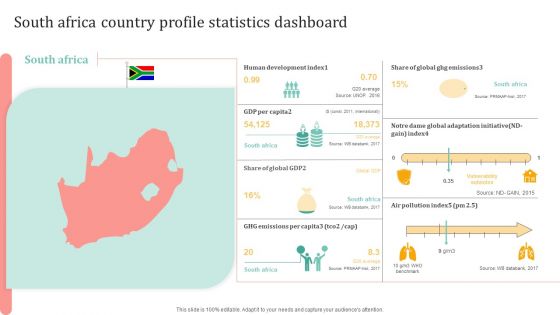
South Africa Country Profile Statistics Dashboard Ppt Infographics Diagrams PDF
Persuade your audience using this South Africa Country Profile Statistics Dashboard Ppt Infographics Diagrams PDF. This PPT design covers one stages, thus making it a great tool to use. It also caters to a variety of topics including Human Development Index, GDP Per Capita, GHG Emissions. Download this PPT design now to present a convincing pitch that not only emphasizes the topic but also showcases your presentation skills.
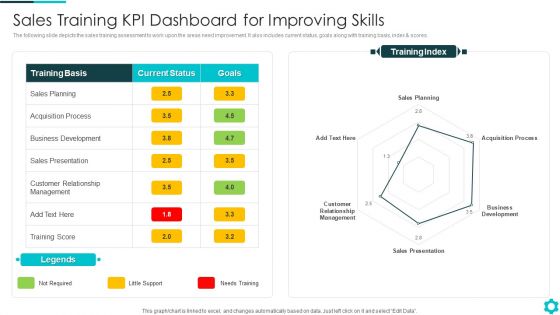
Sales Training KPI Dashboard For Improving Skills Portrait PDF
The following slide depicts the sales training assessment to work upon the areas need improvement. It also includes current status, goals along with training basis, index and scores.Showcasing this set of slides titled Sales Training KPI Dashboard For Improving Skills Portrait PDF The topics addressed in these templates are Acquisition Process, Sales Presentation, Customer Relationship Management All the content presented in this PPT design is completely editable. Download it and make adjustments in color, background, font etc. as per your unique business setting.
Elastic NLB Network Load Balancers Performance Tracker Dashboard Background PDF
This slide shows the dashboard for tracking the network load balancers performance by covering details of balancer status, balancer session, balancer throughput, etc. Coming up with a presentation necessitates that the majority of the effort goes into the content and the message you intend to convey. The visuals of a PowerPoint presentation can only be effective if it supplements and supports the story that is being told. Keeping this in mind our experts created Elastic NLB Network Load Balancers Performance Tracker Dashboard Background PDF to reduce the time that goes into designing the presentation. This way, you can concentrate on the message while our designers take care of providing you with the right template for the situation.

Optimizing Social Networks Social Media Campaign Performance Dashboard Guidelines PDF
This slide shows social media promotional campaign performance dashboard. It provides information about followers, reach, clicks, leads, shares, likes, comments, engagement, etc. Coming up with a presentation necessitates that the majority of the effort goes into the content and the message you intend to convey. The visuals of a PowerPoint presentation can only be effective if it supplements and supports the story that is being told. Keeping this in mind our experts created Optimizing Social Networks Social Media Campaign Performance Dashboard Guidelines PDF to reduce the time that goes into designing the presentation. This way, you can concentrate on the message while our designers take care of providing you with the right template for the situation.

Training Feedback Dashboard To Enhance Program Effectiveness Themes PDF
This slide covers KPI dashboard to assess training effectiveness. It involves details such as net promoter score, training satisfaction rate, engagement score and drop out rate. Coming up with a presentation necessitates that the majority of the effort goes into the content and the message you intend to convey. The visuals of a PowerPoint presentation can only be effective if it supplements and supports the story that is being told. Keeping this in mind our experts created Training Feedback Dashboard To Enhance Program Effectiveness Themes PDF to reduce the time that goes into designing the presentation. This way, you can concentrate on the message while our designers take care of providing you with the right template for the situation.

Employee Retention And Turnover Rates Monitoring Dashboard Professional PDF
This slide showcases a dashboard to supervise and monitor employee retention and turnover score. It includes key components such as active employees, hires, exits, retention rate, turnover rate, etc. Coming up with a presentation necessitates that the majority of the effort goes into the content and the message you intend to convey. The visuals of a PowerPoint presentation can only be effective if it supplements and supports the story that is being told. Keeping this in mind our experts created Employee Retention And Turnover Rates Monitoring Dashboard Professional PDF to reduce the time that goes into designing the presentation. This way, you can concentrate on the message while our designers take care of providing you with the right template for the situation.
CRM Pipeline Administration Tracking Customer Sales Funnel Dashboard Brochure PDF
This slide covers information regarding the customer sales funnel tracking with sales volume and total market. If you are looking for a format to display your unique thoughts, then the professionally designed CRM Pipeline Administration Tracking Customer Sales Funnel Dashboard Brochure PDF is the one for you. You can use it as a Google Slides template or a PowerPoint template. Incorporate impressive visuals, symbols, images, and other charts. Modify or reorganize the text boxes as you desire. Experiment with shade schemes and font pairings. Alter, share or cooperate with other people on your work. Download CRM Pipeline Administration Tracking Customer Sales Funnel Dashboard Brochure PDF and find out how to give a successful presentation. Present a perfect display to your team and make your presentation unforgettable.
Claims Tracking Dashboard Utilized By Insurance Agency Diagrams PDF
This slide provides glimpse about claim activities tracking by insurance agency in terms of claim amount collected, number of claims, claims by product line, claim status assessment, claim expense by product line, etc. If you are looking for a format to display your unique thoughts, then the professionally designed Claims Tracking Dashboard Utilized By Insurance Agency Diagrams PDF is the one for you. You can use it as a Google Slides template or a PowerPoint template. Incorporate impressive visuals, symbols, images, and other charts. Modify or reorganize the text boxes as you desire. Experiment with shade schemes and font pairings. Alter, share or cooperate with other people on your work. Download Claims Tracking Dashboard Utilized By Insurance Agency Diagrams PDF and find out how to give a successful presentation. Present a perfect display to your team and make your presentation unforgettable.
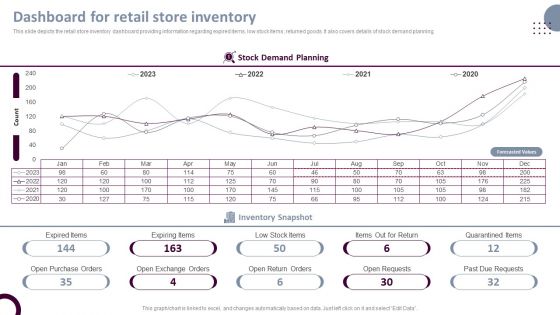
Retail Store Operations Dashboard For Retail Store Inventory Demonstration PDF
This slide depicts the retail store inventory dashboard providing information regarding expired items, low stock items, returned goods. It also covers details of stock demand planning. Are you in need of a template that can accommodate all of your creative concepts This one is crafted professionally and can be altered to fit any style. Use it with Google Slides or PowerPoint. Include striking photographs, symbols, depictions, and other visuals. Fill, move around, or remove text boxes as desired. Test out color palettes and font mixtures. Edit and save your work, or work with colleagues. Download Retail Store Operations Dashboard For Retail Store Inventory Demonstration PDF and observe how to make your presentation outstanding. Give an impeccable presentation to your group and make your presentation unforgettable.
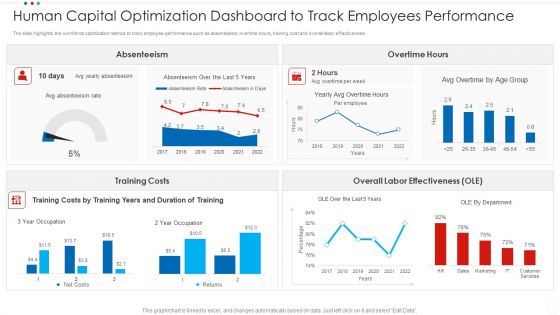
Human Capital Optimization Dashboard To Track Employees Performance Inspiration PDF
The slide highlights the workforce optimization metrics to track employee performance such as absenteeism, overtime hours, training cost and overall labor effectiveness. Pitch your topic with ease and precision using this human capital optimization dashboard to track employees performance inspiration pdf. This layout presents information on training costs, overtime hours, absenteeism. It is also available for immediate download and adjustment. So, changes can be made in the color, design, graphics or any other component to create a unique layout.
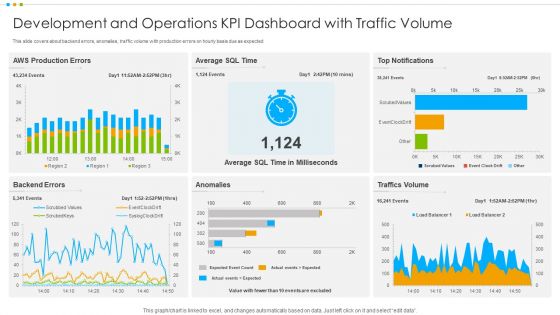
Development And Operations KPI Dashboard With Traffic Volume Professional PDF
This slide covers about backend errors, anomalies, traffic volume with production errors on hourly basis due as expected.Pitch your topic with ease and precision using this Development And Operations KPI Dashboard With Traffic Volume Professional PDF This layout presents information on Anomalies, Traffics Volume, Production Errors It is also available for immediate download and adjustment. So, changes can be made in the color, design, graphics or any other component to create a unique layout.

Talent Acquisition And Multinational Hiring KPI Dashboard Mockup PDF
The slide highlights the talent acquisition and multinational recruitment dash board depicting number of positions, open positions by location, candidate pipeline, interview and compliance.Pitch your topic with ease and precision using this Talent Acquisition And Multinational Hiring KPI Dashboard Mockup PDF This layout presents information on Candidate Ranking, Positions, Contingent It is also available for immediate download and adjustment. So, changes can be made in the color, design, graphics or any other component to create a unique layout.
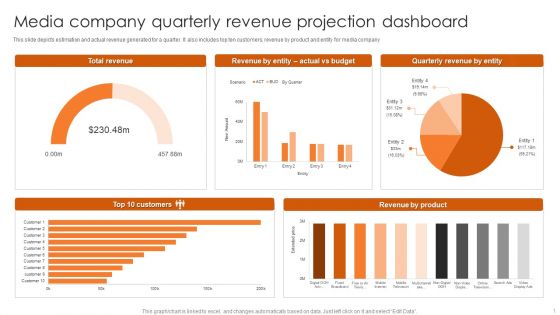
Media Company Quarterly Revenue Projection Dashboard Mockup PDF
This slide depicts estimation and actual revenue generated for a quarter. It also includes top ten customers, revenue by product and entity for media company. Pitch your topic with ease and precision using this Media Company Quarterly Revenue Projection Dashboard Mockup PDF. This layout presents information on Total Revenue, Quarterly Revenue Entity, Top 10 Customers. It is also available for immediate download and adjustment. So, changes can be made in the color, design, graphics or any other component to create a unique layout.
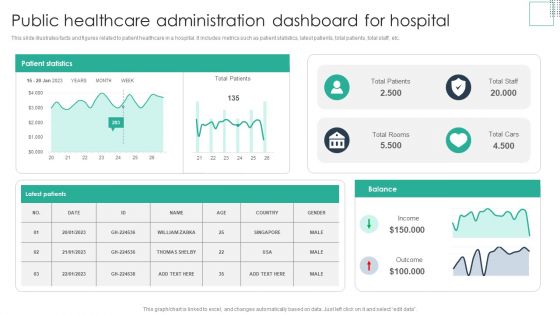
Public Healthcare Administration Dashboard For Hospital Guidelines PDF
This slide illustrates facts and figures related to patient healthcare in a hospital. It includes metrics such as patient statistics, latest patients, total patients, total staff, etc.Pitch your topic with ease and precision using this Public Healthcare Administration Dashboard For Hospital Guidelines PDF. This layout presents information on Total Patients, Total Rooms, Patient Statistics. It is also available for immediate download and adjustment. So, changes can be made in the color, design, graphics or any other component to create a unique layout.
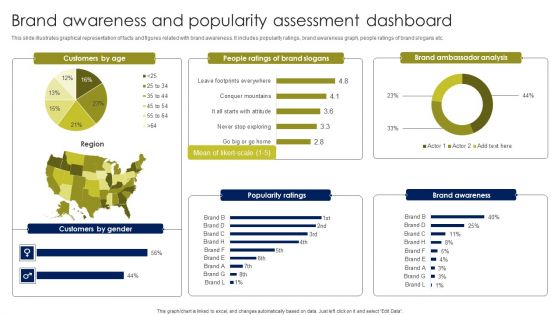
Brand Awareness And Popularity Assessment Dashboard Topics PDF
This slide illustrates graphical representation of facts and figures related with brand awareness. It includes popularity ratings, brand awareness graph, people ratings of brand slogans etc. Pitch your topic with ease and precision using thisBrand Awareness And Popularity Assessment Dashboard Topics PDF. This layout presents information on Customers By Age, Brand Ambassador Analysis, Brand Awareness. It is also available for immediate download and adjustment. So, changes can be made in the color, design, graphics or any other component to create a unique layout.
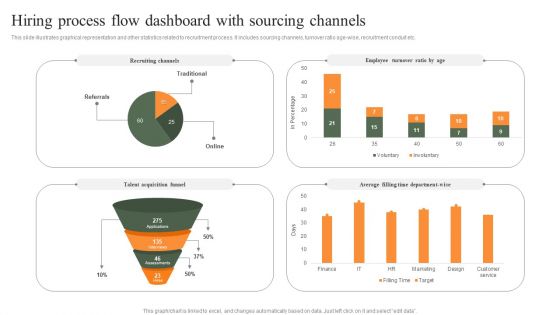
Hiring Process Flow Dashboard With Sourcing Channels Professional PDF
This slide illustrates graphical representation and other statistics related to recruitment process. It includes sourcing channels, turnover ratio age-wise, recruitment conduit etc. Pitch your topic with ease and precision using this Hiring Process Flow Dashboard With Sourcing Channels Professional PDF. This layout presents information on Employee Turnover Ratio, Recruiting Channels, Average. It is also available for immediate download and adjustment. So, changes can be made in the color, design, graphics or any other component to create a unique layout.

Corporate Bonus Payouts And Performance Incentives Dashboard Mockup PDF
This slide illustrates facts and figures related to performance bonus in a corporation. It includes total monthly payouts, eligible employee payout, target achievement analysis etc. Pitch your topic with ease and precision using this Corporate Bonus Payouts And Performance Incentives Dashboard Mockup PDF. This layout presents information on Monthly Payouts, Employee Payout, Average Employee. It is also available for immediate download and adjustment. So, changes can be made in the color, design, graphics or any other component to create a unique layout.

 Home
Home