Executive Summary Dashboard
Key Business Metrics Dashboard Ppt Powerpoint Presentation Icon Graphics Design
This is a key business metrics dashboard ppt powerpoint presentation icon graphics design. This is a five stage process. The stages in this process are finance, marketing, management, investment, analysis.
E Commerce Project Planning And Management Dashboard Icon Background PDF
Persuade your audience using this E Commerce Project Planning And Management Dashboard Icon Background PDF. This PPT design covers three stages, thus making it a great tool to use. It also caters to a variety of topics including E Commerce Project Planning And Management Dashboard Icon. Download this PPT design now to present a convincing pitch that not only emphasizes the topic but also showcases your presentation skills.

Sales Performance Dashboard Marketing Ppt PowerPoint Presentation Slides Graphics Design
This is a sales performance dashboard marketing ppt powerpoint presentation slides graphics design. This is a four stage process. The stages in this process are compare, marketing, business, management, planning.

Real Estate Property Management Dashboard With Leasing Status Graphics PDF
This slide shows real estate property management dashboard with leasing status which can be referred by companies to have an overview about their performance. It includes information about revenue, properties, recent tasks, expired leases, outstanding balances, etc.Pitch your topic with ease and precision using this real estate property management dashboard with leasing status graphics pdf This layout presents information on property revenue overview, leases which are expiring, recent tasks It is also available for immediate download and adjustment. So, changes can be made in the color, design, graphics or any other component to create a unique layout.
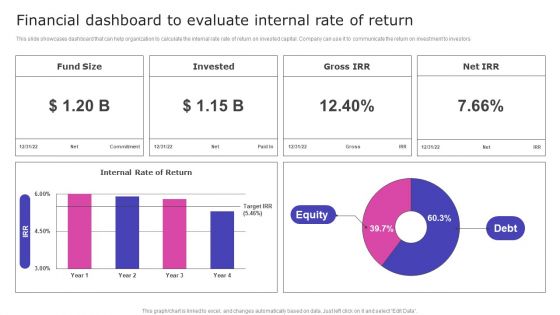
Financial Dashboard To Evaluate Internal Rate Of Return Diagrams PDF
This slide showcases dashboard that can help organization to calculate the internal rate rate of return on invested capital. Company can use it to communicate the return on investment to investors. Create an editable Financial Dashboard To Evaluate Internal Rate Of Return Diagrams PDF that communicates your idea and engages your audience. Whether youre presenting a business or an educational presentation, pre designed presentation templates help save time. Financial Dashboard To Evaluate Internal Rate Of Return Diagrams PDF is highly customizable and very easy to edit, covering many different styles from creative to business presentations. Slidegeeks has creative team members who have crafted amazing templates. So, go and get them without any delay.
Cyber Protection And Precaution Tracking Dashboard Designs PDF
This slide shows the dashboard of cyber safety and security of an organization. It includes risk level, compliance status, tracking and security budget. Showcasing this set of slides titled Cyber Protection And Precaution Tracking Dashboard Designs PDF. The topics addressed in these templates are Risk, Compliance Status, Risk Level. All the content presented in this PPT design is completely editable. Download it and make adjustments in color, background, font etc. as per your unique business setting.
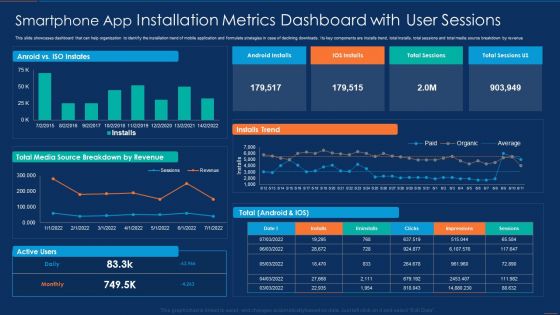
Smartphone App Installation Metrics Dashboard With User Sessions Microsoft PDF
This slide showcases dashboard that can help organization to identify the installation trend of mobile application and formulate strategies in case of declining downloads. Its key components are installs trend, total installs, total sessions and total media source breakdown by revenue. Pitch your topic with ease and precision using this Smartphone App Installation Metrics Dashboard With User Sessions Microsoft PDF. This layout presents information on Smartphone App Installation Metrics Dashboard With User Sessions. It is also available for immediate download and adjustment. So, changes can be made in the color, design, graphics or any other component to create a unique layout.
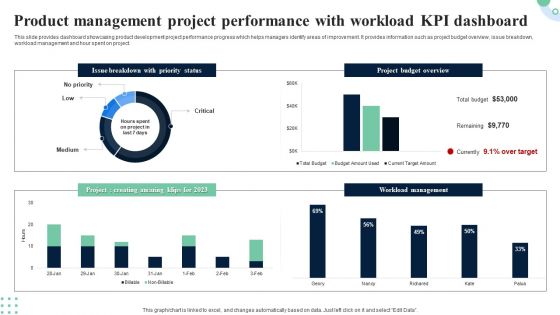
Product Management Project Performance With Workload KPI Dashboard Structure PDF
This slide provides dashboard showcasing product development project performance progress which helps managers identify areas of improvement. It provides information such as project budget overview, issue breakdown, workload management and hour spent on project. Pitch your topic with ease and precision using this Product Management Project Performance With Workload KPI Dashboard Structure PDF. This layout presents information on Project Budget Overview, Workload Management. It is also available for immediate download and adjustment. So, changes can be made in the color, design, graphics or any other component to create a unique layout.
Cyber Security Threat Dashboard With KPI Metrics Icons PDF
This slide shows dashboard of cyber threats to organization and metrics and performance indicators for security officer. It covers operational health, audit and compliance, controls health and project status. Showcasing this set of slides titled Cyber Security Threat Dashboard With KPI Metrics Icons PDF. The topics addressed in these templates are Cyber Security Threat Dashboard, Kpi Metrics. All the content presented in this PPT design is completely editable. Download it and make adjustments in color, background, font etc. as per your unique business setting.

Retail Store Performance Dashboard To Analyze Merchandising Plan Structure PDF
Mentioned slide showcases KPI dashboard which can be used by retail managers to access the merchandising strategy performance. The dashboard covers information about net sales, gross profit from different stores, average basket value etc.Showcasing this set of slides titled Retail Store Performance Dashboard To Analyze Merchandising Plan Structure PDF. The topics addressed in these templates are Sales Volume, Average Basket, Gross Profit. All the content presented in this PPT design is completely editable. Download it and make adjustments in color, background, font etc. as per your unique business setting.

Case Administration Dashboard With Resolved Cases Graphics PDF
This slide shows dashboard which can be used to monitor the status of case management solved in the organizations. It includes key performance indicators such as active cases by priority, by subject, by age, by branch, etc. Pitch your topic with ease and precision using this Case Administration Dashboard With Resolved Cases Graphics PDF. This layout presents information on Case Administration Dashboard, Resolved Cases. It is also available for immediate download and adjustment. So, changes can be made in the color, design, graphics or any other component to create a unique layout.

Employee Engagement Dashboard Ppt PowerPoint Presentation Layouts Inspiration
This is a employee engagement dashboard ppt powerpoint presentation layouts inspiration. This is a four stage process. The stages in this process are personal growth, technical skills, marketing, planning, strategy.

Evaluating Rank Prospects Lead Scoring Dashboard Ppt Model Display PDF
The dashboard will provide overall scenario of all leads and track various leads based on the gradingpoint assigned to them. Deliver and pitch your topic in the best possible manner with this evaluating rank prospects lead scoring dashboard ppt model display pdf. Use them to share invaluable insights on lead score overview, profile, engagement and impress your audience. This template can be altered and modified as per your expectations. So, grab it now.
Retail Trading Platform Ecommerce Website Performance Tracking Dashboard Pictures PDF
This slide provides information regarding ecommerce website performance tracking dashboard addressing page views, website conversions, etc. Deliver and pitch your topic in the best possible manner with this retail trading platform ecommerce website performance tracking dashboard pictures pdf. Use them to share invaluable insights on website performance month, website conversions last 7 days, website overview today and impress your audience. This template can be altered and modified as per your expectations. So, grab it now.
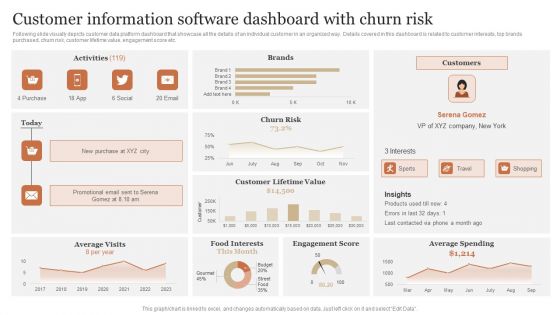
Customer Information Software Dashboard With Churn Risk Information PDF
Following slide visually depicts customer data platform dashboard that showcase all the details of an individual customer in an organized way. Details covered in this dashboard is related to customer interests, top brands purchased, churn risk, customer lifetime value, engagement score etc. Pitch your topic with ease and precision using this Customer Information Software Dashboard With Churn Risk Information PDF. This layout presents information on Customer Lifetime, Engagement Score, Average Spending. It is also available for immediate download and adjustment. So, changes can be made in the color, design, graphics or any other component to create a unique layout.

Customer Service Metrics Dashboard With Active Customers Ideas PDF
This slide showcases dashboard for customer service metrics that can help organization to prioritize the issue requests of consumers and ensure good response times. Its key components are active customer, active tickets, highly urgent rickets and average number of tickets. Showcasing this set of slides titled Customer Service Metrics Dashboard With Active Customers Ideas PDF. The topics addressed in these templates are Customer Service, Metrics Dashboard, Active Customers. All the content presented in this PPT design is completely editable. Download it and make adjustments in color, background, font etc. as per your unique business setting.
Data Breach Prevention Status Tracking Dashboard Data Fortification Strengthening Defenses
This slide represents the critical cyber security performance indicators for the organization. The key components include application health, encryption status, license consumption, windows defender, etc.Are you in need of a template that can accommodate all of your creative concepts This one is crafted professionally and can be altered to fit any style. Use it with Google Slides or PowerPoint. Include striking photographs, symbols, depictions, and other visuals. Fill, move around, or remove text boxes as desired. Test out color palettes and font mixtures. Edit and save your work, or work with colleagues. Download Data Breach Prevention Status Tracking Dashboard Data Fortification Strengthening Defenses and observe how to make your presentation outstanding. Give an impeccable presentation to your group and make your presentation unforgettable.
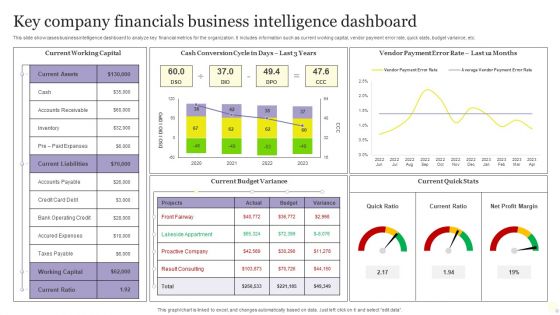
Key Company Financials Business Intelligence Dashboard Graphics PDF
This slide showcases business intelligence dashboard to analyze key financial metrics for the organization. It includes information such as current working capital, vendor payment error rate, quick stats, budget variance, etc. Showcasing this set of slides titled Key Company Financials Business Intelligence Dashboard Graphics PDF. The topics addressed in these templates are Key Company Financials, Business Intelligence Dashboard. All the content presented in this PPT design is completely editable. Download it and make adjustments in color, background, font etc. as per your unique business setting.

Digital KPI Dashboard To Track Email Bounce Slides PDF
This slide shows dashboard which can e used by organizations to monitor performance of email. It includes key performance indicators such as traffic status, conversions, behaviors, etc. Pitch your topic with ease and precision using this Digital KPI Dashboard To Track Email Bounce Slides PDF. This layout presents information on Digital Kpi Dashboard, Track Email Bounce. It is also available for immediate download and adjustment. So, changes can be made in the color, design, graphics or any other component to create a unique layout.

Leadership Recruitment Dashboard With Recruitment Funnel Slides PDF
The slide shows a dashboard for managing recruitment process of an organization for leadership hiring. It includes cost of hiring by different levels, turnover rate by different age groups, hiring funnel and average time taken by each department for hiring. Pitch your topic with ease and precision using this Leadership Recruitment Dashboard With Recruitment Funnel Slides PDF. This layout presents information on Leadership Recruitment, Dashboard With Recruitment. It is also available for immediate download and adjustment. So, changes can be made in the color, design, graphics or any other component to create a unique layout.
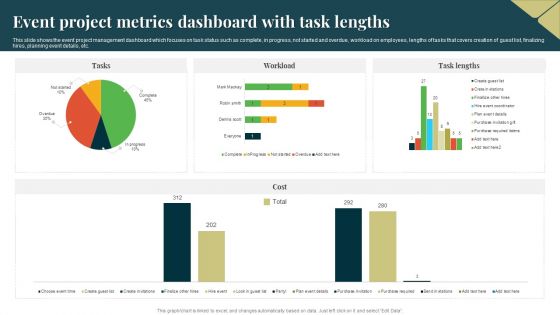
Event Project Metrics Dashboard With Task Lengths Template PDF
This slide shows the event project management dashboard which focuses on task status such as complete, in progress, not started and overdue, workload on employees, lengths of tasks that covers creation of guest list, finalizing hires, planning event details, etc. Showcasing this set of slides titled Event Project Metrics Dashboard With Task Lengths Template PDF. The topics addressed in these templates are Event Project Metrics Dashboard, Cost. All the content presented in this PPT design is completely editable. Download it and make adjustments in color, background, font etc. as per your unique business setting.
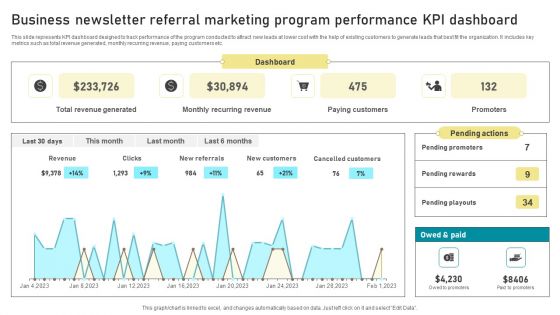
Business Newsletter Referral Marketing Program Performance KPI Dashboard Formats PDF
This slide represents KPI dashboard designed to track performance of the program conducted to attract new leads at lower cost with the help of existing customers to generate leads that best fit the organization. It includes key metrics such as total revenue generated, monthly recurring revenue, paying customers etc. Showcasing this set of slides titled Business Newsletter Referral Marketing Program Performance KPI Dashboard Formats PDF. The topics addressed in these templates are Dashboard, Paying Customers, Monthly Recurring Revenue, Total Revenue Generated. All the content presented in this PPT design is completely editable. Download it and make adjustments in color, background, font etc. as per your unique business setting.

Project Metrics Dashboard With Team Requests Background PDF
This slide focuses on the project management dashboard which shows the creation of monthly number of requests, requests made by departmental teams, average completion time in days with the number of requests created on week days, etc. Pitch your topic with ease and precision using this Project Metrics Dashboard With Team Requests Background PDF. This layout presents information on Project Metrics Dashboard, Team Requests. It is also available for immediate download and adjustment. So, changes can be made in the color, design, graphics or any other component to create a unique layout.
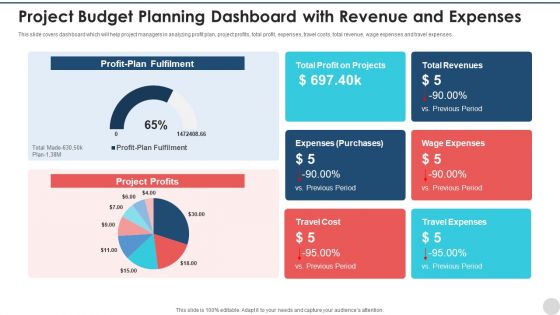
Project Budget Planning Dashboard With Revenue And Expenses Ideas PDF
This slide covers dashboard which will help project managers in analyzing profit plan, project profits, total profit, expenses, travel costs, total revenue, wage expenses and travel expenses. Showcasing this set of slides titled project budget planning dashboard with revenue and expenses ideas pdf. The topics addressed in these templates are project budget planning dashboard with revenue and expenses. All the content presented in this PPT design is completely editable. Download it and make adjustments in color, background, font etc. as per your unique business setting.

Texting Platforms Dashboard Indicating SMS Marketing Metrics Designs PDF
This slide showcase messaging platforms dashboard indicating sms marketing metrics which can be referred by businesses to check the activity of their current texting campaign. It contains information about consumers, plan, send, campaigns, growth, reports, outgoing and incoming.Pitch your topic with ease and precision using this texting platforms dashboard indicating sms marketing metrics designs pdf This layout presents information on texting platforms dashboard indicating sms marketing metrics It is also available for immediate download and adjustment. So, changes can be made in the color, design, graphics or any other component to create a unique layout.
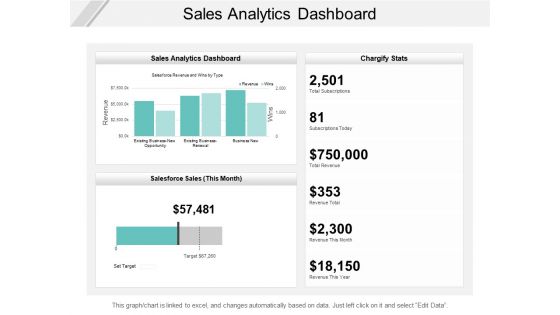
Sales Analytics Dashboard Ppt PowerPoint Presentation Outline Diagrams
Presenting this set of slides with name sales analytics dashboard ppt powerpoint presentation outline diagrams. The topics discussed in these slides are buzz marketing, process, strategy. This is a completely editable PowerPoint presentation and is available for immediate download. Download now and impress your audience.
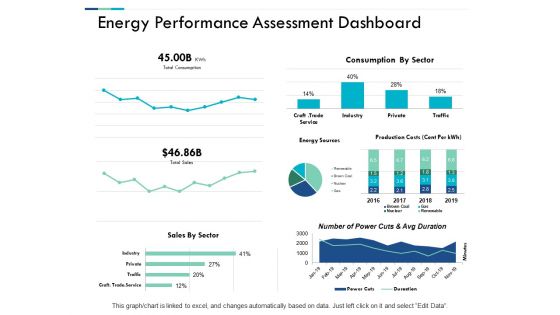
Energy Performance Assessment Dashboard Ppt PowerPoint Presentation Inspiration Background Designs
This is a energy performance assessment dashboard ppt powerpoint presentation inspiration background designs. The topics discussed in this diagram are finance, marketing, management, investment, analysis. This is a completely editable PowerPoint presentation, and is available for immediate download.

Supplier Performance Dashboard With Compensation Status Themes PDF
This slide showcases payment performance dashboard that can help organization to analyze the outstanding amount by different vendors and impose necessary restrictions in case of any delay. Its key components are amount paid early, total money paid, paid on time and paid late. Pitch your topic with ease and precision using this supplier performance dashboard with compensation status themes pdf. This layout presents information on supplier performance dashboard with compensation status. It is also available for immediate download and adjustment. So, changes can be made in the color, design, graphics or any other component to create a unique layout.

Employee Separation Dashboard With Exit Reason Rules PDF
This slide displays the dashboard showing the retention of employees in an organization with the types of exit , average tenure at exit, reasons and many more things. Pitch your topic with ease and precision using this Employee Separation Dashboard With Exit Reason Rules PDF This layout presents information on Employee Separation Dashboard With Exit Reason It is also available for immediate download and adjustment. So, changes can be made in the color, design, graphics or any other component to create a unique layout.
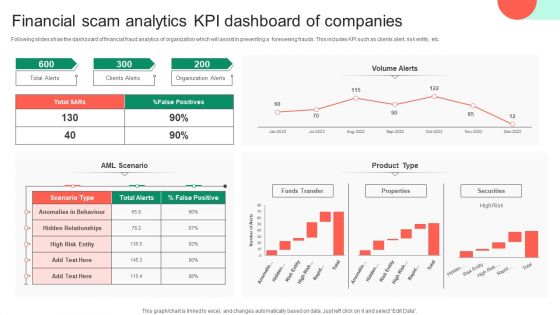
Financial Scam Analytics KPI Dashboard Of Companies Clipart PDF
Following slides show the dashboard of financial fraud analytics of organization which will assist in preventing a foreseeing frauds. This includes KPI such as clients alert, risk entity, etc. Pitch your topic with ease and precision using this Financial Scam Analytics KPI Dashboard Of Companies Clipart PDF. This layout presents information on Financial Scam Analytics, Kpi Dashboard Of Companies. It is also available for immediate download and adjustment. So, changes can be made in the color, design, graphics or any other component to create a unique layout.
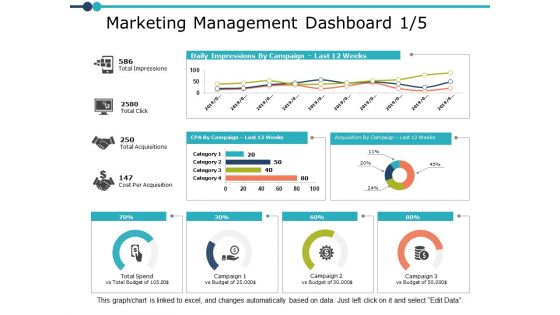
Marketing Management Dashboard Graph Ppt PowerPoint Presentation Infographic Template Portfolio
This is a marketing management dashboard graph ppt powerpoint presentation infographic template portfolio. The topics discussed in this diagram are marketing, business, management, planning, strategy This is a completely editable PowerPoint presentation, and is available for immediate download.

Customer Service Metrics Dashboard With Unresolved Calls Designs PDF
This slide showcases KPI dashboard for customer service that can help to identify the issue unresolved and response time by weekday. Its key elements are final call resolution, unresolved calls, avg response time and best day to call. Showcasing this set of slides titled Customer Service Metrics Dashboard With Unresolved Calls Designs PDF. The topics addressed in these templates are Customer Service, Metrics Dashboard, Unresolved Calls. All the content presented in this PPT design is completely editable. Download it and make adjustments in color, background, font etc. as per your unique business setting.

Leadership Strategy Dashboard To Track Employee Performance Brochure PDF
This slide depicts a strategic leadership dashboard which tracks employee performance as they assist in measuring the optimal functioning and successful coordination of team members within the organization. The major kpis are average result areas, scores, review by leader etc. Showcasing this set of slides titled Leadership Strategy Dashboard To Track Employee Performance Brochure PDF. The topics addressed in these templates are Leadership Strategy Dashboard, Track Employee Performance. All the content presented in this PPT design is completely editable. Download it and make adjustments in color, background, font etc. as per your unique business setting.

Stock Performance Dashboard For Supply Management Template PDF
This slide shows inventory performance dashboard for managing supply chain of organization. It include metrics such as inventory to sales, inventory turnover , inventory carrying cost etc. Showcasing this set of slides titled Stock Performance Dashboard For Supply Management Template PDF. The topics addressed in these templates are Inventory Carrying, Cost Segmentation, Inventory Accuracy. All the content presented in this PPT design is completely editable. Download it and make adjustments in color, background, font etc. as per your unique business setting.

Five Years Budget Projection And Analysis Dashboard Graphics PDF
This slide defines the dashboard for five years budget forecast and analysis for an organization. It includes information related to the expenses and revenue. Showcasing this set of slides titled Five Years Budget Projection And Analysis Dashboard Graphics PDF. The topics addressed in these templates are Revenues, Expenses, Budget. All the content presented in this PPT design is completely editable. Download it and make adjustments in color, background, font etc. as per your unique business setting.
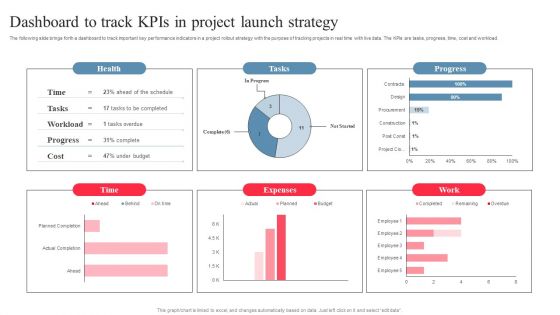
Dashboard To Track Kpis In Project Launch Strategy Pictures PDF
The following slide brings forth a dashboard to track important key performance indicators in a project rollout strategy with the purpose of tracking projects in real time with live data. The KPIs are tasks, progress, time, cost and workload. Showcasing this set of slides titled Dashboard To Track Kpis In Project Launch Strategy Pictures PDF. The topics addressed in these templates are Expenses, Project Launch Strategy, Dashboard To Track Kpis. All the content presented in this PPT design is completely editable. Download it and make adjustments in color, background, font etc. as per your unique business setting.
Business Operational Expenditure Monitoring Dashboard With Budget Analysis Icons PDF
This slide shows operating expenses OPEX monitoring dashboard with budget analysis assisting companies in evaluating funds useful until end of the year. It visually present the organizations operating expenses by time period and sector. Showcasing this set of slides titled Business Operational Expenditure Monitoring Dashboard With Budget Analysis Icons PDF. The topics addressed in these templates are Business Operational, Budget Analysis, Monitoring Dashboard. All the content presented in this PPT design is completely editable. Download it and make adjustments in color, background, font etc. as per your unique business setting.

IT Project Change Management Control Dashboard Topics PDF
This slide represents the dashboard for management of requests for change in IT teams project. It shows details related to open requests for changes status, their impact levels, risk levels, priority codes etc. Showcasing this set of slides titled IT Project Change Management Control Dashboard Topics PDF. The topics addressed in these templates are IT Project Change Management, Control Dashboard. All the content presented in this PPT design is completely editable. Download it and make adjustments in color, background, font etc. as per your unique business setting.
Scrum Task Project Management And Tracking Dashboard Elements PDF
The following slide showcases tracking dashboard for scrum project management. It includes information about weekly tracking, overall completion, start and end date, remaining days, sprints, status productivity, engaged users, etc. Showcasing this set of slides titled Scrum Task Project Management And Tracking Dashboard Elements PDF. The topics addressed in these templates are Tracking Dashboard, Scrum Task Project Management. All the content presented in this PPT design is completely editable. Download it and make adjustments in color, background, font etc. as per your unique business setting.
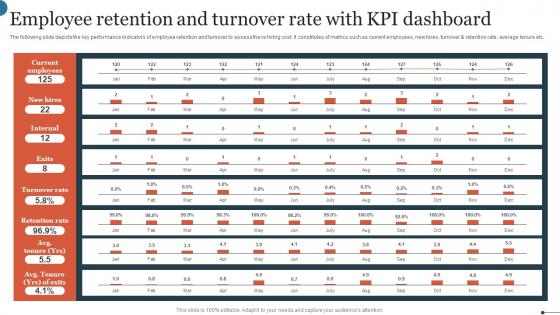
Employee Retention And Turnover Rate With KPI Dashboard Graphics Pdf
The following slide depicts the key performance indicators of employee retention and turnover to assess the re hiring cost. It constitutes of metrics such as current employees, new hires, turnover and retention rate, average tenure etc. Showcasing this set of slides titled Employee Retention And Turnover Rate With KPI Dashboard Graphics Pdf. The topics addressed in these templates are Current Employees, Turnover Rate, Retention Rate. All the content presented in this PPT design is completely editable. Download it and make adjustments in color, background, font etc. as per your unique business setting.
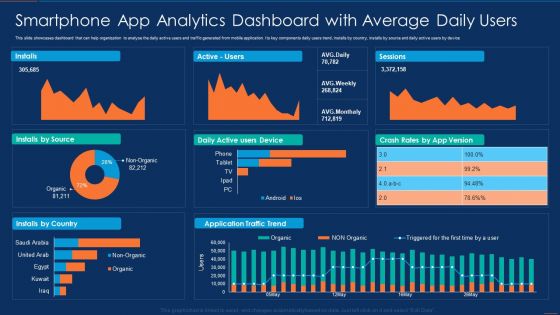
Smartphone App Analytics Dashboard With Average Daily Users Microsoft PDF
This slide showcases dashboard that can help organization to analyse the daily active users and traffic generated from mobile application. Its key components daily users trend, installs by country, installs by source and daily active users by device. Showcasing this set of slides titled Smartphone App Analytics Dashboard With Average Daily Users Microsoft PDF. The topics addressed in these templates are Smartphone App Analytics Dashboard With Average Daily Users. All the content presented in this PPT design is completely editable. Download it and make adjustments in color, background, font etc. as per your unique business setting.
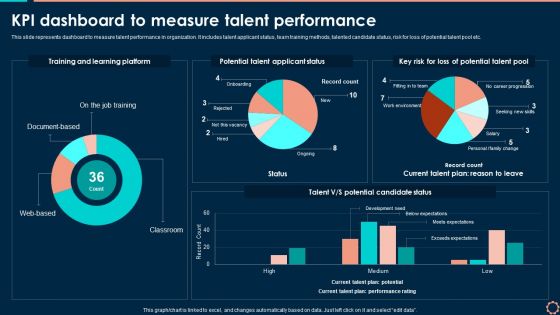
KPI Dashboard To Measure Talent Performance Slides PDF
This slide represents dashboard to measure talent performance in organization. It includes talent applicant status, team training methods, talented candidate status, risk for loss of potential talent pool etc. Get a simple yet stunning designed KPI Dashboard To Measure Talent Performance Slides PDF. It is the best one to establish the tone in your meetings. It is an excellent way to make your presentations highly effective. So, download this PPT today from Slidegeeks and see the positive impacts. Our easy to edit KPI Dashboard To Measure Talent Performance Slides PDF can be your go-to option for all upcoming conferences and meetings. So, what are you waiting for Grab this template today.
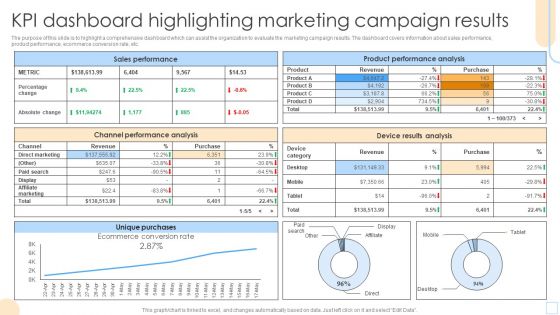
KPI Dashboard Highlighting Marketing Campaign Results Mockup PDF
The purpose of this slide is to highlight a comprehensive dashboard which can assist the organization to evaluate the marketing campaign results. The dashboard covers information about sales performance, product performance, ecommerce conversion rate, etc. Showcasing this set of slides titled KPI Dashboard Highlighting Marketing Campaign Results Mockup PDF. The topics addressed in these templates are Sales Performance, Product Performance Analysis. All the content presented in this PPT design is completely editable. Download it and make adjustments in color, background, font etc. as per your unique business setting.
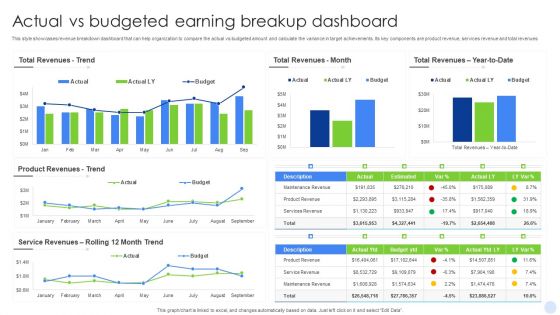
Actual Vs Budgeted Earning Breakup Dashboard Inspiration PDF
This style showcases revenue breakdown dashboard that can help organization to compare the actual vs budgeted amount and calculate the variance in target achievements. Its key components are product revenue, services revenue and total revenues. Showcasing this set of slides titled Actual Vs Budgeted Earning Breakup Dashboard Inspiration PDF. The topics addressed in these templates are Actual Vs Budgeted, Earning Breakup Dashboard. All the content presented in this PPT design is completely editable. Download it and make adjustments in color, background, font etc. as per your unique business setting.
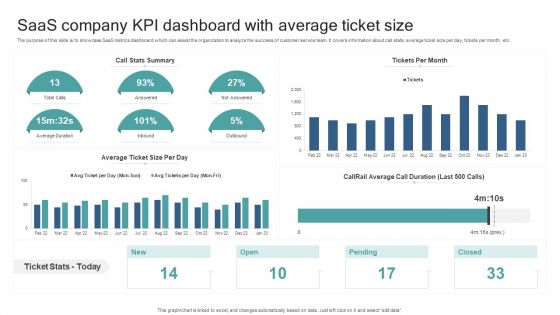
Saas Company KPI Dashboard With Average Ticket Size Sample PDF
The purpose of this slide is to showcase SaaS metrics dashboard which can assist the organization to analyze the success of customer service team. It covers information about call stats, average ticket size per day, tickets per month, etc. Showcasing this set of slides titled Saas Company KPI Dashboard With Average Ticket Size Sample PDF. The topics addressed in these templates are Saas Company Kpi, Dashboard, Average Ticket Size. All the content presented in this PPT design is completely editable. Download it and make adjustments in color, background, font etc. as per your unique business setting.
Cloud Integration Dashboard Ppt PowerPoint Presentation Background Designs Cpb
Presenting this set of slides with name cloud integration dashboard ppt powerpoint presentation background designs cpb. This is an editable Powerpoint four stages graphic that deals with topics like cloud integration dashboard to help convey your message better graphically. This product is a premium product available for immediate download and is 100 percent editable in Powerpoint. Download this now and use it in your presentations to impress your audience.
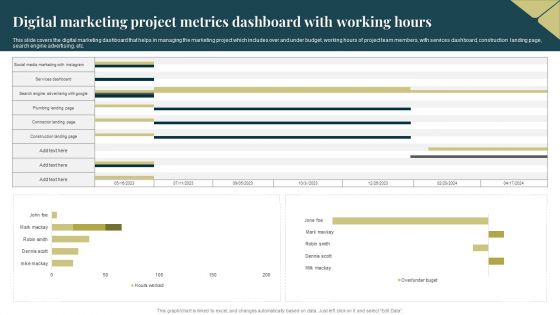
Digital Marketing Project Metrics Dashboard With Working Hours Download PDF
This slide covers the digital marketing dashboard that helps in managing the marketing project which includes over and under budget, working hours of project team members, with services dashboard, construction landing page, search engine advertising, etc. Showcasing this set of slides titled Digital Marketing Project Metrics Dashboard With Working Hours Download PDF. The topics addressed in these templates are Advertising, Social Media Marketing. All the content presented in this PPT design is completely editable. Download it and make adjustments in color, background, font etc. as per your unique business setting.
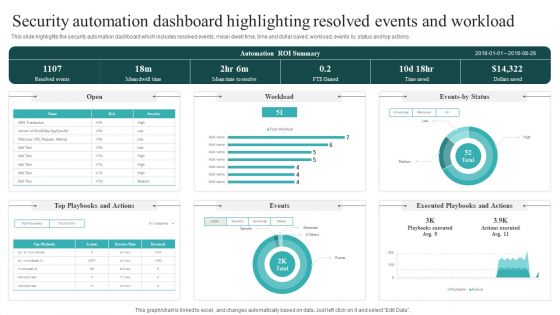
Security Automation Dashboard Highlighting Resolved Events And Workload Guidelines PDF
This slide highlights the security automation dashboard which includes resolved events, mean dwell time, time and dollar saved, workload, events by status and top actions. This Security Automation Dashboard Highlighting Resolved Events And Workload Guidelines PDF is perfect for any presentation, be it in front of clients or colleagues. It is a versatile and stylish solution for organizing your meetings. The Security Automation Dashboard Highlighting Resolved Events And Workload Guidelines PDF features a modern design for your presentation meetings. The adjustable and customizable slides provide unlimited possibilities for acing up your presentation. Slidegeeks has done all the homework before launching the product for you. So, don not wait, grab the presentation templates today.

Supplier Association Management Techniques Business Performance Dashboard Portrait PDF
This slide covers business and supplier relationship performance management dashboard including metrics such as cist reduction, procurement ROI, cost savings and cost avoidance etc. Deliver an awe inspiring pitch with this creative icons slide for supplier association management techniques introduction pdf bundle. Topics like supplier association management techniques supplier performance management kpi dashboards guidelines pdf can be discussed with this completely editable template. It is available for immediate download depending on the needs and requirements of the user.

Business Plan Review Dashboard With Task Details Sample PDF
The following slide showcases dashboard of plan review to track KPIs and other relevant details regarding business, department and projects. Key indicators covered are contracts, proposals, documents review, bid date, plan review, completion percentage and priority. Pitch your topic with ease and precision using this Business Plan Review Dashboard With Task Details Sample PDF. This layout presents information on Business Plan Review, Dashboard With Task Details. It is also available for immediate download and adjustment. So, changes can be made in the color, design, graphics or any other component to create a unique layout.

Enterprise Risk Management Credit Risk Management KPI Dashboard Introduction PDF
This slide represents the key metrics dashboard representing the management of credit risks by the organization. It includes details related to key risk indicators, exposure by credit rating, sectors etc. Present like a pro with Enterprise Risk Management Credit Risk Management KPI Dashboard Introduction PDF Create beautiful presentations together with your team, using our easy-to-use presentation slides. Share your ideas in real-time and make changes on the fly by downloading our templates. So whether youre in the office, on the go, or in a remote location, you can stay in sync with your team and present your ideas with confidence. With Slidegeeks presentation got a whole lot easier. Grab these presentations today.
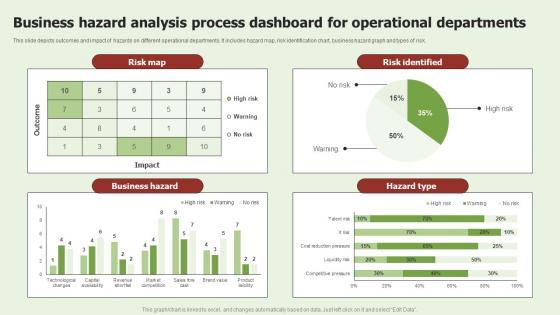
Business Hazard Analysis Process Dashboard For Operational Departments Microsoft Pdf
This slide depicts outcomes and impact of hazards on different operational departments. It includes hazard map, risk identification chart, business hazard graph and types of risk. Pitch your topic with ease and precision using this Business Hazard Analysis Process Dashboard For Operational Departments Microsoft Pdf. This layout presents information on Risk Map, Business Hazard, Hazard Type. It is also available for immediate download and adjustment. So, changes can be made in the color, design, graphics or any other component to create a unique layout.
Implementation KPI Dashboard Icon For Consumer Loyalty Program Inspiration PDF
Persuade your audience using this Implementation KPI Dashboard Icon For Consumer Loyalty Program Inspiration PDF. This PPT design covers Four stages, thus making it a great tool to use. It also caters to a variety of topics including Implementation KPI Dashboard, Consumer Loyalty Program. Download this PPT design now to present a convincing pitch that not only emphasizes the topic but also showcases your presentation skills.

Monthly Social Media Dashboard Ppt PowerPoint Presentation Background Designs
This is a monthly social media dashboard ppt powerpoint presentation background designs. This is a four stage process. The stages in this process are business, finance, marketing, strategy, analysis, success.
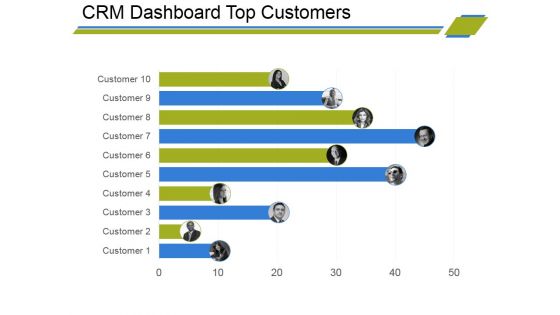
Crm Dashboard Top Customers Ppt PowerPoint Presentation Styles Designs
This is a crm dashboard top customers ppt powerpoint presentation styles designs. This is a ten stage process. The stages in this process are business, customer, finance, bar graph, marketing, strategy, analysis.
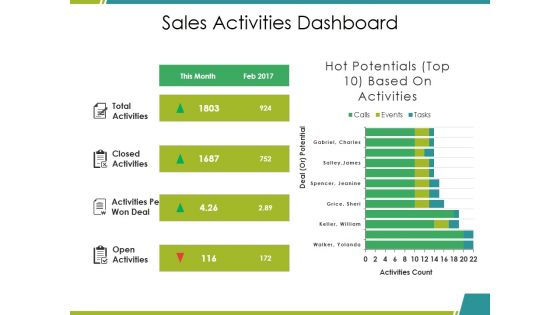
Sales Activities Dashboard Ppt PowerPoint Presentation Slides Designs Download
This is a sales activities dashboard ppt powerpoint presentation slides designs download. This is a four stage process. The stages in this process are total activities, closed activities, activities per won deal, open activities, activities count.

Sales Performance Dashboard Ppt PowerPoint Presentation Show Graphics Design
This is a sales performance dashboard ppt powerpoint presentation show graphics design. This is a two stage process. The stages in this process are sales comparison, sales by product category, rankings, customer satisfaction, revenue.
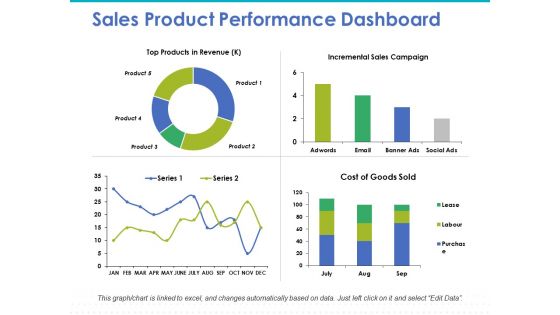
Sales Product Performance Dashboard Ppt PowerPoint Presentation Model Graphics Design
This is a sales product performance dashboard ppt powerpoint presentation model graphics design. This is a four stage process. The stages in this process are top products in revenue, incremental sales, cost of goods.

Project Management Dashboard Budget Ppt PowerPoint Presentation Slides Templates
This is a project management dashboard budget ppt powerpoint presentation slides templates. This is a two stage process. The stages in this process are finanace, management, strategy, analysis, marketing.

Hr Dashboard Template 2 Ppt PowerPoint Presentation File Grid
This is a hr dashboard template 2 ppt powerpoint presentation file grid. This is a four stage process. The stages in this process are turnover rate, direct compensation change, span of control, headcount flow, flow through rate.

 Home
Home