Energy Dashboard
Online Transformation With Agile Software Methodology IT Tracking Agile Project Management Activities Dashboard Introduction PDF
This slide provides information regarding essential Agile Project management activities tracking dashboard in terms of project health, tasks, progress, time, cost, workload. Deliver an awe inspiring pitch with this creative online transformation with agile software methodology it tracking agile project management activities dashboard introduction pdf bundle. Topics like health, tasks, progress, workload, cost can be discussed with this completely editable template. It is available for immediate download depending on the needs and requirements of the user.
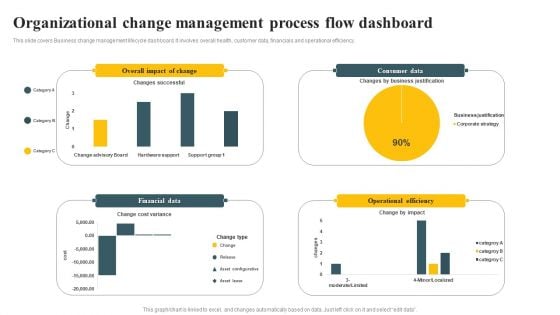
Organizational Change Management Process Flow Dashboard Ppt PowerPoint Presentation Diagram PDF
This slide covers Business change management lifecycle dashboard. It involves overall health, customer data, financials and operational efficiency. Pitch your topic with ease and precision using this Organizational Change Management Process Flow Dashboard Ppt PowerPoint Presentation Diagram PDF. This layout presents information on Financial Data, Operational Efficiency, Consumer Data. It is also available for immediate download and adjustment. So, changes can be made in the color, design, graphics or any other component to create a unique layout.
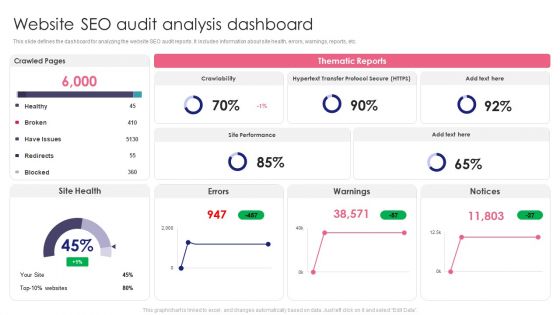
Guide To SEO Marketing Website SEO Audit Analysis Dashboard Download PDF
This slide defines the dashboard for analyzing the website SEO audit reports. It includes information about site health, errors, warnings, reports, etc. Find a pre-designed and impeccable Guide To SEO Marketing Website SEO Audit Analysis Dashboard Download PDF. The templates can ace your presentation without additional effort. You can download these easy-to-edit presentation templates to make your presentation stand out from others. So, what are you waiting for Download the template from Slidegeeks today and give a unique touch to your presentation.
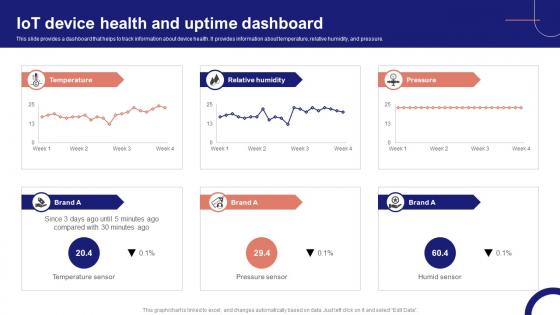
IoT Device Management Fundamentals IoT Device Health And Uptime Dashboard IoT Ss V
This slide provides a dashboard that helps to track information about device health. It provides information about temperature, relative humidity, and pressure. Take your projects to the next level with our ultimate collection of IoT Device Management Fundamentals IoT Device Health And Uptime Dashboard IoT SS V. Slidegeeks has designed a range of layouts that are perfect for representing task or activity duration, keeping track of all your deadlines at a glance. Tailor these designs to your exact needs and give them a truly corporate look with your own brand colors they will make your projects stand out from the rest
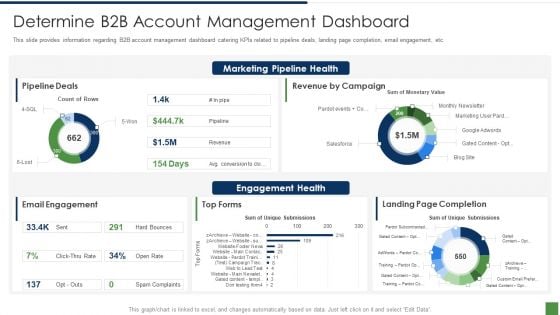
B2B Lead Generation Plan Determine B2b Account Management Dashboard Download PDF
This slide provides information regarding B2B account management dashboard catering KPIs related to pipeline deals, landing page completion, email engagement, etc. Deliver and pitch your topic in the best possible manner with this b2b lead generation plan determine b2b account management dashboard download pdf. Use them to share invaluable insights on marketing pipeline health, email engagement, pipeline deals, landing page completion and impress your audience. This template can be altered and modified as per your expectations. So, grab it now.
How To Implement Cloud Collaboration Cloud Dashboard For Tracking Project Sprints Microsoft PDF
The following slide depicts cloud dashboard for monitoring project sprints. It provides information about sprint blockers, resolved issues, under performers, sprint health, releases, sprint burndown, etc. Deliver an awe inspiring pitch with this creative How To Implement Cloud Collaboration Cloud Dashboard For Tracking Project Sprints Microsoft PDF bundle. Topics like Sprint Blockers, Resolved Issues, Sprint Burndown can be discussed with this completely editable template. It is available for immediate download depending on the needs and requirements of the user.
Agile Approach To Digital Transformation IT Tracking Agile Project Management Activities Dashboard Clipart PDF
This slide provides information regarding essential Agile Project management activities tracking dashboard in terms of project health, tasks, progress, time, cost, workload. Deliver and pitch your topic in the best possible manner with this Agile Approach To Digital Transformation IT Tracking Agile Project Management Activities Dashboard Clipart PDF Use them to share invaluable insights on Actual Completion, Planned Completion, Workload and impress your audience. This template can be altered and modified as per your expectations. So, grab it now.
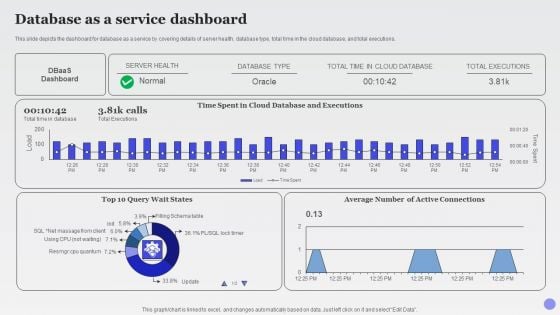
Database As A Service Dashboard Xaas Cloud Computing Models Ppt PowerPoint Presentation Infographics Graphics Design PDF
This slide depicts the dashboard for database as a service by covering details of server health, database type, total time in the cloud database, and total executions.Deliver an awe inspiring pitch with this creative Database As A Service Dashboard Xaas Cloud Computing Models Ppt PowerPoint Presentation Infographics Graphics Design PDF bundle. Topics like Database Executions, Active Connections, Total Executions can be discussed with this completely editable template. It is available for immediate download depending on the needs and requirements of the user.
Incorporation Of Experience Tracking Essential Retail Store Activities Dashboard Sample PDF
This slide provides details regarding the dashboard for tracking retail store activities in terms of sales, conversion rate, traffic, average transaction value, etc. Deliver an awe inspiring pitch with this creative incorporation of experience tracking essential retail store activities dashboard sample pdf bundle. Topics like actual, power, recommendations, low conversion can be discussed with this completely editable template. It is available for immediate download depending on the needs and requirements of the user.
Essential Retail Store Activities Tracking Dashboard Buyers Preference Management Playbook Background PDF
This slide provides details regarding the dashboard for tracking retail store activities in terms of sales, conversion rate, traffic, average transaction value, recommendations, etc. Deliver and pitch your topic in the best possible manner with this Essential Retail Store Activities Tracking Dashboard Buyers Preference Management Playbook Background PDF. Use them to share invaluable insights on Ensure Staff, Predicted Power, Traffic Today and impress your audience. This template can be altered and modified as per your expectations. So, grab it now.
Stress Management Dashboard With Wellness Tracking And Heart Rate Variability Ideas PDF
This slide highlights the stress management dashboard which showcases the perceived stress scale, heart rate, blood pressure, sleep quality and employee wellness. This Stress Management Dashboard With Wellness Tracking And Heart Rate Variability Ideas PDF is perfect for any presentation, be it in front of clients or colleagues. It is a versatile and stylish solution for organizing your meetings. The product features a modern design for your presentation meetings. The adjustable and customizable slides provide unlimited possibilities for acing up your presentation. Slidegeeks has done all the homework before launching the product for you. So, dont wait, grab the presentation templates today.
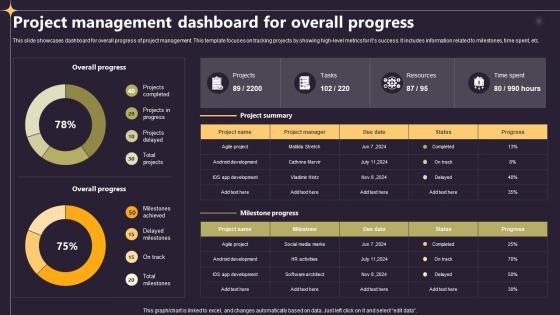
Closing A Project By Fulfilling Project Management Dashboard For Overall Progress PM SS V
This slide showcases dashboard for overall progress of project management. This template focuses on tracking projects by showing high-level metrics for its success. It includes information related to milestones, time spent, etc. This modern and well-arranged Closing A Project By Fulfilling Overview Of Planning Project In An Organisation PM SS V provides lots of creative possibilities. It is very simple to customize and edit with the Powerpoint Software. Just drag and drop your pictures into the shapes. All facets of this template can be edited with Powerpoint, no extra software is necessary. Add your own material, put your images in the places assigned for them, adjust the colors, and then you can show your slides to the world, with an animated slide included.
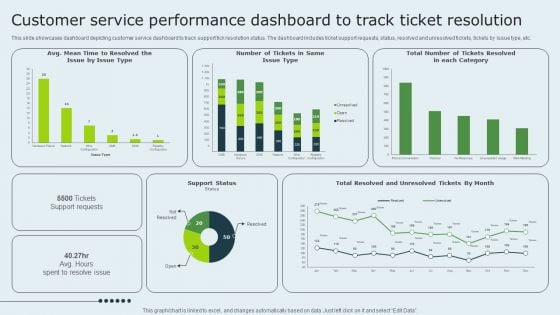
Enhancing Client Experience Customer Service Performance Dashboard To Track Ticket Template PDF
This slide showcases dashboard depicting customer service dashboard to track support tick resolution status. The dashboard includes ticket support requests, status, resolved and unresolved tickets, tickets by issue type, etc. This modern and well-arranged Enhancing Client Experience Customer Service Performance Dashboard To Track Ticket Template PDF provides lots of creative possibilities. It is very simple to customize and edit with the Powerpoint Software. Just drag and drop your pictures into the shapes. All facets of this template can be edited with Powerpoint, no extra software is necessary. Add your own material, put your images in the places assigned for them, adjust the colors, and then you can show your slides to the world, with an animated slide included.
Fitness Product Promotion Campaigns Sports Team And Brand Engagement Tracking Dashboard Designs PDF
This slide showcases sports team and brand engagement tracking dashboard. It provides details about owned channels, operated channels, images, videos, hashtags, image content, video content, etc. Do you have to make sure that everyone on your team knows about any specific topic I yes, then you should give Fitness Product Promotion Campaigns Sports Team And Brand Engagement Tracking Dashboard Designs PDF a try. Our experts have put a lot of knowledge and effort into creating this impeccable Fitness Product Promotion Campaigns Sports Team And Brand Engagement Tracking Dashboard Designs PDF. You can use this template for your upcoming presentations, as the slides are perfect to represent even the tiniest detail. You can download these templates from the Slidegeeks website and these are easy to edit. So grab these today
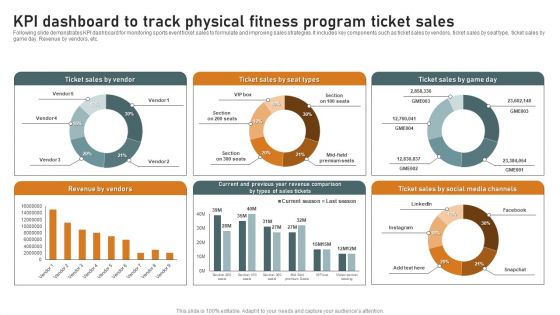
KPI Dashboard To Track Physical Fitness Program Ticket Sales Summary PDF
Following slide demonstrates KPI dashboard for monitoring sports event ticket sales to formulate and improving sales strategies. It includes key components such as ticket sales by vendors, ticket sales by seat type, ticket sales by game day. Revenue by vendors, etc. Showcasing this set of slides titled KPI Dashboard To Track Physical Fitness Program Ticket Sales Summary PDF. The topics addressed in these templates are Revenue By Vendors, Sales By Vendor, Social Media Channels. All the content presented in this PPT design is completely editable. Download it and make adjustments in color, background, font etc. as per your unique business setting.
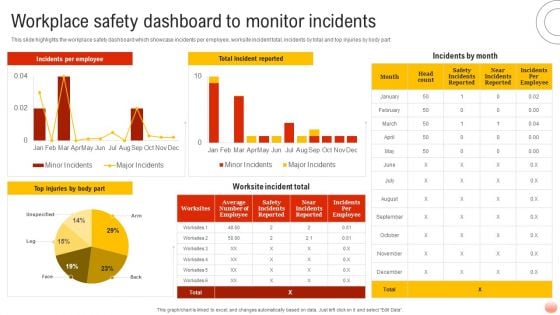
Best Practices For Occupational Health And Safety Workplace Safety Dashboard To Monitor Themes PDF
This slide highlights the workplace safety dashboard which showcase incidents per employee, worksite incident total, incidents by total and top injuries by body part. Whether you have daily or monthly meetings, a brilliant presentation is necessary. Best Practices For Occupational Health And Safety Workplace Safety Dashboard To Monitor Themes PDF can be your best option for delivering a presentation. Represent everything in detail using Best Practices For Occupational Health And Safety Workplace Safety Dashboard To Monitor Themes PDF and make yourself stand out in meetings. The template is versatile and follows a structure that will cater to your requirements. All the templates prepared by Slidegeeks are easy to download and edit. Our research experts have taken care of the corporate themes as well. So, give it a try and see the results.

Patient Health And Risk Key Performance Indicator Dashboard Ppt Infographic Template Summary PDF
The following slide highlights the patient health and safety key performance indicator dashboard illustrating admission by department, admission by cost, patient satisfaction, total patients, operations cost, patient density, total staff, waiting time, treatment satisfaction and treatment confidence. Pitch your topic with ease and precision using this Patient Health And Risk Key Performance Indicator Dashboard Ppt Infographic Template Summary PDF. This layout presents information on Admission By Department, Admission Vs Cost, Patient Satisfaction. It is also available for immediate download and adjustment. So, changes can be made in the color, design, graphics or any other component to create a unique layout.
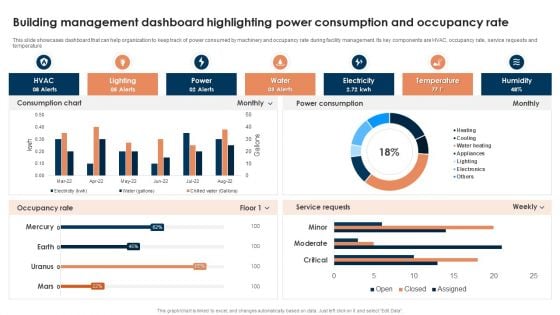
Building Management Dashboard Highlighting Power Consumption And Occupancy Rate Template PDF
This slide showcases dashboard that can help organization to keep track of power consumed by machinery and occupancy rate during facility management. Its key components are HVAC, occupancy rate, service requests and temperature. Pitch your topic with ease and precision using this Building Management Dashboard Highlighting Power Consumption And Occupancy Rate Template PDF. This layout presents information on Lighting, Power, Water, Electricity, Temperature. It is also available for immediate download and adjustment. So, changes can be made in the color, design, graphics or any other component to create a unique layout.
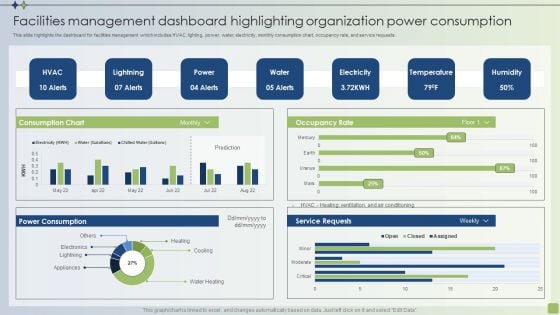
Strategic FM Services Facilities Management Dashboard Highlighting Organization Power Consumption Brochure PDF
This slide highlights the dashboard for facilities management which includes HVAC, lighting, power, water, electricity, monthly consumption chart, occupancy rate, and service requests. Make sure to capture your audiences attention in your business displays with our gratis customizable Strategic FM Services Facilities Management Dashboard Highlighting Organization Power Consumption Brochure PDF. These are great for business strategies, office conferences, capital raising or task suggestions. If you desire to acquire more customers for your tech business and ensure they stay satisfied, create your own sales presentation with these plain slides.

Employee Health And Risk Key Performance Indicator Dashboard Ppt Layouts Brochure PDF
The following slide highlights the employee health and safety key performance indicator dashboard illustrating narrow escapes, potential hazards, improvement opportunity, total incidents, health and safety learning, safety visit by management, ltir and trir, severe injuries and fatalities and safety goals. Showcasing this set of slides titled Employee Health And Risk Key Performance Indicator Dashboard Ppt Layouts Brochure PDF. The topics addressed in these templates are Narrow Escapes, Potential Hazards, Improvement Opportunity. All the content presented in this PPT design is completely editable. Download it and make adjustments in color, background, font etc. as per your unique business setting.
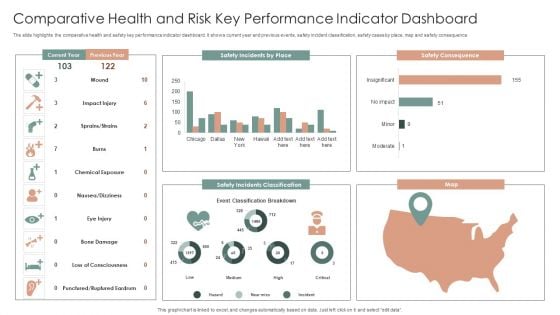
Comparative Health And Risk Key Performance Indicator Dashboard Ppt Portfolio Slide PDF
The slide highlights the comparative health and safety key performance indicator dashboard. It shows current year and previous events, safety incident classification, safety cases by place, map and safety consequence. Showcasing this set of slides titled Comparative Health And Risk Key Performance Indicator Dashboard Ppt Portfolio Slide PDF. The topics addressed in these templates are Safety Consequence, Safety Incidents Classification, Map. All the content presented in this PPT design is completely editable. Download it and make adjustments in color, background, font etc. as per your unique business setting.
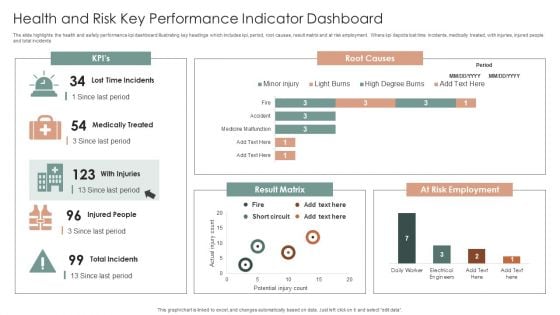
Health And Risk Key Performance Indicator Dashboard Ppt Layouts Graphics Design PDF
The slide highlights the health and safety performance kpi dashboard illustrating key headings which includes kpi, period, root causes, result matrix and at risk employment. Where kpi depicts lost time incidents, medically treated, with injuries, injured people and total incidents. Showcasing this set of slides titled Health And Risk Key Performance Indicator Dashboard Ppt Layouts Graphics Design PDF. The topics addressed in these templates are Root Causes, Result Matrix, At Risk Employment. All the content presented in this PPT design is completely editable. Download it and make adjustments in color, background, font etc. as per your unique business setting.
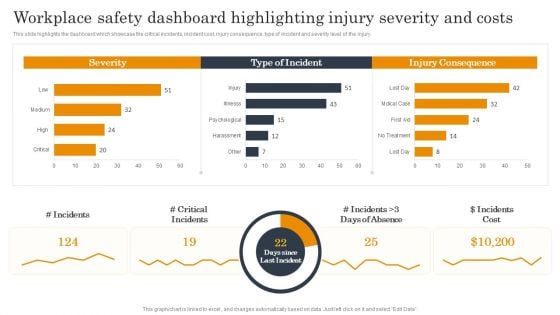
Employee Health And Safety Workplace Safety Dashboard Highlighting Injury Severity And Costs Sample PDF
This slide highlights the dashboard which showcase the critical incidents, incident cost, injury consequence, type of incident and severity level of the injury. Formulating a presentation can take up a lot of effort and time, so the content and message should always be the primary focus. The visuals of the PowerPoint can enhance the presenters message, so our Employee Health And Safety Workplace Safety Dashboard Highlighting Injury Severity And Costs Sample PDF was created to help save time. Instead of worrying about the design, the presenter can concentrate on the message while our designers work on creating the ideal templates for whatever situation is needed. Slidegeeks has experts for everything from amazing designs to valuable content, we have put everything into Employee Health And Safety Workplace Safety Dashboard Highlighting Injury Severity And Costs Sample PDF.
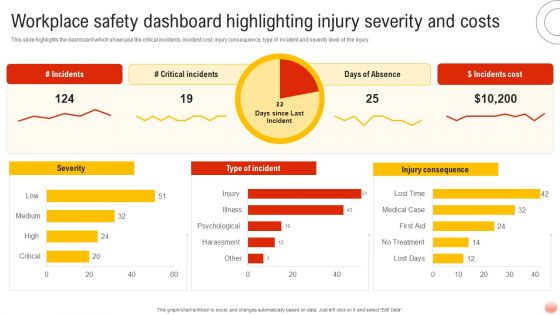
Best Practices For Occupational Health And Safety Workplace Safety Dashboard Highlighting Introduction PDF
This slide highlights the dashboard which showcase the critical incidents, incident cost, injury consequence, type of incident and severity level of the injury. Do you have an important presentation coming up Are you looking for something that will make your presentation stand out from the rest Look no further than Best Practices For Occupational Health And Safety Workplace Safety Dashboard Highlighting Introduction PDF. With our professional designs, you can trust that your presentation will pop and make delivering it a smooth process. And with Slidegeeks, you can trust that your presentation will be unique and memorable. So why wait Gra Best Practices For Occupational Health And Safety Workplace Safety Dashboard Highlighting Introduction PDF today and make your presentation stand out from the rest.
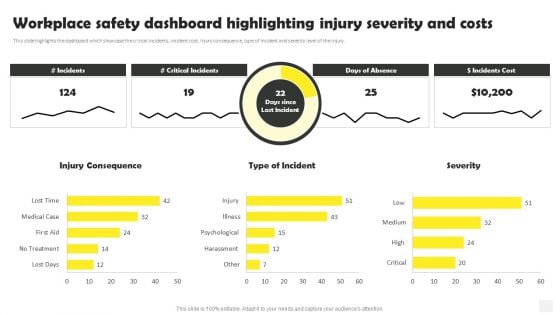
Occupational Health And Safety At Workplace Workplace Safety Dashboard Highlighting Formats PDF
This slide highlights the dashboard which showcase the critical incidents, incident cost, injury consequence, type of incident and severity level of the injury. Do you have to make sure that everyone on your team knows about any specific topic I yes, then you should give Occupational Health And Safety At Workplace Workplace Safety Dashboard Highlighting Formats PDF a try. Our experts have put a lot of knowledge and effort into creating this impeccable Occupational Health And Safety At Workplace Workplace Safety Dashboard Highlighting Formats PDF. You can use this template for your upcoming presentations, as the slides are perfect to represent even the tiniest detail. You can download these templates from the Slidegeeks website and these are easy to edit. So grab these today.
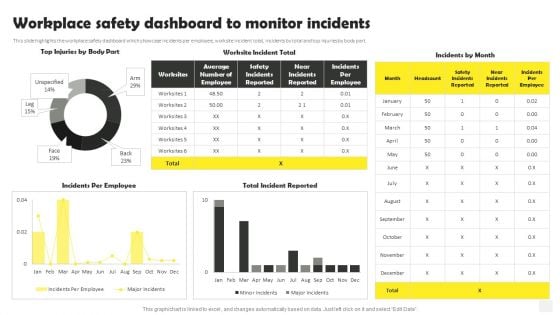
Occupational Health And Safety At Workplace Workplace Safety Dashboard To Monitor Incidents Inspiration PDF
This slide highlights the workplace safety dashboard which showcase incidents per employee, worksite incident total, incidents by total and top injuries by body part. Get a simple yet stunning designed Occupational Health And Safety At Workplace Workplace Safety Dashboard To Monitor Incidents Inspiration PDF. It is the best one to establish the tone in your meetings. It is an excellent way to make your presentations highly effective. So, download this PPT today from Slidegeeks and see the positive impacts. Our easy to edit Occupational Health And Safety At Workplace Workplace Safety Dashboard To Monitor Incidents Inspiration PDF can be your go to option for all upcoming conferences and meetings. So, what are you waiting for Grab this template today.
Oil And Gas Well Summary Dashboard Ppt Icon Graphics Tutorials PDF
Deliver an awe-inspiring pitch with this creative oil and gas well summary dashboard ppt icon graphics tutorials pdf. bundle. Topics like gross vs net well count, downtime well count by reason, wells count by purpose can be discussed with this completely editable template. It is available for immediate download depending on the needs and requirements of the user.
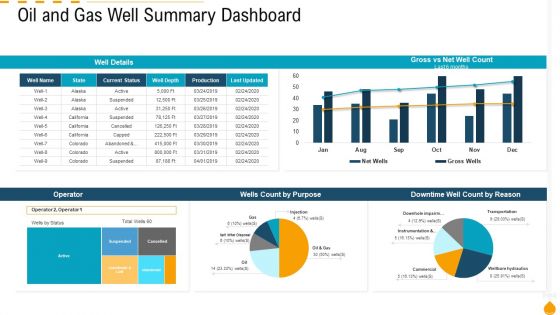
Oil And Gas Well Summary Dashboard Ppt PowerPoint Presentation Summary Graphics Design PDF
Deliver an awe inspiring pitch with this creative oil and gas well summary dashboard ppt powerpoint presentation summary graphics design pdf bundle. Topics like wells count by purpose, operator, downtime well count by reason can be discussed with this completely editable template. It is available for immediate download depending on the needs and requirements of the user.
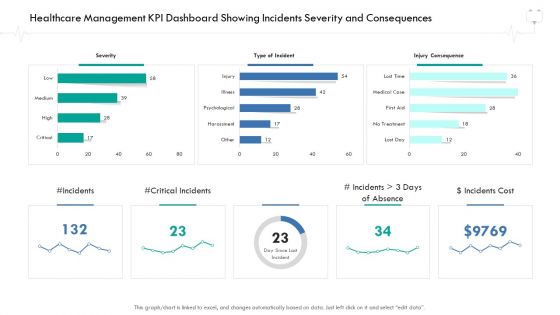
Wellness Management Healthcare Management KPI Dashboard Showing Incidents Severity And Consequences Guidelines PDF
Deliver and pitch your topic in the best possible manner with this wellness management healthcare management kpi dashboard showing incidents severity and consequences guidelines pdf. Use them to share invaluable insights on severity, type of incident, injury consequence and impress your audience. This template can be altered and modified as per your expectations. So, grab it now.
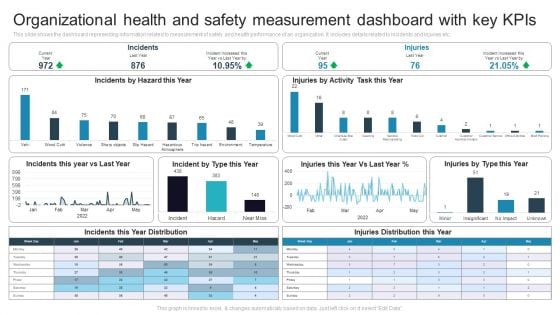
Organizational Health And Safety Measurement Dashboard With Key Kpis Microsoft PDF
This slide shows the dashboard representing information related to measurement of safety and health performance of an organization. It includes details related to incidents and injuries etc. Showcasing this set of slides titled Organizational Health And Safety Measurement Dashboard With Key Kpis Microsoft PDF. The topics addressed in these templates are Hazard This Year, Injuries By Activity, Task This Year. All the content presented in this PPT design is completely editable. Download it and make adjustments in color, background, font etc. as per your unique business setting.
Customer Deal Tracking In Sales Pipeline Dashboard Managing Sales Pipeline Health Formats PDF
This slide covers information regarding dashboard for tracking various customer deals in sales pipeline. Take your projects to the next level with our ultimate collection of Customer Deal Tracking In Sales Pipeline Dashboard Managing Sales Pipeline Health Formats PDF. Slidegeeks has designed a range of layouts that are perfect for representing task or activity duration, keeping track of all your deadlines at a glance. Tailor these designs to your exact needs and give them a truly corporate look with your own brand colors they well make your projects stand out from the rest.
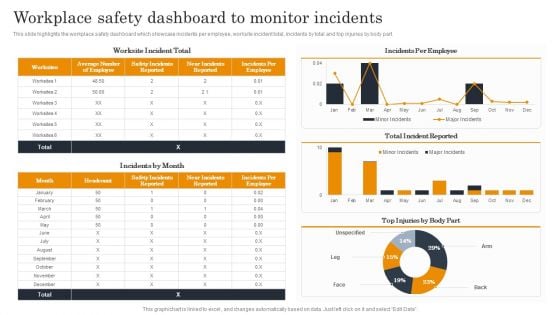
Employee Health And Safety Workplace Safety Dashboard To Monitor Incidents Ideas PDF
This slide highlights the workplace safety dashboard which showcase incidents per employee, worksite incident total, incidents by total and top injuries by body part. If your project calls for a presentation, then Slidegeeks is your go-to partner because we have professionally designed, easy-to-edit templates that are perfect for any presentation. After downloading, you can easily edit Employee Health And Safety Workplace Safety Dashboard To Monitor Incidents Ideas PDF and make the changes accordingly. You can rearrange slides or fill them with different images. Check out all the handy templates.
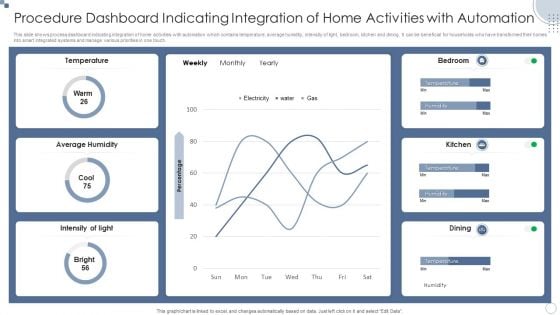
Procedure Dashboard Indicating Integration Of Home Activities With Automation Ppt PowerPoint Presentation File Files PDF
This slide shows process dashboard indicating integration of home activities with automation which contains temperature, average humidity, intensity of light, bedroom, kitchen and dining. It can be beneficial for households who have transformed their homes into smart integrated systems and manage various priorities in one touch.Showcasing this set of slides titled Procedure Dashboard Indicating Integration Of Home Activities With Automation Ppt PowerPoint Presentation File Files PDF. The topics addressed in these templates are Average Humidity, Temperature, Intensity Light. All the content presented in this PPT design is completely editable. Download it and make adjustments in color, background, font etc. as per your unique business setting.
Virtual WAN Architecture SD WAN Network Performance Tracking Dashboard Designs PDF
This slide represents the SD-WAN network performance tracking dashboard. The purpose of this slide is to demonstrate the performance of the SD-WAN network. The main components include control status, site health, transport interface distribution, WAN edge inventory, edge health, and so on. Crafting an eye-catching presentation has never been more straightforward. Let your presentation shine with this tasteful yet straightforward Virtual WAN Architecture SD WAN Network Performance Tracking Dashboard Designs PDF template. It offers a minimalistic and classy look that is great for making a statement. The colors have been employed intelligently to add a bit of playfulness while still remaining professional. Construct the ideal Virtual WAN Architecture SD WAN Network Performance Tracking Dashboard Designs PDF that effortlessly grabs the attention of your audience Begin now and be certain to wow your customers.
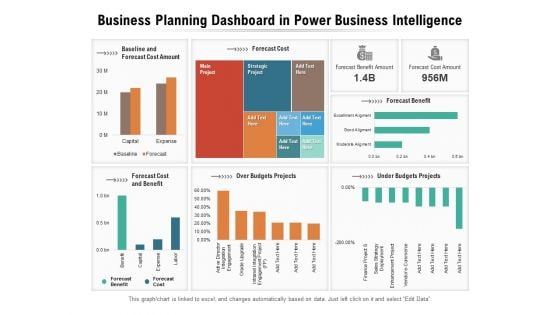
Business Planning Dashboard In Power Business Intelligence Ppt PowerPoint Presentation File Format Ideas PDF
Presenting this set of slides with name business planning dashboard in power business intelligence ppt powerpoint presentation file format ideas pdf. The topics discussed in these slides are cost, budgets, finance. This is a completely editable PowerPoint presentation and is available for immediate download. Download now and impress your audience.
B2B Marketing Content Administration Playbook Sales Management Activities Tracking Dashboard Brochure PDF
This slide provides information regarding sales meeting plan playing vital role in sales operation effectiveness, motivating sales team and improve overall productivity.Presenting b2b marketing content administration playbook sales management activities tracking dashboard brochure pdf to provide visual cues and insights. Share and navigate important information on three stages that need your due attention. This template can be used to pitch topics like sales management activities tracking dashboard In addtion, this PPT design contains high resolution images, graphics, etc, that are easily editable and available for immediate download.
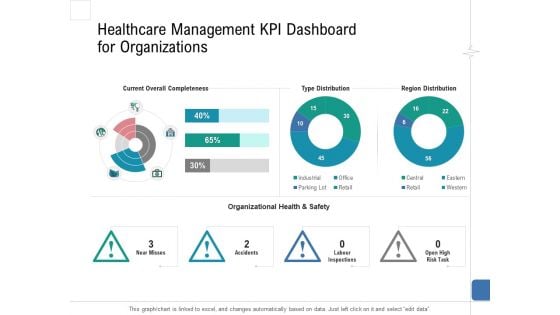
Health Centre Management Business Plan Healthcare Management KPI Dashboard For Organizations Diagrams PDF
Deliver and pitch your topic in the best possible manner with this health centre management business plan healthcare management kpi dashboard for organizations diagrams pdf. Use them to share invaluable insights on current overall completeness, type distribution, region distribution, organizational health and safety and impress your audience. This template can be altered and modified as per your expectations. So, grab it now.
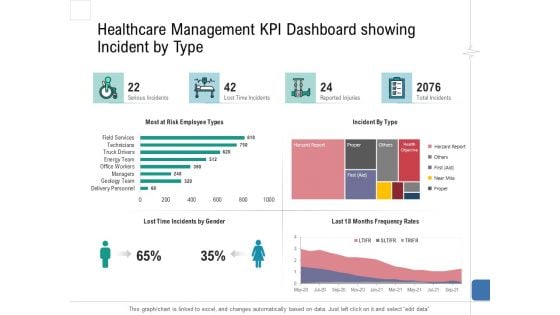
Health Centre Management Business Plan Healthcare Management KPI Dashboard Showing Incident By Type Portrait PDF
Deliver an awe inspiring pitch with this creative health centre management business plan healthcare management kpi dashboard showing incident by type portrait pdf bundle. Topics like serious incidents, lost time incidents, reported injuries, total incidents can be discussed with this completely editable template. It is available for immediate download depending on the needs and requirements of the user.
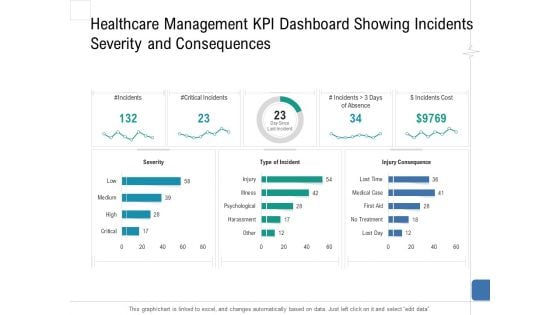
Health Centre Management Business Plan Healthcare Management KPI Dashboard Showing Incidents Severity And Consequences Structure PDF
Deliver and pitch your topic in the best possible manner with this health centre management business plan healthcare management kpi dashboard showing incidents severity and consequences structure pdf. Use them to share invaluable insights on severity, type of incident, injury consequence and impress your audience. This template can be altered and modified as per your expectations. So, grab it now.
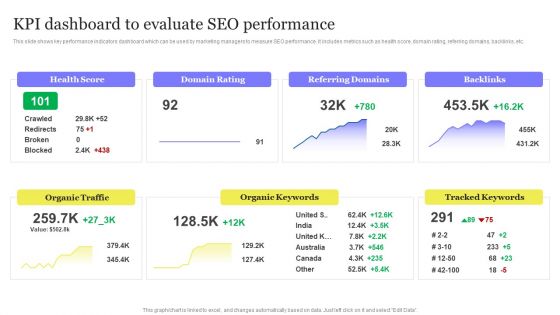
Enhancing Digital Visibility Using SEO Content Strategy KPI Dashboard To Evaluate SEO Performance Diagrams PDF
This slide shows key performance indicators dashboard which can be used by marketing managers to measure SEO performance. It includes metrics such as health score, domain rating, referring domains, backlinks, etc. This Enhancing Digital Visibility Using SEO Content Strategy KPI Dashboard To Evaluate SEO Performance Diagrams PDF is perfect for any presentation, be it in front of clients or colleagues. It is a versatile and stylish solution for organizing your meetings. The Enhancing Digital Visibility Using SEO Content Strategy KPI Dashboard To Evaluate SEO Performance Diagrams PDF features a modern design for your presentation meetings. The adjustable and customizable slides provide unlimited possibilities for acing up your presentation. Slidegeeks has done all the homework before launching the product for you. So, do not wait, grab the presentation templates today
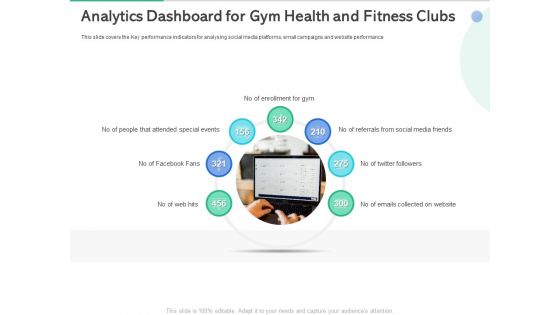
Market Overview Fitness Industry Analytics Dashboard For Gym Health And Fitness Clubs Guidelines PDF
This slide covers the Key performance indicators for analysing social media platforms, email campaigns and website performance. This is a market overview fitness industry analytics dashboard for gym health and fitness clubs guidelines pdf template with various stages. Focus and dispense information on seven stages using this creative set, that comes with editable features. It contains large content boxes to add your information on topics like attended special events, enrollment for gym, social media friends. You can also showcase facts, figures, and other relevant content using this PPT layout. Grab it now.
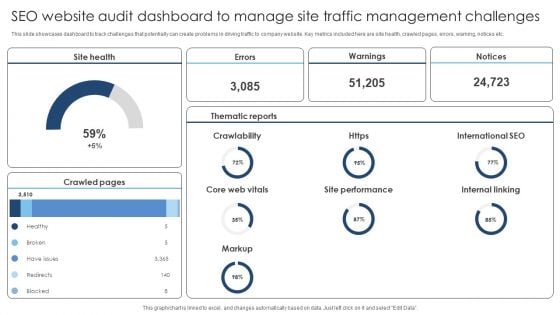
SEO Website Audit Dashboard To Manage Site Traffic Management Challenges Summary PDF
This slide showcases dashboard to track challenges that potentially can create problems in driving traffic to company website. Key metrics included here are site health, crawled pages, errors, warning, notices etc. Pitch your topic with ease and precision using this SEO Website Audit Dashboard To Manage Site Traffic Management Challenges Summary PDF. This layout presents information on Site Health, Errors, Warnings. It is also available for immediate download and adjustment. So, changes can be made in the color, design, graphics or any other component to create a unique layout.
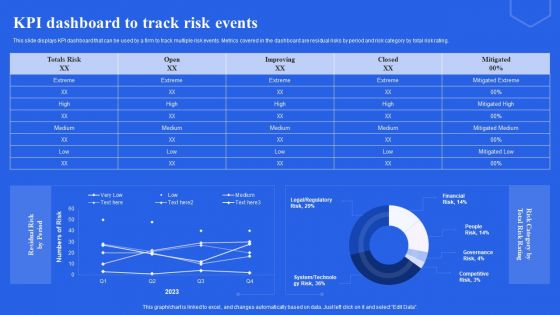
KPI Dashboard To Track Risk Events Ppt Infographic Template Layout Ideas PDF
This slide displays KPI dashboard that can be used by a firm to track multiple risk events. Metrics covered in the dashboard are residual risks by period and risk category by total risk rating. Are you in need of a template that can accommodate all of your creative concepts This one is crafted professionally and can be altered to fit any style. Use it with Google Slides or PowerPoint. Include striking photographs, symbols, depictions, and other visuals. Fill, move around, or remove text boxes as desired. Test out color palettes and font mixtures. Edit and save your work, or work with colleagues. Download KPI Dashboard To Track Risk Events Ppt Infographic Template Layout Ideas PDF and observe how to make your presentation outstanding. Give an impeccable presentation to your group and make your presentation unforgettable.
Performance Tracking Dashboard For E Marketplace Platform Ppt Summary Gridlines PDF
This slide displays dashboard to track average sales of E-marketplace for organization to formulate appropriate strategies. It includes KPIs such as health, orders, dispatch status, overdue, etc. Showcasing this set of slides titled Performance Tracking Dashboard For E Marketplace Platform Ppt Summary Gridlines PDF. The topics addressed in these templates are Total Scale, Dispatch Status, Account, Health, Orders. All the content presented in this PPT design is completely editable. Download it and make adjustments in color, background, font etc. as per your unique business setting.
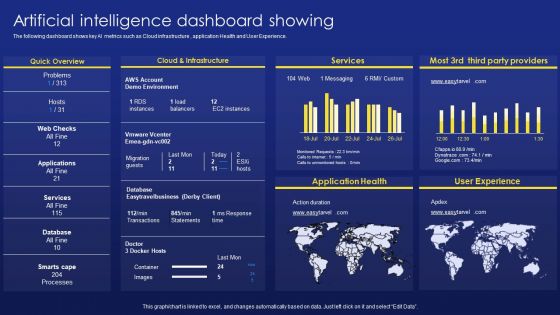
Deployment Procedure Of Hyper Automation Artificial Intelligence Dashboard Showing Pictures PDF
The following dashboard shows key AI metrics such as Cloud infrastructure , application Health and User Experience. Here you can discover an assortment of the finest PowerPoint and Google Slides templates. With these templates, you can create presentations for a variety of purposes while simultaneously providing your audience with an eye catching visual experience. Download Deployment Procedure Of Hyper Automation Artificial Intelligence Dashboard Showing Pictures PDF to deliver an impeccable presentation. These templates will make your job of preparing presentations much quicker, yet still, maintain a high level of quality. Slidegeeks has experienced researchers who prepare these templates and write high quality content for you. Later on, you can personalize the content by editing the Deployment Procedure Of Hyper Automation Artificial Intelligence Dashboard Showing Pictures PDF.
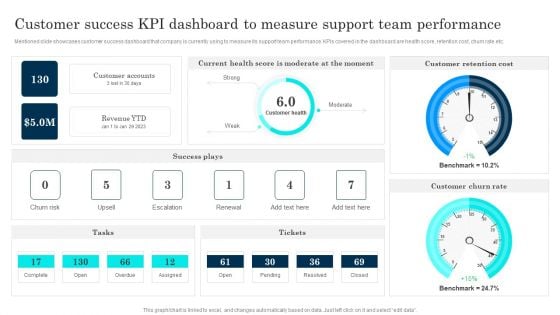
Customer Journey Enhancement Playbook Customer Success KPI Dashboard To Measure Portrait PDF
Mentioned slide showcases customer success dashboard that company is currently using to measure its support team performance. KPIs covered in the dashboard are health score, retention cost, churn rate etc. Slidegeeks is here to make your presentations a breeze with Customer Journey Enhancement Playbook Customer Success KPI Dashboard To Measure Portrait PDF With our easy-to-use and customizable templates, you can focus on delivering your ideas rather than worrying about formatting. With a variety of designs to choose from, youre sure to find one that suits your needs. And with animations and unique photos, illustrations, and fonts, you can make your presentation pop. So whether youre giving a sales pitch or presenting to the board, make sure to check out Slidegeeks first.
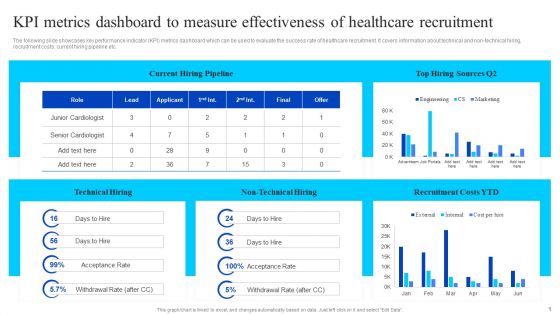
KPI Metrics Dashboard To Measure Effectiveness Of Healthcare Recruitment Microsoft PDF
The following slide showcases key performance indicator KPI metrics dashboard which can be used to evaluate the success rate of healthcare recruitment. It covers information about technical and non-technical hiring, recruitment costs, current hiring pipeline etc. Whether you have daily or monthly meetings, a brilliant presentation is necessary. KPI Metrics Dashboard To Measure Effectiveness Of Healthcare Recruitment Microsoft PDF can be your best option for delivering a presentation. Represent everything in detail using KPI Metrics Dashboard To Measure Effectiveness Of Healthcare Recruitment Microsoft PDF and make yourself stand out in meetings. The template is versatile and follows a structure that will cater to your requirements. All the templates prepared by Slidegeeks are easy to download and edit. Our research experts have taken care of the corporate themes as well. So, give it a try and see the results.
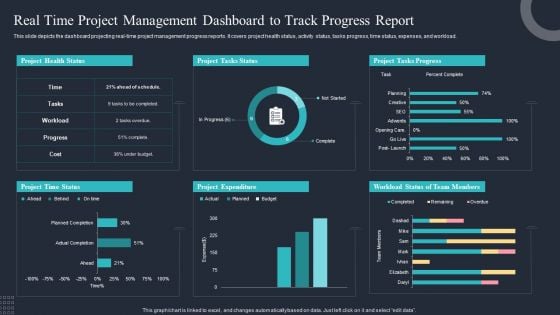
Real Time Project Management Dashboard To Track Progress Report Clipart PDF
This slide depicts the dashboard projecting real-time project management progress reports. It covers project health status, activity status, tasks progress, time status, expenses, and workload. Showcasing this set of slides titled Real Time Project Management Dashboard To Track Progress Report Clipart PDF. The topics addressed in these templates are Project Health Status, Project Tasks Status, Project Tasks Progress. All the content presented in this PPT design is completely editable. Download it and make adjustments in color, background, font etc. as per your unique business setting.
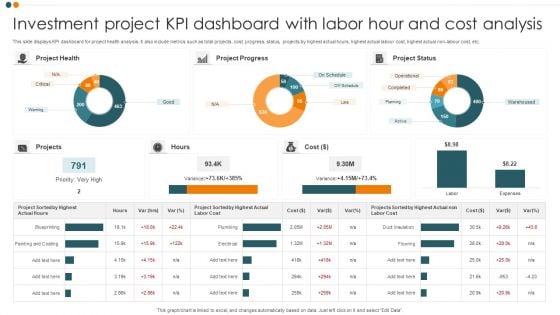
Investment Project KPI Dashboard With Labor Hour And Cost Analysis Portrait PDF
This slide displays KPI dashboard for project health analysis. It also include metrics such as total projects, cost, progress, status, projects by highest actual hours, highest actual labour cost, highest actual non-labour cost, etc. Pitch your topic with ease and precision using this Investment Project KPI Dashboard With Labor Hour And Cost Analysis Portrait PDF. This layout presents information on Project Health, Project Progress, Project Status. It is also available for immediate download and adjustment. So, changes can be made in the color, design, graphics or any other component to create a unique layout.
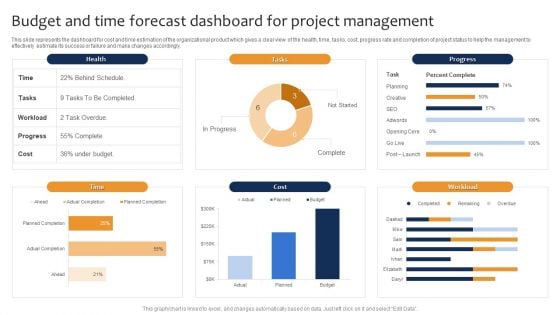
Budget And Time Forecast Dashboard For Project Management Ppt Pictures Format Ideas PDF
This slide represents the dashboard for cost and time estimation of the organizational product which gives a clear view of the health, time, tasks, cost, progress rate and completion of project status to help the management to effectively estimate its success or failure and make changes accordingly. Pitch your topic with ease and precision using this Budget And Time Forecast Dashboard For Project Management Ppt Pictures Format Ideas PDF. This layout presents information on Health, Progress, Cost, Workload. It is also available for immediate download and adjustment. So, changes can be made in the color, design, graphics or any other component to create a unique layout.
Cloud Dashboard For Tracking Project Sprints Ppt PowerPoint Presentation File Layouts PDF
The following slide depicts cloud dashboard for monitoring project sprints. It provides information about sprint blockers, resolved issues, under performers, sprint health, releases, sprint burndown, etc. If you are looking for a format to display your unique thoughts, then the professionally designed Cloud Dashboard For Tracking Project Sprints Ppt PowerPoint Presentation File Layouts PDF is the one for you. You can use it as a Google Slides template or a PowerPoint template. Incorporate impressive visuals, symbols, images, and other charts. Modify or reorganize the text boxes as you desire. Experiment with shade schemes and font pairings. Alter, share or cooperate with other people on your work. Download Cloud Dashboard For Tracking Project Sprints Ppt PowerPoint Presentation File Layouts PDF and find out how to give a successful presentation. Present a perfect display to your team and make your presentation unforgettable.
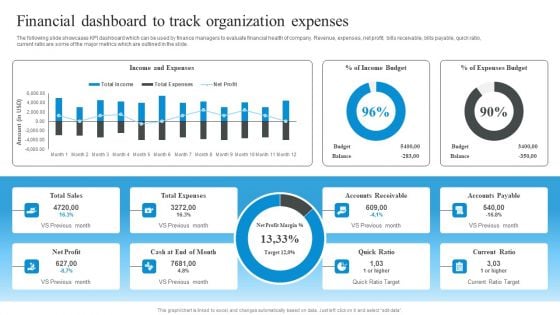
Market Evaluation Of IT Industry Financial Dashboard To Track Organization Expenses Clipart PDF
The following slide showcases KPI dashboard which can be used by finance managers to evaluate financial health of company. Revenue, expenses, net profit, bills receivable, bills payable, quick ratio, current ratio are some of the major metrics which are outlined in the slide. Do you have an important presentation coming up Are you looking for something that will make your presentation stand out from the rest Look no further than Market Evaluation Of IT Industry Financial Dashboard To Track Organization Expenses Clipart PDF. With our professional designs, you can trust that your presentation will pop and make delivering it a smooth process. And with Slidegeeks, you can trust that your presentation will be unique and memorable. So why wait Grab Market Evaluation Of IT Industry Financial Dashboard To Track Organization Expenses Clipart PDF today and make your presentation stand out from the rest.
Leveraging Cloud For Project And Team Coordination Cloud Dashboard For Tracking Pictures PDF
The following slide depicts cloud dashboard for monitoring project sprints. It provides information about sprint blockers, resolved issues, under performers, sprint health, releases, sprint burndown, etc. Create an editable Leveraging Cloud For Project And Team Coordination Cloud Dashboard For Tracking Pictures PDF that communicates your idea and engages your audience. Whether you are presenting a business or an educational presentation, pre designed presentation templates help save time. Leveraging Cloud For Project And Team Coordination Cloud Dashboard For Tracking Pictures PDF is highly customizable and very easy to edit, covering many different styles from creative to business presentations. Slidegeeks has creative team members who have crafted amazing templates. So, go and get them without any delay.
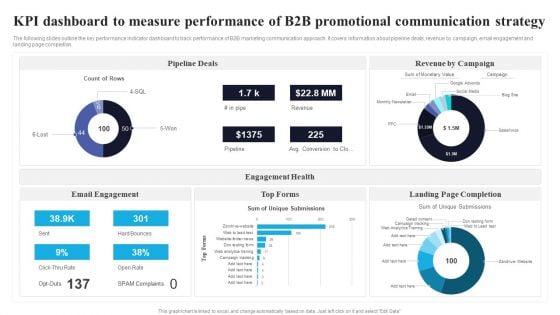
KPI Dashboard To Measure Performance Of B2B Promotional Communication Strategy Mockup PDF
The following slides outline the key performance indicator dashboard to track performance of B2B marketing communication approach. It covers information about pipeline deals, revenue by campaign, email engagement and landing page completion. Pitch your topic with ease and precision using this KPI Dashboard To Measure Performance Of B2B Promotional Communication Strategy Mockup PDF. This layout presents information on Pipeline Deals, Engagement Health, Email Engagement. It is also available for immediate download and adjustment. So, changes can be made in the color, design, graphics or any other component to create a unique layout.
Deploying Cyber Security Incident Response Administration Enterprise Cyber Risk Management Dashboard Icons PDF
This slide represents the key metrics dashboard representing details related to management of cyber security incidents by an enterprise. It includes key performance indicators such as risk analysis progress, risk rating breakdown etc. Whether you have daily or monthly meetings, a brilliant presentation is necessary. Deploying Cyber Security Incident Response Administration Enterprise Cyber Risk Management Dashboard Icons PDF can be your best option for delivering a presentation. Represent everything in detail using Deploying Cyber Security Incident Response Administration Enterprise Cyber Risk Management Dashboard Icons PDF and make yourself stand out in meetings. The template is versatile and follows a structure that will cater to your requirements. All the templates prepared by Slidegeeks are easy to download and edit. Our research experts have taken care of the corporate themes as well. So, give it a try and see the results.
Software Implementation Technique Software Implementation Project Progress Tracking Dashboard Introduction PDF
This slide represents the dashboard to track the progress of software implementation project. It includes details related to health, tasks, project, time, cost and workload of software implementation project. The Software Implementation Technique Software Implementation Project Progress Tracking Dashboard Introduction PDF is a compilation of the most recent design trends as a series of slides. It is suitable for any subject or industry presentation, containing attractive visuals and photo spots for businesses to clearly express their messages. This template contains a variety of slides for the user to input data, such as structures to contrast two elements, bullet points, and slides for written information. Slidegeeks is prepared to create an impression.
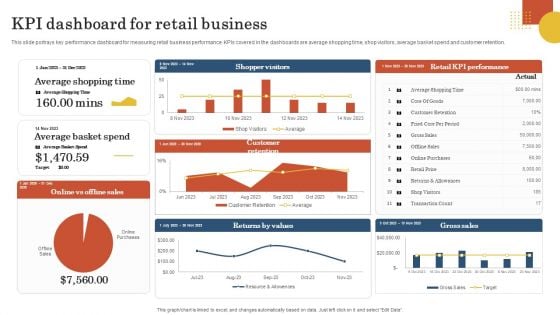
Retail Business Operation Management To Optimize Customer Experience KPI Dashboard For Retail Business Download PDF
This slide portrays key performance dashboard for measuring retail business performance. KPIs covered in the dashboards are average shopping time, shop visitors, average basket spend and customer retention. Are you in need of a template that can accommodate all of your creative concepts This one is crafted professionally and can be altered to fit any style. Use it with Google Slides or PowerPoint. Include striking photographs, symbols, depictions, and other visuals. Fill, move around, or remove text boxes as desired. Test out color palettes and font mixtures. Edit and save your work, or work with colleagues. Download Retail Business Operation Management To Optimize Customer Experience KPI Dashboard For Retail Business Download PDF and observe how to make your presentation outstanding. Give an impeccable presentation to your group and make your presentation unforgettable.

Logistics KPI Status Dashboard With Monthly KPI Ppt Infographic Template Layout PDF
The following slide highlights the transportation status dashboard with monthly KPI illustrating order status with customer, order date and delivery date. It shows financial performance for four quarters as well as todays order, inventory and monthly KPI with Inventory, shipping cost for past 30 days. Pitch your topic with ease and precision using this Logistics KPI Status Dashboard With Monthly KPI Ppt Infographic Template Layout PDF. This layout presents information on Order Status, Today Order, Inventory, Monthly KPI. It is also available for immediate download and adjustment. So, changes can be made in the color, design, graphics or any other component to create a unique layout.
Deploying Cloud Technology Cloud Dashboard For Tracking Project Sprints Ppt Infographics Brochure PDF
The following slide depicts cloud dashboard for monitoring project sprints. It provides information about sprint blockers, resolved issues, under performers, sprint health, releases, sprint burndown, etc. Boost your pitch with our creative Deploying Cloud Technology Cloud Dashboard For Tracking Project Sprints Ppt Infographics Brochure PDF. Deliver an awe-inspiring pitch that will mesmerize everyone. Using these presentation templates you will surely catch everyones attention. You can browse the ppts collection on our website. We have researchers who are experts at creating the right content for the templates. So you do not have to invest time in any additional work. Just grab the template now and use them.
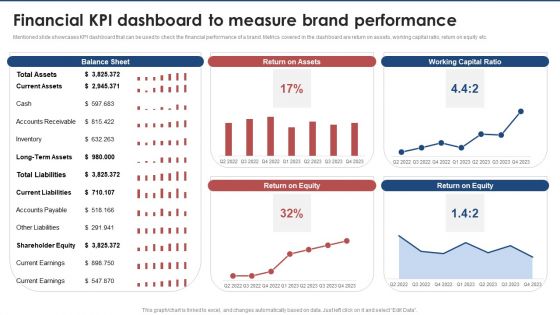
Financial Kpi Dashboard To Measure Brand Performance Brand Value Estimation Guide Inspiration PDF
Mentioned slide showcases KPI dashboard that can be used to check the financial performance of a brand. Metrics covered in the dashboard are return on assets, working capital ratio, return on equity etc.Are you in need of a template that can accommodate all of your creative concepts This one is crafted professionally and can be altered to fit any style. Use it with Google Slides or PowerPoint. Include striking photographs, symbols, depictions, and other visuals. Fill, move around, or remove text boxes as desired. Test out color palettes and font mixtures. Edit and save your work, or work with colleagues. Download Financial Kpi Dashboard To Measure Brand Performance Brand Value Estimation Guide Inspiration PDF and observe how to make your presentation outstanding. Give an impeccable presentation to your group and make your presentation unforgettable.

 Home
Home